Prof.&Emiliano&Pagnotta
epagnott@ic.ac.uk
Autumn&2016
Corporate(Finance

Estimating(Risk(Premiums(in(Practice
1. Survey&investors&on&their&desired&risk&premiums&and&use&the&
average&premium&from&these&surveys.
2. Assume&that&the&actual&premium&delivered&over&long&time&
periods&is&equal&to&the&expected&premium&–i.e.,&use&historical&
data
3. Estimate&the&implied&premium&in&todays&asset&prices.

What(is(your(risk(premium?
¨Assume& that&stocks&are&the&only&risky&assets& and&that&you&are&offered&two&
investment& options:
¤a&riskless&investment&(say&a&Government&Security),&on&which&you&can&make&3%
¤a&mutual&fund&of&all&&stocks,&on&which&the&returns&are&uncertain
¨How&much&of&an&expected& return&would&you&demand&to&shift&your&money&from&the&
riskless& asset&to&the&mutual&fund?
a. Less&than&3%
b. Between& 3%&–5%
c. Between& &5%&–7%
d. Between& &7%&–9%
e. Between& 9%–11%
f. More&than&&11%
The(Survey(Approach
¨Surveying&all&investors& in&a&market&place&is&impractical.
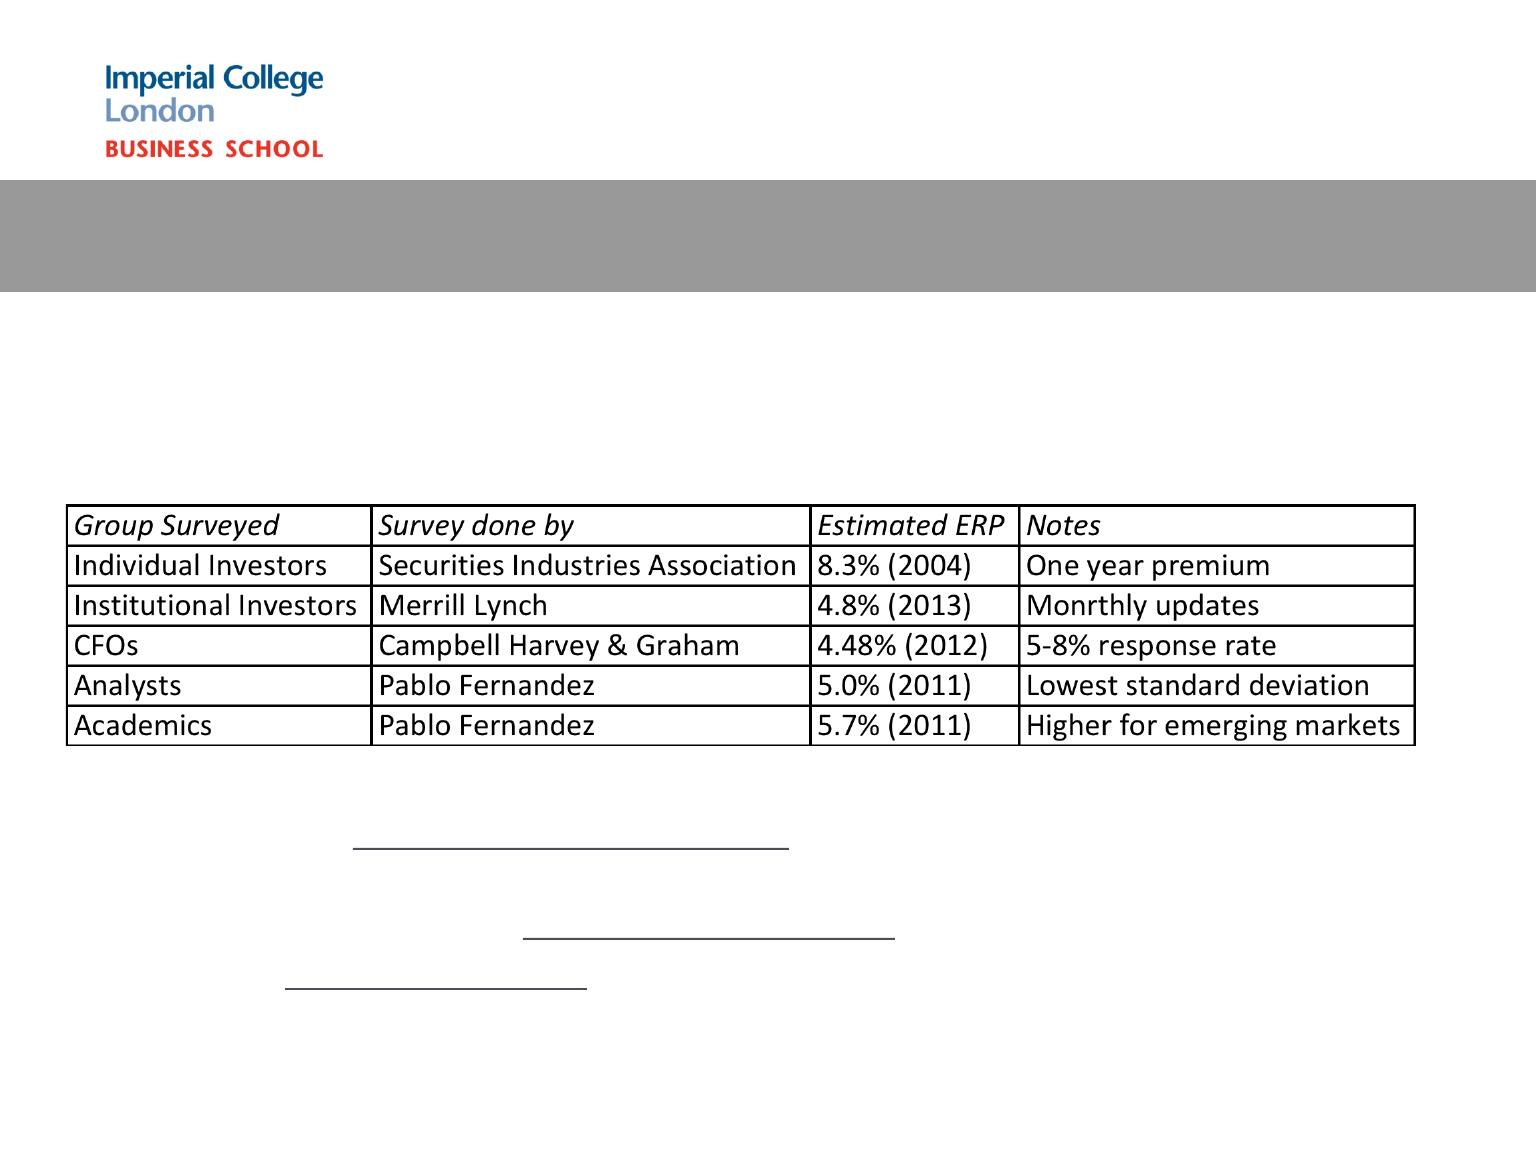
¨However,&you&can&survey&a&few&individuals& and&use&these& results.&In&practice,&this&
translates& into&surveys&of&the&following:
¨The&limitations& of&this&approach&are:
¤There&are&no&constraints&on&reasonability&(the&survey&could&produce&negative&risk&
premiums&or&risk&premiums&of&50%)
¤The&survey&results&are&more&reflective&of&the&past than&the&future.
¤They&tend&to&be&short&term;&even&the&longest&surveys&do¬&go&beyond&one&year.

The(Historical(Premium(Approach
¨This&is&the&default&approach&used&by&most&to&arrive&at&the&premium&to&use&in&the&
model
¨In&most&cases,&this&approach&does&the&following
¤Defines&a&time&period&for&the&estimation&(1928–Present,&last&50&years...)
¤Calculates&average&returns&on&a&stock&index&during&the&period
¤Calculates&average&returns&on&a&riskless&security&over&the&period
¤Calculates&the&difference& between& the&two&averages&and&uses&it&as&a&premium&looking&
forward.
¨The&limitations& of&this&approach&are:
¤it&assumes&that&the&risk&aversion&of&investors&has¬&changed&in&a&systematic&way&across&
time.&(The&risk&aversion&may&change&from&year&to&year,&but&it&reverts&back&to&historical&
averages)
¤it&assumes&that&the&riskiness&of&the&“risky”portfolio&(stock&index)&has¬&changed&in&a&
systematic&way&across&time.
¤Historical&data&for&markets&outside&the&United&States&and&the&U.K.&is&more&limited
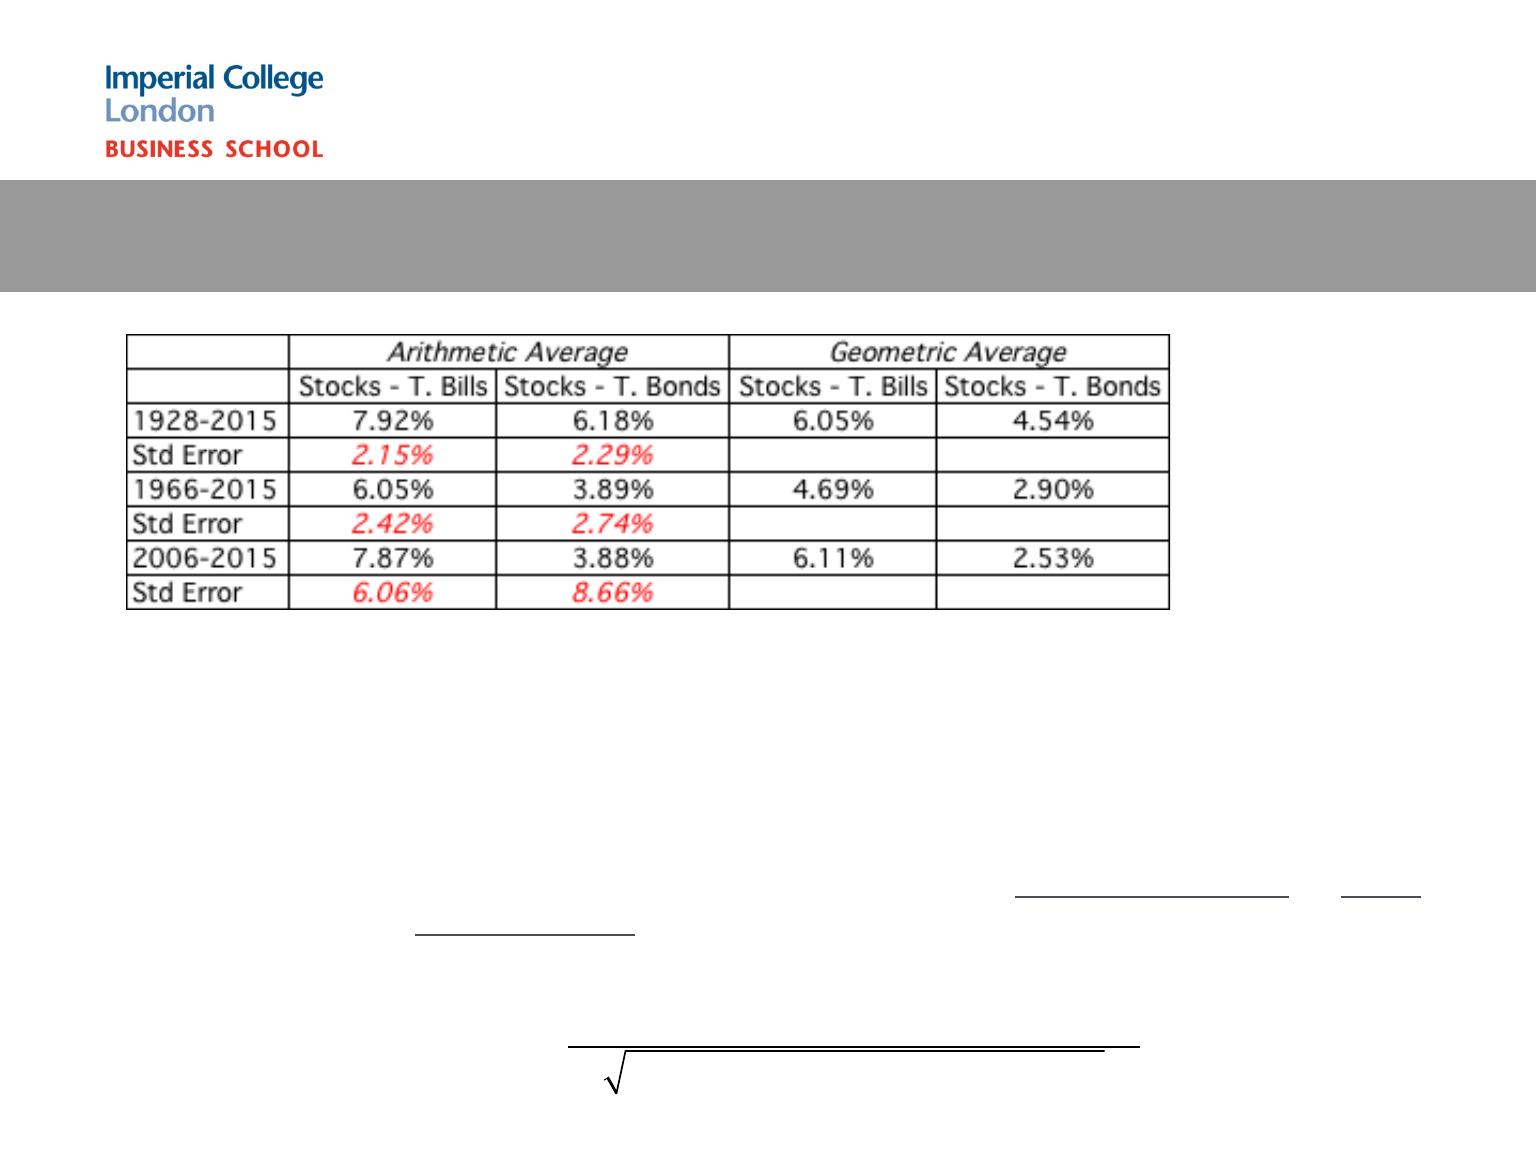
The(Historical(Risk(Premium:((Evidence(from(the(United(States
•If&you&are&going&to&use&a&historical& risk&premium,&make&it
•Long&term&(because& of&the&standard&error)
•Consistent& with&your&risk&free&rate
•A&“compounded”&average.&For&long–term&analysis&geometric& avg.&is&better.
•No&matter&which&estimate& you&use,&recognize&that&it&is&backward&looking,&is&noisy
and&may&reflect&selection& bias.
Historical
premium for the
US
Std Error in estimate = Annualized Std deviation in Stock prices
Number of years of historical data )
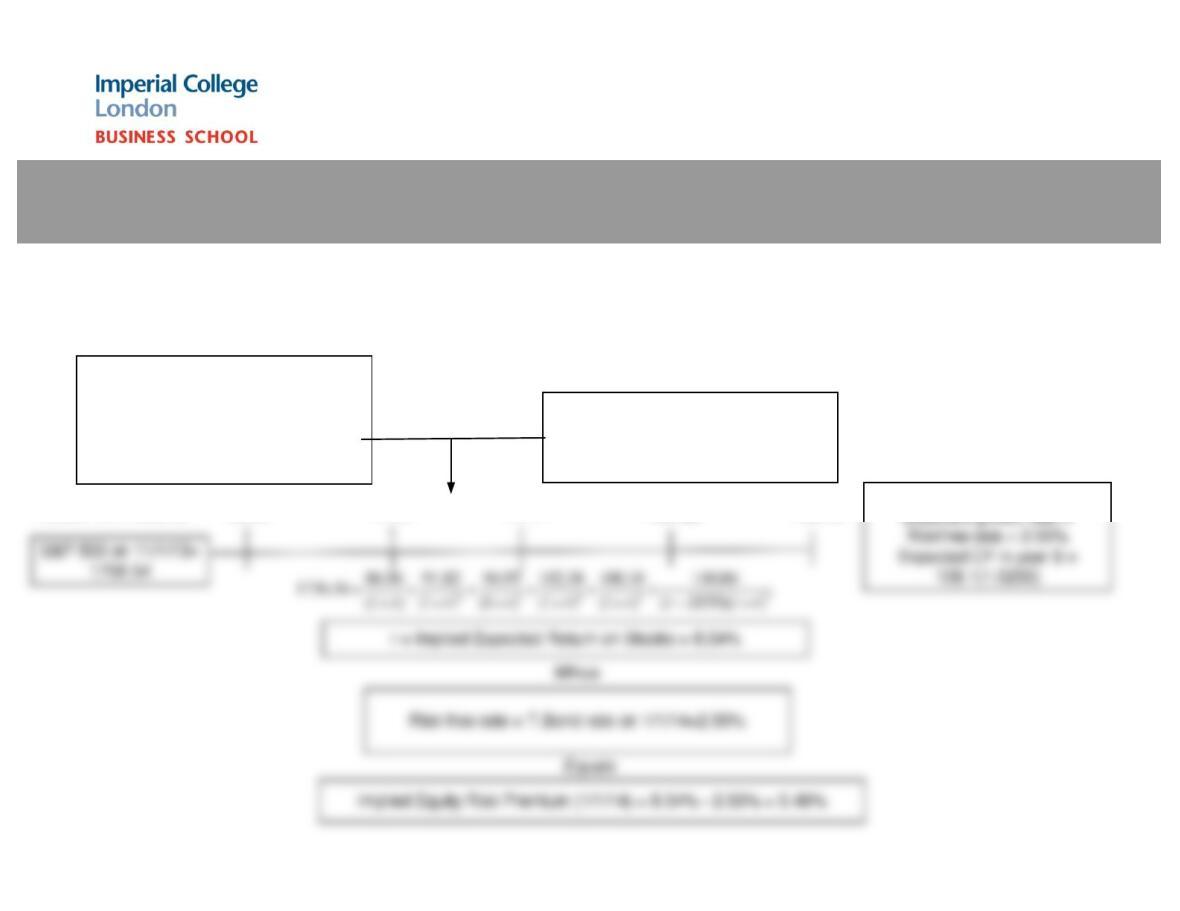
Implied(ERP(in(Nov.(2013:(Watch(what(I(pay,(not(what(I(say..
qIf&you&can&observe&what&investors& are&willing&to&pay&for&stocks,&you&can&back&out&an&
expected& return& from&that& price&and&an&implied& equity& risk&premium.
Base year cash flow (last 12 mths)
Dividends (TTM): 33.22
+ Buybacks (TTM): 49.02
= Cash to investors (TTM): 82.35
Earnings in TTM:
Expected growth in next 5 years
Top down analyst estimate of
earnings growth for S&P 500 with
stable payout: 5.59%
86.96 91.82 96.95
102.38
108.10 Beyond year 5
E(Cash to investors)