
JM Financial Institutional Securities Limited Page 2
INDIA | CONSUMER | INITIATING COVERAGE
2 April 2018
TABLE OF CONTENTS
Key investment thesis 3
Key charts 4
DMart’s impressive unit-economics make a compelling investment case 5
LFL growth can possibly sustain in high-teens range over next several years 8
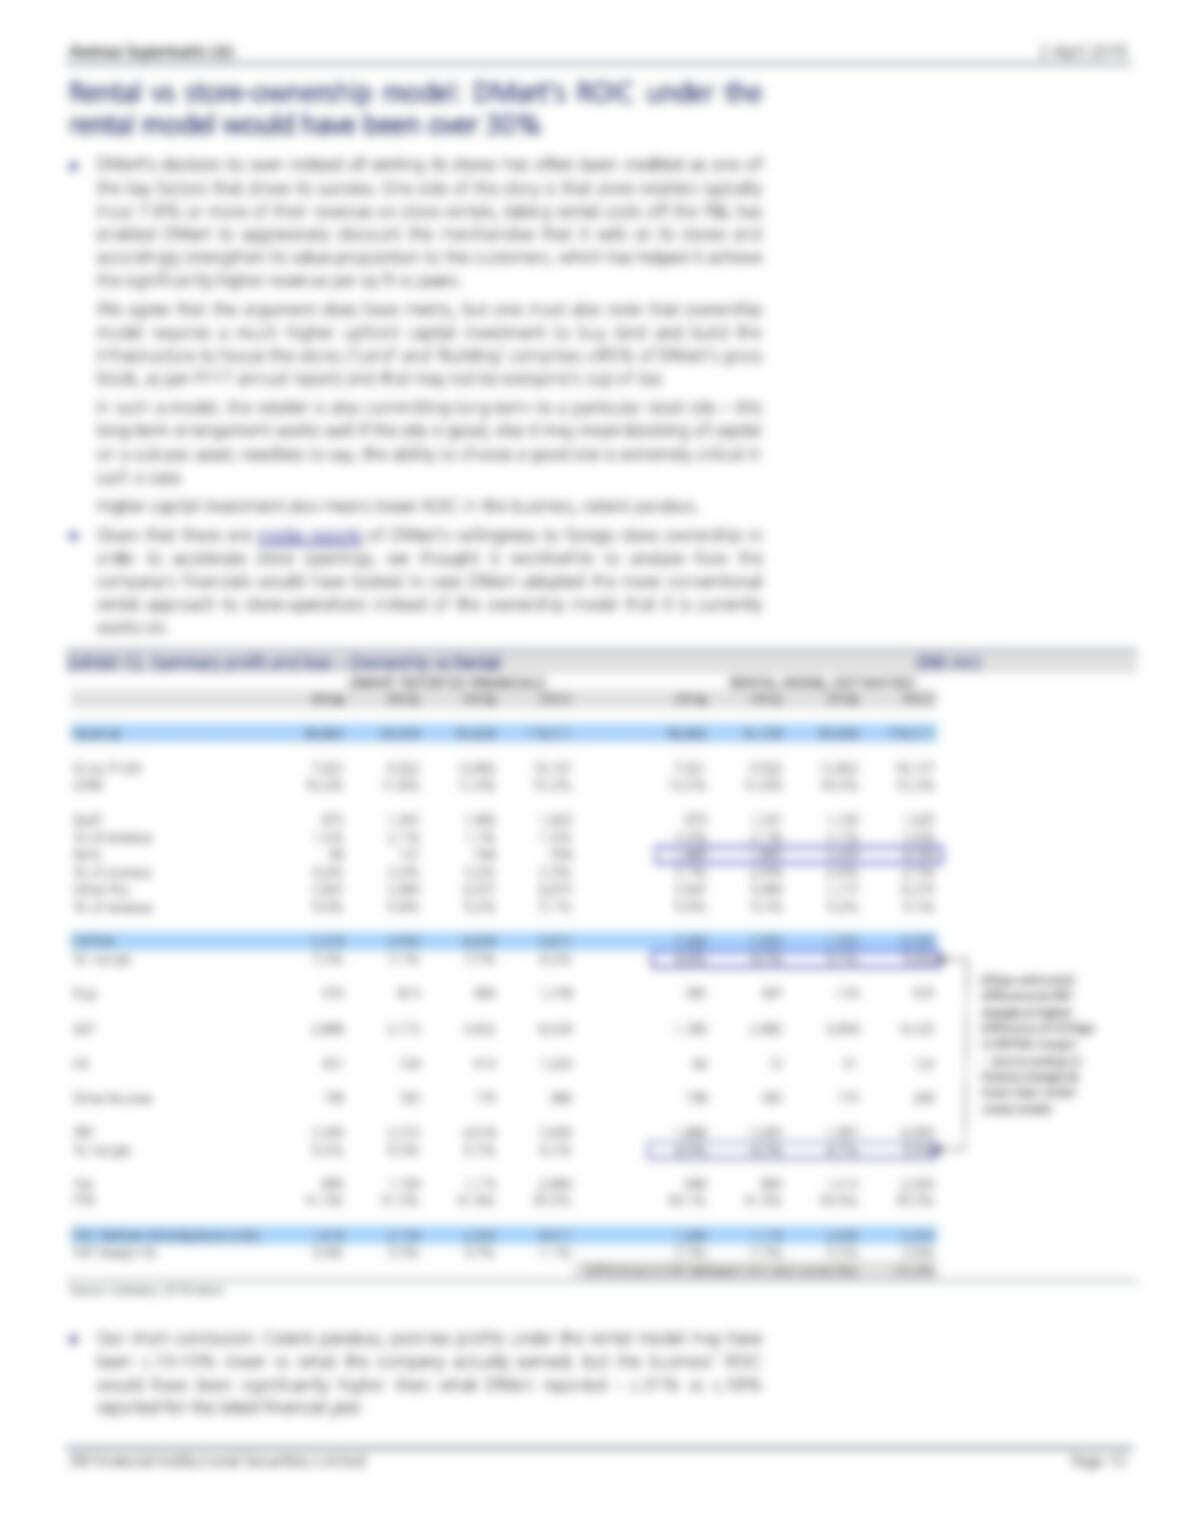
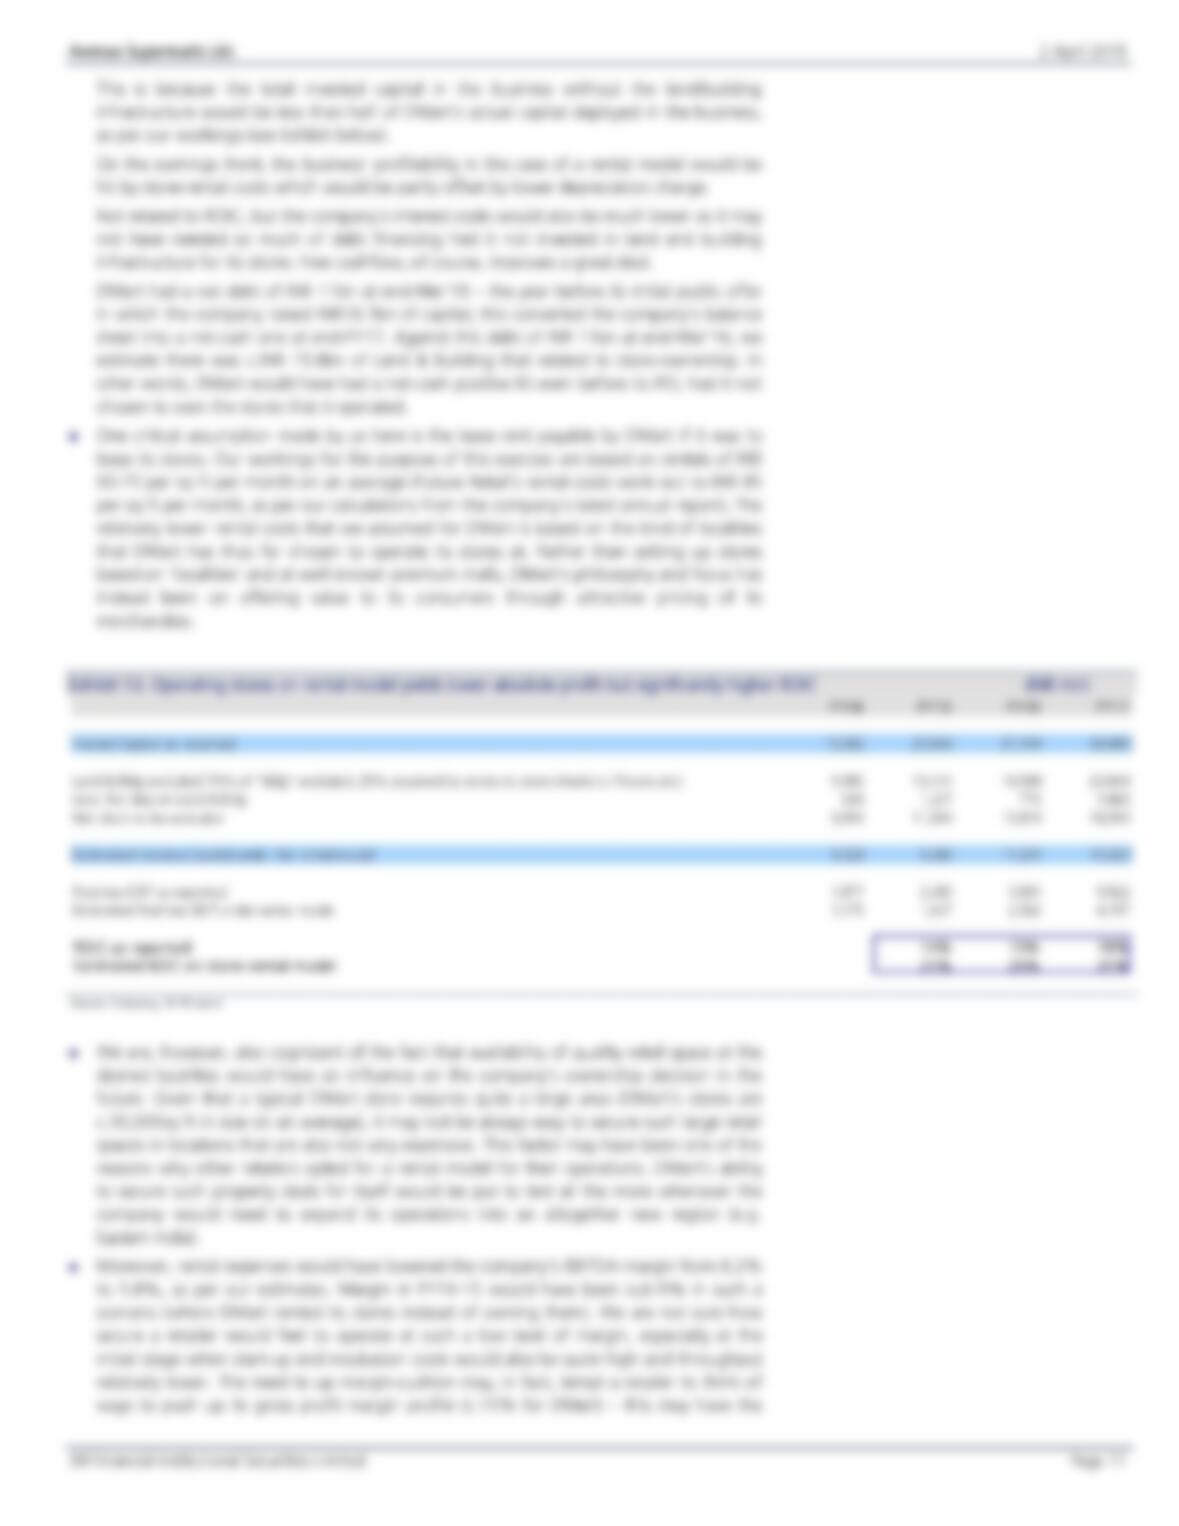
Rental vs ownership: ROIC under rental model would have been over 30% 10
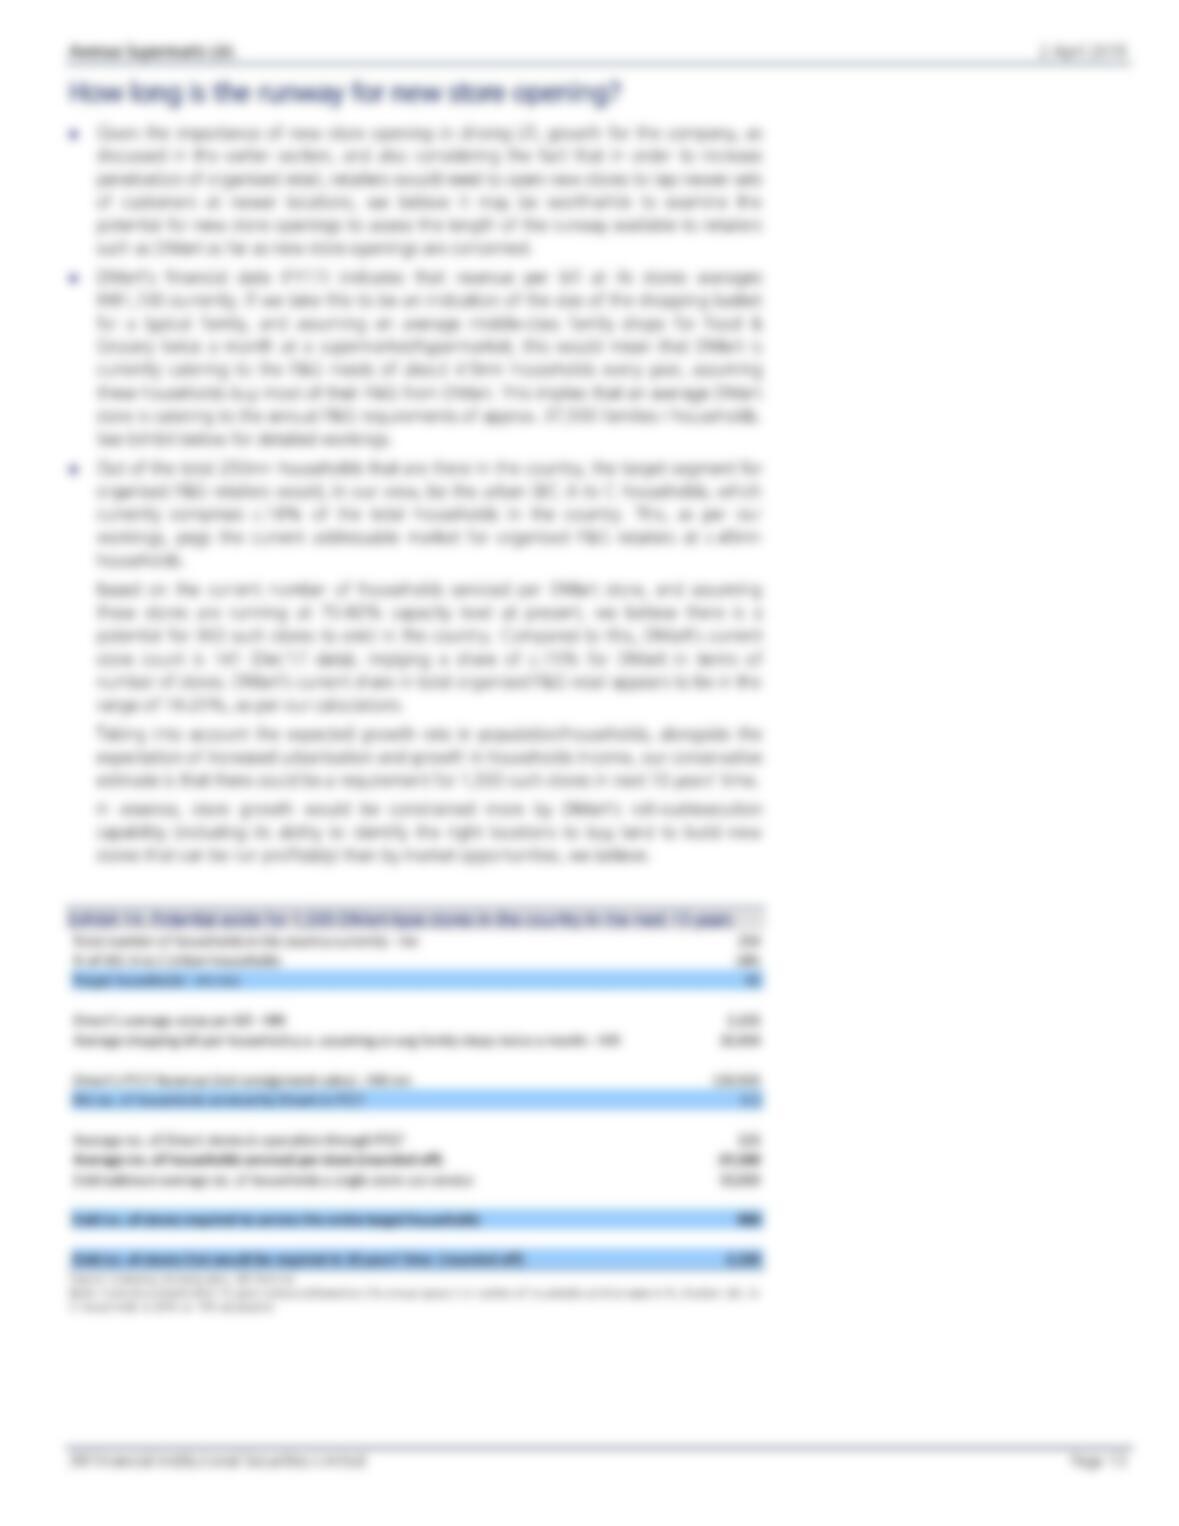
How long is the runway for new store opening? 13
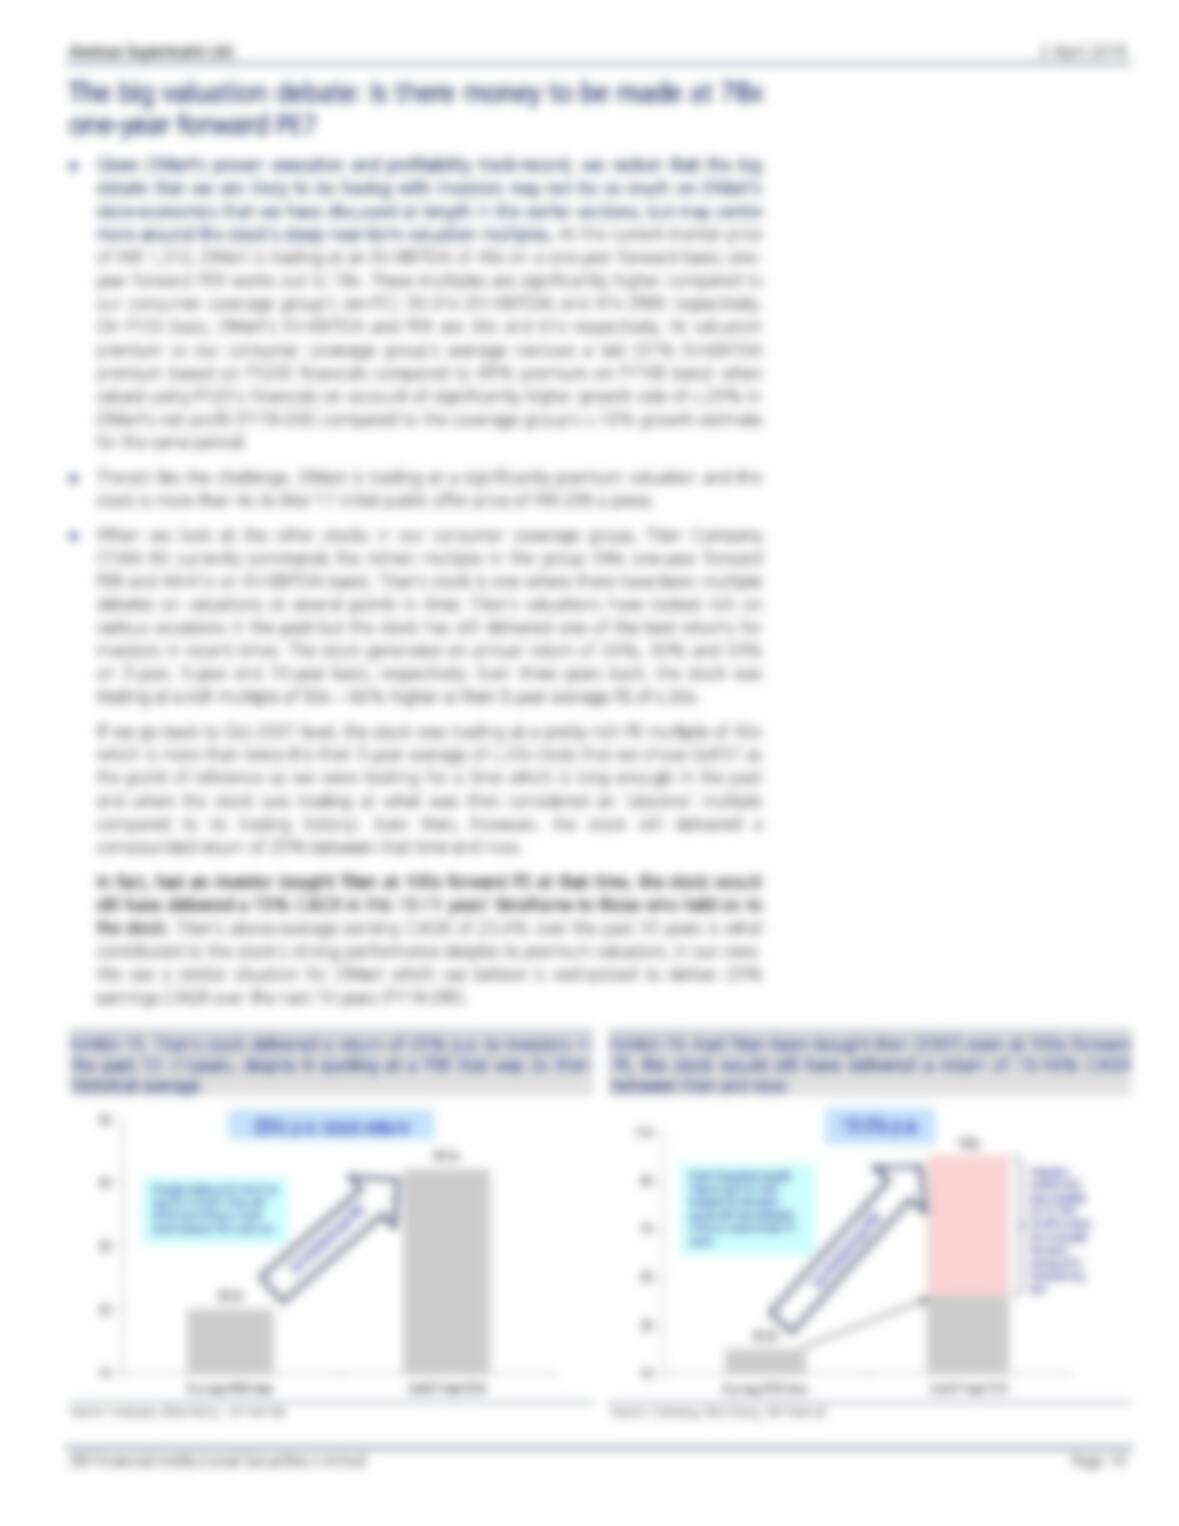
The big valuation debate: Is there money to be made at 78x one-year forward PE? 14
Key financial summary 16
Valuation and target price 21
Key risks 24
Annexure I: Indian organised grocery retailing is a multi-decade growth opportunity 25
Annexure II: Business Overview: Best-in-class Food & Grocery retailer 28
Annexure III: Management profile 31
Financial tables 32
Indian organised retail is a multi-decade growth opportunity. DMart
stores’ impeccable unit-economics position it well to profitably
capitalise on the same.
Three reasons to read this report:
1. Deep-dive into DMart’s single-store economics.
2. Decoding how DMart’s financials would have looked had it adopted
the conventional retail model of leasing stores.
3. Our take on whether there is still money to be made at 78x one-
year forward PE.
RECENT INITIATIONS
JM Financial Research
is also available on:
Bloomberg – JMFR
<GO>, Thomson
Publisher & Reuters
S&P Capital IQ and
FactSet
Parag Milk Foods
Westlife
Development
Prataap
Snacks
Galaxy Surfactants
Reliance Nippon Life
Asset Management
You can also access
our portal
www.jmflresearch.com

JM Financial Institutional Securities Limited Page 3
INDIA | CONSUMER | INITIATING COVERAGE
2 April 2018
AVENUE SUPERMARTS LIMITED (DMART IN)
BUY, and don’t sell if it ain’t broke
Let’s deal with the valuation argument upfront – is there money to be
made at 78x 12M forward PE?
It is interesting to note that an investor who bought Titan 10-11 years
ago when it was trading at twice (42x) its then 5-year average PER
(c.20x) has still made a return of 25% p.a. on the stock. Notably, even
if the stock was bought at a 100x forward PE at that time, the return
would still have been 15.6% p.a. An above-average EPS CAGR of
23.4% over the last 10 years is what drove Titan’s strong stock
performance notwithstanding its rich valuation, in our view. We see a
similar growth trajectory panning out for DMart, which, as per our
workings, is well-poised to compound earnings at c.25% p.a. over the
next 10 years. DMart stores’ impressive unit-economics make a
compelling investment case. Our analysis of the network’s age-profile
suggests that DMart’s LFL growth can sustain in the high–teens range
over the next several years.
Long growth runway in place; our target price of INR 1,675/share
presents a 28% upside vs CMP:
Our framework for analysing the potential for F&G retail in India
suggests that there could be opportunity for 1,500 large-format F&G
stores in India; as such, there is a long runway for store growth in the
country and DMart’s impeccable store-economics model makes it best-
placed to take advantage of this opportunity, in our view. DMart’s
network currently comprises 141 stores only (Dec’17). We forecast
27%, 29% and 35% revenue, EBITDA and net profit CAGR,
respectively, over FY17-22E and value the stock at INR 1,675 per share
(DCF-based). Near-term valuation multiples are undoubtedly rich (46x
one-year forward EV-EBITDA, 78x PE) but then, a cashflow-backed
earning compounder rarely fails on delivery.
We launch coverage on DMart, the best–in–
class Food & Grocery (F&G) retailer in India
with a BUY rating. We see 28% upside on
the stock; our DCF-based target price works
out to INR 1,675 per share.
The attractiveness of DMart’s operating
model stems from the significantly higher
level of throughput that its stores generate –
nearly 2-3x what other retailers clock on an
average, which helps justify its choice of
owning the stores (including the cost of
land on which they are built), and the
discounts (‘Every Day Low Price’ instead of
festivals or seasons related limited period
discounts) that it pampers its shoppers with
– the latter being one of the key drivers of
footfalls and conversions for DMart, in our
view. Our analysis of the unit-economics of
a representative DMart store suggests that
the IRR it generates is in excess of 20% over
a 20-year lifespan, without even considering
terminal value or asset-release at the end of
the period; a typical DMart store gets to a
mid-teens ROIC by its 4th year of operations,
comfortably scaling up to c.50% by the 10th
year, as per our workings. We estimate the
company’s FY21E blended post-tax ROIC to
be c.25%.
Recommendation and Price Target
Current Reco.
BUY
Previous Reco.
NR
Current Price Target (12M)
INR 1,675
Upside/(Downside)
27.7%
Previous Price Target
NA
Change
NA
Key Data – DMART IN
Current Market Price
INR 1,312
Market cap (bn)
INR 826.8/US$ 12.7
Free Float
41%
Shares in issue (mn)
624.1
Diluted share (mn)
624.1
3-mon avg daily val (mn)
INR 982.2/US$ 15.1
52-week range
1,387/615
Sensex/Nifty
32,969/10,114
INR/US$
65.2
Price Performance
%
1M
6M
12M
Absolute
-1.7
26.9
110.7
Relative*
1.9
20.4
87.9
* To the BSE Sensex
Financial Summary (INR mn)
Y/E March
FY16A
FY17A
FY18E
FY19E
FY20E
Net Sales
85,655
118,746
154,493
195,457
247,497
Sales growth (%)
33.3%
38.6%
30.1%
26.5%
26.6%
EBITDA
6,636
9,812
13,684
17,625
22,386
EBITDA (%)
7.7%
8.3%
8.9%
9.0%
9.0%
Adjusted net profit
3,203
4,803
8,002
10,515
13,389
EPS (INR)
5.7
7.7
12.8
16.8
21.5
EPS growth (%)
50.3%
34.9%
66.6%
31.4%
27.3%
ROIC (%)
15.3%
17.8%
21.0%
22.7%
23.7%
ROE (%)
23.6%
17.9%
18.9%
21.0%
22.9%
PE (x)
230.0
170.5
102.3
77.9
61.2
Price/Book Value (x)
48.5
21.3
17.6
15.2
13.0
EV/EBITDA (x)
112.7
83.0
59.3
46.2
36.4
Dividend Yield (%)
0.0%
0.0%
0.0%
0.3%
0.4%
Source: Company data, JM Financial. Note: Valuations as of 28/Mar/2018
Note: Pending FY18 Final Accounts, we have not yet incorporated GST related accounting changes in our model. Estimated
FY18E, FY19E, FY20E revenue under GST would be INR149bn, INR187bn and INR236bn. There is no material impact on absolute
EBITDA but % margin under GST accounting would be higher at 9.2%, 9.4% and 9.5% respectively.
Please see Appendix I at the end of this report for Important Disclosures and Disclaimers and Research Analyst
Certification.
Richard Liu
Richard.Liu@jmfl.com
Tel: (91 22) 6630 3064
Vicky Punjabi
Vicky.Punjabi@jmfl.com
Tel: (91 22) 6630 3065
Avenue Supermarts Ltd. 2 April 2018
JM Financial Institutional Securities Limited Page 4
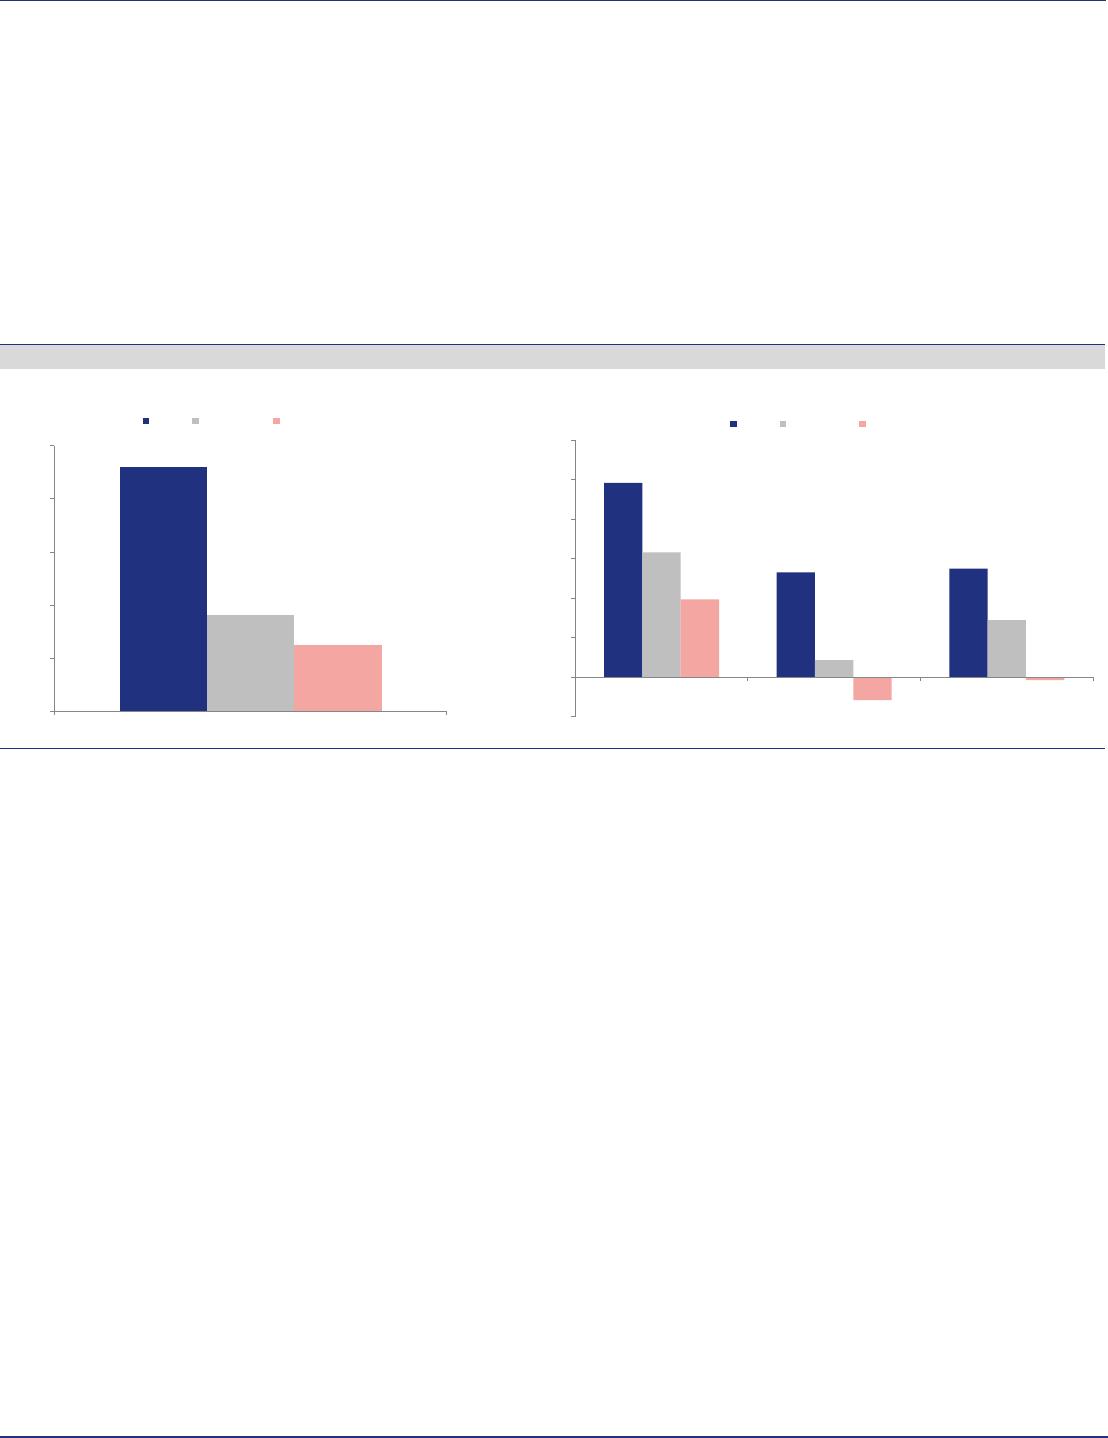
Key charts
Organised retail in India is a multi-decade growth
Exhibit 1.
opportunity…
Source: Avenue Supermarts Ltd IPO Prospectus, JM Financial
…and DMart’s best–in-class store-economics make it best-
Exhibit 2.
placed to leverage the opportunity…
Source: Company, JM Financial
…as evident from its strong pace of growth…
Exhibit 3.
a
Source: Company, JM Financial
…alongside consistent improvement in profitability and
Exhibit 4.
return-ratios
Source: Company, JM Financial
Valuation is undoubtedly rich…
Exhibit 5.
a
Source: Company, Bloomberg, JM Financial
…but history suggests premium multiple need not be a
Exhibit 6.
constraint for stock performance if earnings compound well
Source: Company, Bloomberg, JM Financial
Organised
Retail
9%
Unorganised
91%
Indian Retail Industry – 2016
Organised
Retail
12%
Unorganised
88%
Indian Retail Industry –2020E
Food & Grocery accounted
for 67% of 2016 retail trade
CAGR = 20%
–2% 1%
3% 5%
6% 6% 7% 7% 7% 8% 8% 8% 8% 8% 8% 8% 9% 8% 9% 9%
–3% 1%
8% 16%
23%
28%
32%
39%
45%
51%
56% 56% 56%
62%
69%
76%
83% 80% 79%
86%
1.2
1.8
2.6
3.3
4.1 4.4 4.7
5.4
6.0
6.6
7.2 7.1 7.0
7.6
8.3
9.0
9.7 9.4 9.2
9.9
0
2
4
6
8
10
-10%
10%
30%
50%
70%
90%
Y1 Y3 Y5 Y7 Y9 Y11 Y13 Y15 Y17 Y19
Store Profitability Metrics
NOPAT margin – % (Store-level) Store-level ROIC % Asset-turns (x) – RHS
Y20
IRR: 24-25%
20%
32%
26%
22% 21% 21% 20%
18%
16%
0%
5%
10%
15%
20%
25%
30%
35%
FY12 FY13 FY14 FY15 FY16 FY17 FY18E FY19E FY20E
SSSG
7%
10%
13% 14%
15%
18% 21% 23% 24%
6.2% 6.4%
7.3% 7.1%
7.7%
8.2%
8.8% 9.0% 9.0%
0%
2%
4%
6%
8%
10%
0%
5%
10%
15%
20%
25%
FY12 FY13 FY14 FY15 FY16 FY17 FY18E FY19E FY20E
Post-tax ROIC % EBITDA margin – %
22
29
36
43
50
Mar-17 Jun-17 Sep-17 Dec-17 Mar-18
EV/EBITDA Avg EV/EBITDA +1SD -1SD
20.2x
100x
0
22
44
66
88
110
5-yr avg PER then Oct’07 Fwd PER
Titan Company Stock Performance in last 10-11 years
Even if investors bought
Titan in 10-11 years ago at
100x forward PE, the
stock would still have
delivered a return of 15-
Valuation cushion
that was available
for 15-16% CAGR
in stock return
despite the stock
trading at 2x
Even if investors bought
Titan in 10-11 years ago at
100x forward PE, the
stock would still have
delivered a return of 15-
Valuation cushion
that was available
for 15-16% CAGR
in stock return
despite the stock
trading at 2x
historical avg then
42x
Titan stock delivered
return of 25.6% p.a. in past
10-11 years – despite it
trading at 2x then historical
avg PE
Avenue Supermarts Ltd. 2 April 2018
JM Financial Institutional Securities Limited Page 5
DMart’s impressive unit-economics make a compelling
investment case
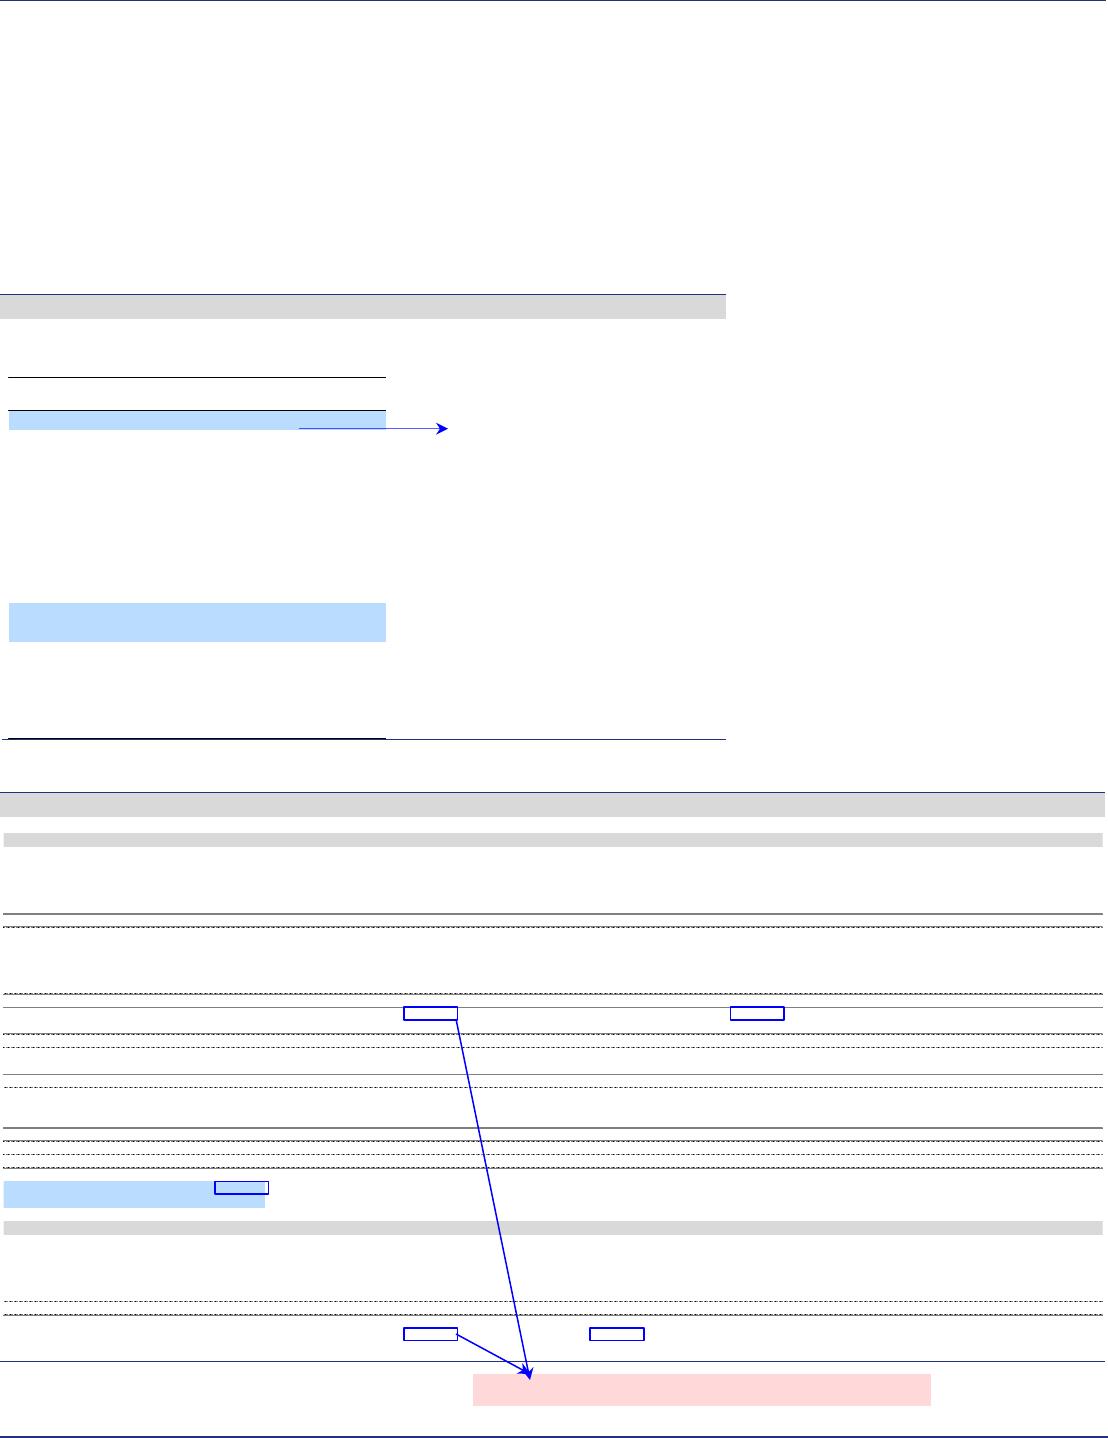
The attractiveness of DMart’s operating model is driven by the significantly high level of
throughput that its stores generates, which is nearly 2-3x what other retailers clock. The
high store throughput does help justify the cost of ownership of the stores (including the
cost of land on which they are built), and the higher discounts (‘Every Day Low Price’
instead of festivals or seasons related limited period discounts) that its shoppers enjoy.
The other factor is the consistent focus on operational efficiencies by the management
team, the benefits of which are ploughed back to offer the most attractive pricing for its
customers. Given that a typical middle-class Indian shopper is most concerned about
‘value-for-money’ (many quick dip-stick surveys confirm this fact), DMart’s pricing–
focused value proposition is indeed working well for the business.
DMart’s revenue and profitability metrics are significantly superior vs peers’ Exhibit 7.
Revenue per sq ft comparison (INR) Profitability per sq ft comparison (INR)
Source: Companies data, JM Financial
Note: Future Retail’s sq ft include area allocated for store back-end; accordingly, its revenue and profitability per sq ft in the above table would be slightly understated to that extent.
Given that DMart does not operate out of ‘expensive’ locations, its rental costs, had it
adopted the conventional retail model of leasing stores akin to what most of its peers
follow, would have anyway still been lower vs competitors’ and the company may have
enjoyed the same efficiencies and still have been able to price its products as attractively
even then. Refer later section in this report on our analysis of what DMart’s financials
would have looked like under the rental model. DMart’s store-ownership model,
however, helps it to choose the ‘best’ location since there is no constraint that stores
would need to be necessarily set up only in locations that are available on rent at what is
deemed to be ‘reasonable lease rates’. DMart has, in fact, the flexibility to choose and
own any of the locations that it finds suitable for operating stores.
On the flip side, the other way to look at DMart’s ownership model is that since its
modus-operandi is to only open stores at less-expensive places, there may not be ready-
made malls operating therein (since malls are typically set up in more well-known
localities which, by their nature, would mean higher rental costs) and hence DMart
needed to necessarily own its stores if it had to operate at these locations.
Be that as it may, the company’s financial performance reports suggest that DMart’s
choice of owning the stores has worked extremely well for itself. Our conversations with
other retailers have also led us to a rather obvious conclusion that in the retail business, it
is absolutely important to have stores at one’s disposal for a long-enough period of time,
as a newly-opened store typically takes some time to mature and reach an optimal level
of operations. If a retailer has to give up the store for some reason and move to a new
location just when an existing store is maturing, the situation becomes rather sub-optimal
as the retailer will land up incubating a new store at a new location all over again, besides
losing out on perhaps what could have been the most profitable periods for the erstwhile
store that the retailer had been incubating thus far.
0
7,000
14,000
21,000
28,000
35,000
FY17 Revenue per avg sq ft
DMart Future Retail Hypercity
-1,000
0
1,000
2,000
3,000
4,000
5,000
6,000
FY17 Gross Profit per avg sq ft FY17 EBITDA per avg sq ft EBITDA per avg sq ft – before Rent
DMart Future Retail Hypercity
Avenue Supermarts Ltd. 2 April 2018
JM Financial Institutional Securities Limited Page 6
In the illustration below, we present our analysis of what the profitability and cash-
generation potential of a typical DMart store over a long period of operations look like.
This is based on our understanding of the philosophy that DMart follows and the
milestones that management seeks to achieve when it decides to open a new store.
We are taking a period of 20 years in our illustration, though the total lifespan of a store
could in fact be longer since DMart owns its stores including the land on which they are
constructed, and hence can operate the store out of the same location for a prolonged
period of time, in our view. It is to be noted, though, that no DMart store has completed
20 years of operations so far since the first DMart store was launched only in 2002.
Analysis of store-economics of a representative DMart outlet
DMart – Single-store data (using FY17 financials as base for calculations) Exhibit 8.
Source: Company data, JM Financial
The IRR of a representative DMart store is c.25% on an average, as per our analysis (INR mn) Exhibit 9.
Source: JM Financial
FY17 FY17
Avg Store Size – Sq ft 31,000 31,000
Per sq ft
(INR)
Per Store
(INR mn)
Net Sales 32,137 996
Gross Profit 4,917 152
Gross Profit margin – % 15.3% 15.3%
Staff Costs 365 11
Contract labour charges 796 25
Electricity and fuel 269 8
Others 232 7
Estimated Store-level SG&A 1,662 52
Estimated Store-level EBITDA 3,254 101
Store-level cash margin % 10.1% 10.1%
Capex: INR per sq ft INR per store
Land 3,567 111
Buildings and fit-outs 5,145 159
Total Capex 8,712 270
Year 1 2 3 4 5 6 7 8 9 10 11 12 13 14 15 16 17 18 19 20
Gross Fixed Asset Turns (x) 1.2 1.8 2.6 3.4 4.2 4.9 5.6
Revenue 324 486 702 918 1,134 1,323 1,512 1,709 1,880 2,049 2,192 2,324 2,463 2,611 2,768 2,934 3,110 3,297 3,494 3,704
% YoY Growth 50.0% 44.4% 30.8% 23.5% 16.7% 14.3% 13.0% 10.0% 9.0% 7.0% 6.0% 6.0% 6.0% 6.0% 6.0% 6.0% 6.0% 6.0% 6.0%
Sales per sq ft 10,454 15,681 22,651 29,620 36,589 42,688 48,786 55,128 60,641 66,099 70,725 74,969 79,467 84,235 89,289 94,647 100,325 106,345 112,726 119,489
Gross profit 43 67 100 134 169 201 234 268 297 326 351 374 399 426 454 484 513 544 577 611
Gross margin 13.3% 13.8% 14.3% 14.6% 14.9% 15.2% 15.5% 15.7% 15.8% 15.9% 16.0% 16.1% 16.2% 16.3% 16.4% 16.5% 16.5% 16.5% 16.5% 16.5%
Staff and Labour costs 29 34 36 37 39 41 42 44 46 48 50 52 54 56 58 60 63 65 68 71
Inflation – % 6.0% 4.5% 4.5% 4.5% 4.0% 4.0% 4.0% 4.0% 4.0% 4.0% 4.0% 4.0% 4.0% 4.0% 4.0% 4.0% 4.0% 4.0% 4.0%
Others 14 16 17 18 18 19 19 20 21 21 22 23 23 24 25 25 26 27 28 29
6.0% 3.5% 3.5% 3.5% 3.5% 3.0% 3.0% 3.0% 3.0% 3.0% 3.0% 3.0% 3.0% 3.0% 3.0% 3.0% 3.0% 3.0% 3.0%
EBITDA 0 16 47 79 112 141 173 204 231 257 279 300 322 346 371 398 424 452 481 512
EBITDA margin – % 0.1% 3.3% 6.8% 8.6% 9.8% 10.7% 11.4% 11.9% 12.3% 12.5% 12.7% 12.9% 13.1% 13.2% 13.4% 13.6% 13.6% 13.7% 13.8% 13.8%
Depreciation 12 12 12 12 12 14 14 14 14 14 14 17 17 17 17 17 17 21 21 21
EBIT -12 4 35 67 99 127 158 190 216 242 265 283 305 329 354 381 407 431 460 491
Tax -4 112 23 35 44 55 66 76 85 93 99 107 115 124 133 142 151 161 172
Tax rate – % 35.0% 35.0% 35.0% 35.0% 35.0% 35.0% 35.0% 35.0% 35.0% 35.0% 35.0% 35.0% 35.0% 35.0% 35.0% 35.0% 35.0% 35.0% 35.0% 35.0%
NOPAT -8 323 43 65 83 103 123 140 158 172 184 198 214 230 248 265 280 299 319
Add: Depreciation 12 12 12 12 12 14 14 14 14 14 14 17 17 17 17 17 17 21 21 21
Less: Capex 270 49 62 79
Less: NWC 19 10 13 13 13 11 11 12 10 10 9 8 8 9 9 10 10 11 12 12
Free Cash Flow -285 5 22 43 64 37 106 126 145 162 178 131 207 222 238 255 271 211 308 328
Discount Factor (WACC of 11%) 0.90 0.81 0.73 0.66 0.59 0.53 0.48 0.43 0.39 0.35 0.32 0.29 0.26 0.23 0.21 0.19 0.17 0.15 0.14 0.12
Present Value of FCF -257 4 16 28 38 20 51 55 57 57 56 37 53 52 50 48 46 32 42 41
IRR 24.6%
Net Present Value of a Store at 11% WACC 527
ROIC Workings
NWC – INR mn 19 29 42 55 68 79 90 102 112 122 131 138 147 156 165 175 185 196 208 221
NWC – % of sales 6.0% 6.0% 6.0% 6.0% 6.0% 6.0% 6.0% 6.0% 6.0% 6.0% 6.0% 6.0% 6.0% 6.0% 6.0% 6.0% 6.0% 6.0% 6.0% 6.0%
Gross Fixed Assets 270 270 270 270 270 319 319 319 319 319 319 381 381 381 381 381 381 460 460 460
Accumulated depreciation 12 24 36 49 61 75 89 104 118 133 147 164 181 198 216 233 250 271 291 312
Net Fixed Assets 258 246 234 221 209 244 230 215 201 187 172 217 200 183 166 148 131 189 168 148
Invested Capital 277 275 275 276 277 323 320 317 313 309 303 356 347 338 331 323 317 386 377 368
Post-tax ROIC -2.8% 1.0% 8.3% 15.7% 23.4% 27.6% 32.0% 38.7% 44.6% 50.7% 56.3% 55.9% 56.5% 62.4% 68.8% 75.8% 82.7% 79.8% 78.5% 85.7%
DMart’s INR 32k
sales per sq ft is
significantly ahead
of peers’
10% store-level margin & >25% post-tax ROIC by Year-6 of operation

Avenue Supermarts Ltd. 2 April 2018
JM Financial Institutional Securities Limited Page 7
As evident from the table above, our store-economics analysis suggests that DMart’s
model is highly attractive both from the perspective of profitability as well as cashflow
generation, notwithstanding the fact that the business has to incur significant sums of
capex to buy the land and build the store infrastructure and interiors initially. In contrast,
the capex required for opening a new leased-store would be much lower since the retailer
would typically incur expenses only on the store interiors and fit-outs.
We believe a representative DMart store can quite easily generate mid-teens ROIC by the
4th year of its operations which would comfortably scale-up to c.50% by the 10th year.
The IRR that a representative DMart store can generate over a 20-year period is in excess
of 20%, as per our workings, without considering terminal value or release of invested
capital at the end of the period. When compared to the cost of capital (11%), this
essentially reflects the highly cash-generative nature of DMart’s business model.
As mentioned earlier, the efficiency of DMart’s operating model and better profitability
are in large part driven by the higher throughput that its stores generate, which in turn is
boosted by the ‘Every Day Low Price’ value-for-money proposition that it provides to the
shoppers at its stores; of course, product assortments, choice and selections also have
important roles to play in attracting consumers to the stores. By the 7th year of a store’s
opening, we believe a representative DMart store would typically have a gross fixed asset
turn of >5x implying that its revenue would then have scaled up to >5x the initial capital
invested in opening the store (including the cost of land on which the store is built).
Our single-store economics model is based on the following assumptions:
– Average store size of 31,000 sq ft.
– Build-out capex of c.INR 8,710 per sq ft (as derived from DMart’s FY17 financials) –
this includes the cost of land, building and store fit-outs.
– Gross profit margin in the range of 13-16% – starting at the lower-end and assuming
sales-mix gets richer as time progresses.
– A steady scaling-up of revenue at the store (described in detail below).
– Given that a store’s operation is usually not at its optimum revenue potential in the
initial few years, our analysis also assumes that instore overheads and employee
related costs are at 80-90% of fully scaled-up level in the initial couple of years of
operations.
The company’s management had alluded that, on an average, a representative DMart
store clocks an asset-turn of 2x and EBITDA margin of 5% (pre-tax cash basis) by the end
of the second year of operation, and most stores reach their maturity by the 8th year of
operation beyond which growth gets to a level which is just about 1-1.5% higher vs
general rate of inflation in the economy.
In light of the above, while building the store ramp-up in our single-store model, we have
pencilled in an asset-turn of 1.2x in the store’s commencement year, 1.8x in Year-2 which
steadily ramps-up to c.5.5x by Year-7. It is also important to remember here that DMart’s
store capex is much higher (3-3.5x) compared to what its competitors incur, since it
adopts an ownership model for the stores that it runs and hence needs to buy the land as
well as to construct the stores’ infrastructure. In that context, a gross asset-turn of c.1x
itself in the first year translates into a rather healthy throughput in terms of scale. By the
end of the 6th year, we expect a store to generate per sq ft revenue of INR40,000+ which
would lift store-level EBITDA margin to 10%+ and ROIC (post-tax) of c.25%, as per our
workings.
Avenue Supermarts Ltd. 2 April 2018
DMart’s LFL growth can possibly sustain in high-teens range
over next several years
We transpose the learnings from our study of DMart’s single-store economics to analyse
the effect of new store openings on the ‘like-for-like’ (LFL) or same-store sales growth
that the company can clock over a period of time. DMart defines LFL growth to mean the
growth in revenue from sales of same stores which have been operational for at least 24
months at the end of a fiscal.
As per our analysis, revenue growth for a representative DMart store would remain well–
above the 20% mark upto the store’s 5th year of operation, and then slowly moderate to
sub-10% by the 10th year. The high growth phase upto year-5 (50%, 44%, 30%, 23% in
years 2, 3, 4 and 5 respectively, as per our estimates) is, of course, driven in large part by
the natural scale-up in footfalls and throughput to a more optimum level as the store
gains popularity with local residents and nearby shoppers over time.
Based on growth expectations as outlined above, it seems quite probable, to us, that
DMart can continue clocking near-20% LFL growth even until FY20E – which would
moderate by FY29E but still be at the mid-teens range. Interestingly, the analysis
effectively concludes that LFL growth is a lot dependent on the pace of new store
openings. It is important to have new stores growth, if LFL growth is to remain high; this
is because of the accelerated growth that new stores witness in the 2nd to 5th/6th year of
their operations. On the flipside, however, new stores are typically margin and also ROIC
dilutive, albeit for the initial phase only; we believe a DMart store clocks a positive EBIT in
year-2 itself and c.15% post-tax ROIC in the 4th year.
As at Mar’17, 38% of DMart’s “same-stores” are less than 5 years old which Exhibit 10.
helps lift LFL growth at an overall level
Stores Ageing – FY17 No. of stores SSSG
>8 years 30 9%