See discussions, stats, and author profiles for this publication at: https://www.researchgate.net/publication/254966765
Billionaire Entrepreneurs: A Systematic Analysis
Article · March 2013
CITATIONS
13
READS
1,347
2 authors:
Some of the authors of this publication are also working on these related projects:
Entrepreneurship and the Welfare State View project
Policies for high-growth firms View project
Magnus Henrekson
Research Institute of Industrial Economics
189 PUBLICATIONS7,958 CITATIONS
SEE PROFILE
Tino Sanandaji
Stockholm School of Economics
51 PUBLICATIONS528 CITATIONS
SEE PROFILE
All content following this page was uploaded by Magnus Henrekson on 05 November 2015.
The user has requested enhancement of the downloaded file.

Small business activity does not
measure entrepreneurship
Magnus Henrekson
1
and Tino Sanandaji
Research Institute of Industrial Economics, SE-102 15 Stockholm, Sweden
Edited* by William J. Baumol, New York University, New York, NY, and approved December 19, 2013 (received for review April 16, 2013)
Entrepreneurship policy mainly aims to promote innovative Schum-
peterian entrepreneurship. However, the rate of entrepreneurship
is commonly proxied using quantity-based metrics, such as small
business activity, the self-employment rate, or the number of
startups. We argue that those metrics give rise to misleading
inferences regarding high-impact Schumpeterian entrepreneur-
ship. To unambiguously identify high-impact entrepreneurs we
focus on self-made billionaires (in US dollars) who appear on For-
bes Magazine’slist and who became wealthy by founding new
firms. We identify 996 such billionaire entrepreneurs in 50 coun-
tries in 1996–2010, a systematic cross-country study of billionaire
entrepreneurs. The rate of billionaire entrepreneurs correlates
negatively with self-employment, small business ownership, and
firm startup rates. Countries with higher income, higher trust, lower
taxes, more venture capital investment, and lower regulatory
burdens have higher billionaire entrepreneurship rates but less
self-employment. Despite its limitations, the number of billion-
aire entrepreneurs appears to be a plausible cross-country mea-
sure of Schumpeterian entrepreneurship.
innovation
|
institutions
|
regulation
|
taxation
Given the prominence of entrepreneurship, it may come as
a surprise that there is no consensus on how it should be
defined in empirical research. Sometimes entrepreneurship is
used to refer to anyone operating a private business, regardless
of size and activity. Driven by greater data availability, most
empirical studies rely on definitions such as the self-employment
rate, the number of startups, and small business activity (1). In
other contexts, entrepreneurship refers to the subset of firms that
are innovative and growth-driven (2, 3). This Schumpeterian
definition of the entrepreneur as an innovator and as a driver of
growth dominates in theoretical entrepreneurship research and
in entrepreneurship policy (4, 5). Thus, when academics and
business leaders were asked to define entrepreneurship, the most
common choices were the creation and growth of new ventures
and innovation. By contrast, the creation of a mom-and-pop
business was not viewed as entrepreneurship (6).
Leaving aside the semantic discussion of what exactly con-
stitutes entrepreneurship, there is an important empirical issue
of how well commonly used operationalizations capture the rate
of Schumpeterian entrepreneurship. An implicit assumption appears
to be that countries and industries with a large number of small
firms and startups also tend to be those where most innovative
high-growth firms emerge.
However, an overwhelming majority of the self-employed are
not entrepreneurial in the Schumpeterian sense, as they never
bring a new innovation to the market and do not plan to grow
their business. In the United States, the industries with the
largest concentrations of self-employed men are construction,
landscaping services, auto repair, restaurants, truck trans-
portation, and farming. For women, the corresponding industries
include private households (cooks and maids), child day care
services, restaurants, and beauty salons. The majority of small
businesses in the United States have no employees other than the
owner. Nor do most small businesses eventually grow large.
Most small businesses are best described as permanently small
rather than nascent entrepreneurial firms.
Shane (7) argues that necessity-driven and opportunity
entrepreneurs should be treated separately, documenting a neg-
ative cross-country correlation between having many high- and
low-expectation startups. Baumol (3) distinguishes between
“innovative”and “replicative”entrepreneurs, where the former
are the type of entrepreneurs studied by Schumpeter (2). Hurst
and Pugsley (8) forcefully argue against using self-employment as
synonymous with entrepreneurship. They estimate that only 10–
20% of small businesses report any innovative activity at all and
point out that when new startups were asked about growth
ambitions, 75% of respondents stated that “I want a size I can
manage myself or with a few key employees”(ref. 8, p. 96).
Different types of business owners also differ in terms of per-
sonality traits (9).
Both types of businesses are important for a well-functioning
economy, but their workings are entirely different. Innovative
and replicative businesses operate in different ways, but are
not easily distinguishable in statistics, which means that special
approaches must be designed for empirical analysis.
One way through which scholars have attempted to distinguish
the different classes of firms is by restricting attention to “high-
impact entrepreneurs”(10, 11), which is to say those that grow
rapidly. The difficulty of estimating the rate of high-impact en-
trepreneurship in a standardized way across countries has thus
far prevented cross-country comparisons.
We propose a measure of high-impact Schumpeterian entre-
preneurship across countries using information from the Forbes
Magazine worldwide list of billionaires during 2 decades. Our
Significance
Schumpeterian entrepreneurship refers to growing and in-
novative firms. However, in empirical research the rate of entre-
preneurship is commonly estimated using the self-employment
rate or other measures of small business activity. We argue
that this empirical strategy gives rise to misleading inferences
regarding Schumpeterian entrepreneurship. To unambiguously
identify this type of entrepreneur we focus on self-made bil-
lionaires on Forbes Magazine’slist who became wealthy by
founding new firms. We identify 996 such billionaire entre-
preneurs in over 50 countries. The rate of billionaire entre-
preneurs correlates negatively with self-employment, small
business ownership, and startup rates. Countries with higher
income, higher trust, lower taxes, more venture capital in-
vestment, and lower regulatory burdens have higher entre-
preneurship rates but less self-employment.
Author contributions: M.H. and T.S. designed research, performed research, contributed
new reagents/analytic tools, analyzed data, and wrote the paper.
The authors declare no conflict of interest.
*This Direct Submission article had a prearranged editor.
Freely available online through the PNAS open access option.
1
To whom correspondence should be addressed. E-mail: magnus.henrekson@ifn.se.
This article contains supporting information online at www.pnas.org/lookup/suppl/doi:10.
1073/pnas.1307204111/-/DCSupplemental.
1760–1765
|
PNAS
|
February 4, 2014
|
vol. 111
|
no. 5 www.pnas.org/cgi/doi/10.1073/pnas.1307204111

measure of high-impact entrepreneurship is based on the accu-
mulation of wealth for founders of new business ventures. We
compare this measure to quantity-based empirical proxies for en-
trepreneurship such as self-employment, small business owner-
ship, and number of startups. Henceforth in the paper for the
sake of brevity, “entrepreneurship”refers to billionaire entre-
preneurship, the focus of this paper.
For each billionaire, the source of wealth was investigated,
allowing us to identify 996 self-made billionaires who became
rich by founding new firms. Using these individuals to construct
a per capita rate of high-impact entrepreneurship, we show that
this measure is robustly and negatively correlated with self-
employment rates, small business ownership rates, and the rate
of startup activity.
Self-Made Billionaire Entrepreneurs in the United States
We begin by focusing on the US sample to convey an impression
of the Forbes billionaire entrepreneurs. Americans account for
around four in ten global billionaires. Tables 1–3 summarize
results regarding education, industry, and region. The most im–
portant source of wealth is finance, followed by manufacturing and
information technology. Billionaire entrepreneurs are highly ed–
ucated and tend to attend elite universities, indicating ex ante
talent. Although the 15 highest-ranked US colleges account for
less than 1% of US college enrollment, one third of the billionaires
graduated from these elite universities (12). Demographically,
merely 2% of American billionaire entrepreneurs are female,
whereas 11% are foreign born. Of the largest entrepreneurial firms
in the United States founded in the postwar era, one half were
founded by billionaire entrepreneurs on our list, indicating that the
billionaire measure manages to capture entrepreneurial activity.
California and Massachusetts are strongly overrepresented in
billionaire entrepreneurship. Furthermore, 12 out of 13 Massa-
chusetts-based billionaires live in the Boston metropolitan region
or have founded firms active in Boston. Fifty out of California’s
99 billionaires live in or founded firms in the Bay Area.
Results
Cross-Country Evidence on Self-Employment and Entrepreneurship.
Among Organization for Economic Cooperation and Development
(OECD) countries, Mexico, Greece, Italy, South Korea, Turkey,
and Portugal stand out as the countries with the highest rates of
self-employment. By contrast, the United States has the second
lowest self-employment rate among developed nations. The av-
erage rate of self-employment in Western Europe is twice that of
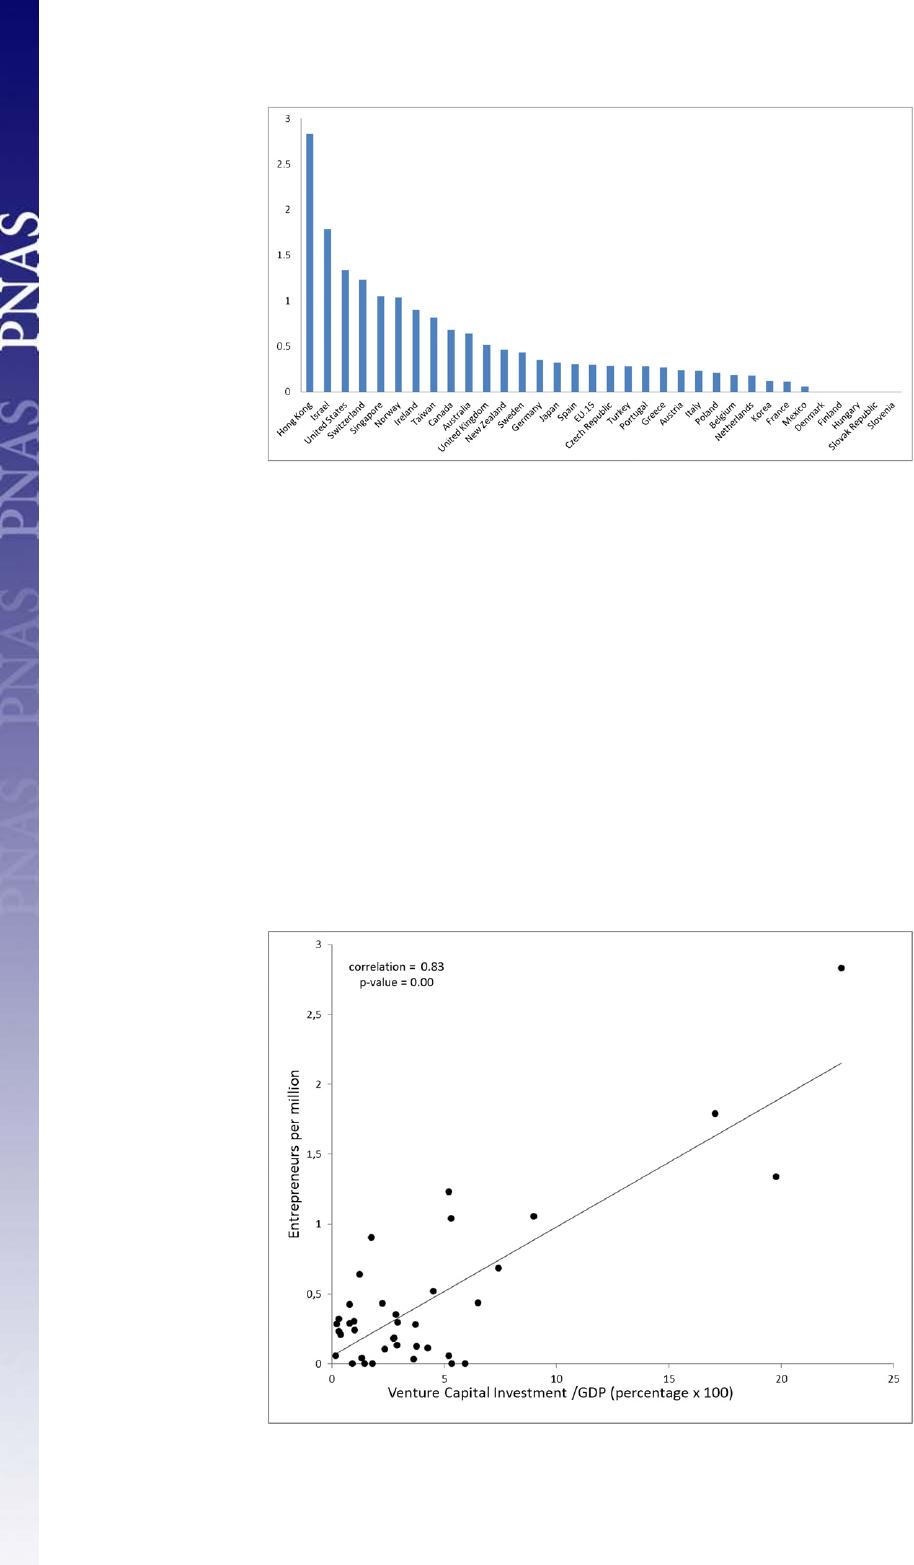
the United States. Fig. 1 instead shows the number of billionaire
entrepreneurs per million inhabitants (henceforth the rate of entre-
preneurship). Hong Kong, Israel, the United States, Switzerland,
and Singapore stand out as particularly entrepreneurial, whereas
Western Europe and Japan have a comparatively low entrepre–
neurship rate. Considering the fact that self-employment is often
used as a measure of entrepreneurship, the results in SI Appendix,
Figs. S1 and S2, which plot the national self-employment rates
against the entrepreneurship rates, are quite remarkable. Entre-
preneurship and self-employment rates are negatively related.
Entrepreneurship and small business activity relate in mark-
edly different ways to the institutional environment. Countries
with better institutions and more business friendly policies have
fewer low-quality firms and more high-quality entrepreneurs.
Self-employment is also strongly negatively linked to per capita
income levels among the OECD countries (SI Appendix, Fig. S3).
The patterns observed for wealthy countries also hold for the
full sample of nations: entrepreneurship is positively related to
per capita income levels (SI Appendix, Fig. S4), whereas self-
employment is negatively linked to per capita income levels (SI
Appendix, Figs. S5 and S6).
One alternative when attempting to capture truly entrepre-
neurial activity, used increasingly by researchers, is to focus on
venture capital (VC)-backed firms. Fig. 2 shows the correlation
between VC investment as a share of gross domestic product
(GDP) and the per capita number of billionaire entrepreneurs,
which correlate positively. By contrast, there is a statistically sig-
nificant negative correlation between self-employment rates
and VC investment as a share of GDP (SI Appendix,Fig.S7).
Table 1. Characteristics of American billionaire entrepreneurs: Educational attainment
Educational attainment
(%)
Billionaire
entrepreneurs
Self-
employed
Salaried
workers
High school or less 6.1 31.6 36.8
Some college 10.4 17.6 17.1
College degree 38.5 34.3 33.6
Advanced degree 45.0 16.5 12.5
Educational attainment refers to population aged 25+.
Table 2. Characteristics of American billionaire entrepreneurs:
Source of wealth by industry
Source of wealth by industry Share (%)
Finance 23.1
Manufacturing 18.5
(of which IT) 6.6
Information 17.0
(of which IT) 9.2
Real estate 10.5
Mining, oil, and gas 6.1
Art and entertainment 3.6
Accommodation and food services 3.2
Transportation 2.9
Health care 1.9
Professional and technical services 1.9
Construction 1.2
Wholesale trade 1.2
Forestry and agriculture 1.0
Table 3. Characteristics of American billionaire entrepreneurs:
Geographic region
Geographic region No.
Relative to
population
Northeast 109 1.44
(of which New York) 76 2.85
(of which Massachusetts) 13 1.45
Midwest 56 0.61
South 104 0.71
(of which Texas) 36 1.17
West 137 1.48
(of which California) 99 2.02
Entrepreneurs are assigned to states based on Forbes’designation. If
Forbes did not specify a state, this is based on residence. Relative to popu-
lation is defined as the share of total entrepreneurs divided by the popula-
tion share of state/region in 1996–2009.
Henrekson and Sanandaji PNAS
|
February 4, 2014
|
vol. 111
|
no. 5
|
1761
ECONOMIC
SCIENCES
When the level of trust in a society is low, it becomes more
important to monitor employees closely or rely on your own or
kin labor, which encourages self-employment. When hired em-
ployees cannot be trusted, entrepreneurs will have a difficult time
growing their firms rapidly around innovative ideas. In countries
where trust is low, self-employment is high, whereas entrepre-
neurship is low, and vice versa (SI Appendix,Figs.S8andS9).
Similarly, Sanandaji and Leeson (13) find that property rights
protection and English legal origin are associated with many bil-
lionaire entrepreneurs per capita but fewer small firms.
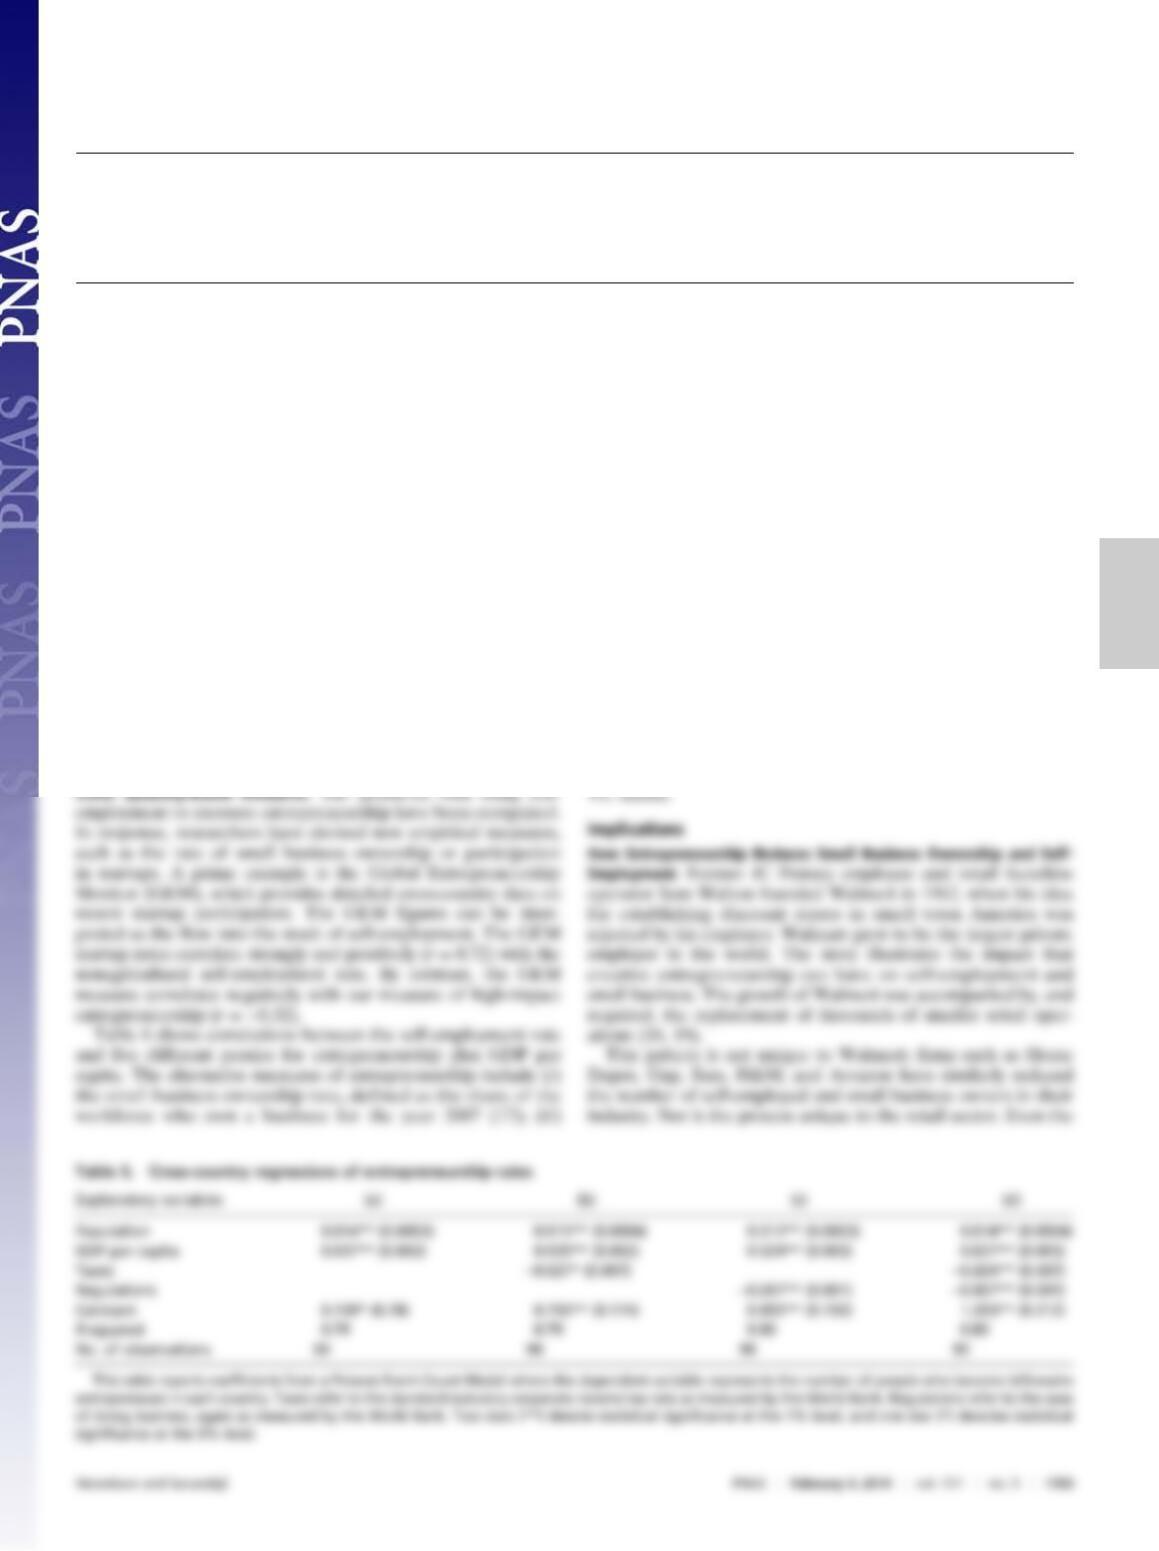
Tables 4 and 5 relate some of the correlations more systemat-
ically to self-employment and entrepreneurship rates, respectively,
in the 90 countries for which we have data for all variables of
interest. These countries represent over 80% of world GDP.
Table 4 reports the association between entrepreneurship rates,
population, per capita income, the corporate tax rate, and the
regulatory burden on firms. Higher numbers for regulation signify
a less favorable regulatory environment. In Table 5 the citizenship
of entrepreneurs is used to assign them to countries. The same
regressions are run in SI Appendix, Tables S1 and S2, but instead
the entrepreneurs are assigned based on their country of residence
and birth, respectively, producing similar results.
SI Appendix, Table S3 relates VC investment as a share of
GDP to per capita income, tax rates, and regulations on business.
As for our main measure of entrepreneurship, VC investments
are positively and statistically significantly related to per capita
income. VC investments are also negatively associated with tax
rates and the regulatory burden. However, the associations are
not statistically significant.
One concern is that the number of billionaire entrepreneurs
merely reflects affluence. One way to avoid this issue is instead to
measure the fraction of billionaires in each country who are
entrepreneurs. The share of entrepreneurs among total billion-
aires in each country correlates in a statistically significant way
with the self-employment rate (−0.24).
Fig. 1. Entrepreneurship rate: Number of billionaire entrepreneurs per million inhabitants, 1996–2010.
Fig. 2. Entrepreneurship and venture capital investment as a share of GDP (38 countries).
1762
|
www.pnas.org/cgi/doi/10.1073/pnas.1307204111 Henrekson and Sanandaji
Entrepreneurship rates correlate positively with triadic patents
per capita (+0.31), whereas self-employment correlates nega-
tively (−0.35). Entrepreneurship rates correlate positively with
the Global Innovation Index estimated by Cornell/INSEAD/
World Intellectual Property Organization (+0.59), whereas self-
employment correlates negatively (−0.65). All correlations are
statistically significant.
Silicon Valley and Boston are often identified as having above
average rates of entrepreneurial activity (14). It is therefore in-
teresting to investigate how common metrics of entrepreneurship
perform in identifying entrepreneurial activity in these areas.
Compared with the national average these regions had a lower
self-employment rate, lower firm density, a lower share of em-
ployment in firms with less than 20 employees, and a higher
share of employment in firms with more than 500 employees (15,
16). In the United States, industries that produce more entre-
preneur billionaires tend to have a lower share of employees
working in firms with less than 20 employees, with a statistically
significant correlation (−0.51).
employment in firms with less than 10 employees as a share of
total employment in 2007 (17); (iii) the widely used GEM Total
Entrepreneurial Activity (TEA) measure for the years 2001–2010;
(iv) the rate of billionaire entrepreneurship per capita; and (v)VC
investment as a share of GDP.
Table 6 shows that the measures can be grouped into two
categories. The rate of billionaire entrepreneurship per capita, VC
investment as a share of GDP, and per capita GDP are negatively
related to self-employment. The second category consists of
three conceptually related measures: the business ownership
rate, the small firm employment share, and the GEM measure of
startup activity. They all correlate positively with self-employ-
ment. Thus, the problem of self-employment being a poor proxy
for high-impact Schumpeterian entrepreneurship is not solved by
using empirical metrics conceptually close to the self-employ-
ment rate such as startup rates or the small business ownership
rate. Focusing on VC investments is a useful way to isolate
Schumpeterian entrepreneurship. However, VC investments are
sensitive to how advanced financial markets are; many OECD
countries and most developing countries still lack a mature
Table 4. Cross-country regressions of self-employment rates
Explanatory variables (a) (b) (c) (d)
GDP per capita −0.645** (0.085) −0.654** (0.083) −0.415** (0.105) −0.445** (0.105)
Taxes 0.373* (0.161) 0.286** (0.156)
Regulations 0.119* (0.035) 0.107* (0.035)
Constant 36.49** (2.08) 26.93** (4.58) 24.11** (4.16) 18.03** (5.28)
R-squared 0.40 0.43 0.47 0.49
No. of observations 90 90 90 90
This table reports standard cross-sectional regressions where the dependent variable is the self-employment rate. Taxes refer to the corporate income tax
rate as measured by the World Bank. Regulations refer to the ease of doing business, again as measured by the World Bank. Two stars (**) denote statistical
significance at the 1% level, one star (*) denotes statistical significance at the 5% level.
ECONOMIC
SCIENCES