Express Entry
Year-End Report
2016

2
Table of Contents
Express Entry Year-End Report 2016 ………………………………………………………………………………………….. 4
Express Entry Overview ………………………………………………………………………………………………………… 4
Express Entry Results to Date ……………………………………………………….……………………………………….. 5
Express Entry Profiles Submitted to the Express Entry Pool ……………………………………………………….. 5
Table 1: Cumulative Profiles Submitted to the Express Entry Pool …………………………………… 6
Composition of the Express Entry Pool ……………………………………………………………………………………. 6
Table 2: Comprehensive Ranking System Score Distribution of Candidates in the Express
Entry Pool as of January 3, 2017* ………………………………………………………………………………… 7
Results of Express Entry Invitation Rounds to Apply for Permanent Residence ……………………………. 8
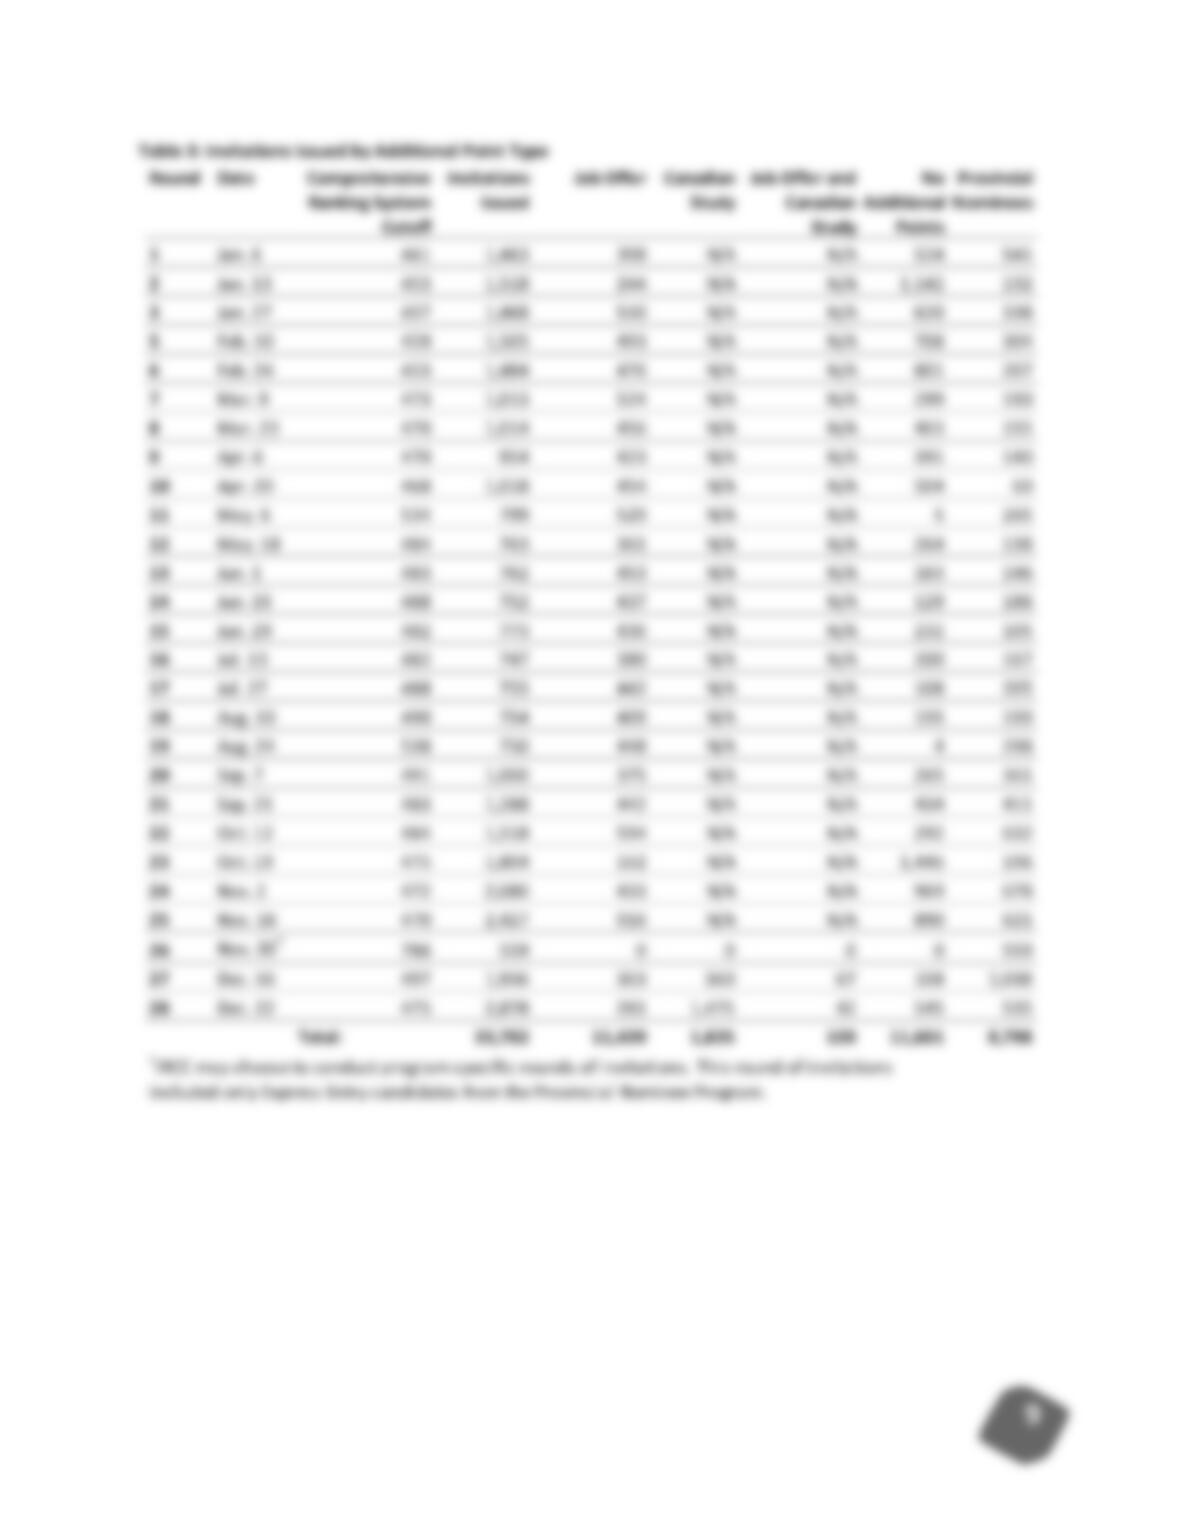
Table 3: Invitations Issued by Additional Point Type ………………………………………………………. 9
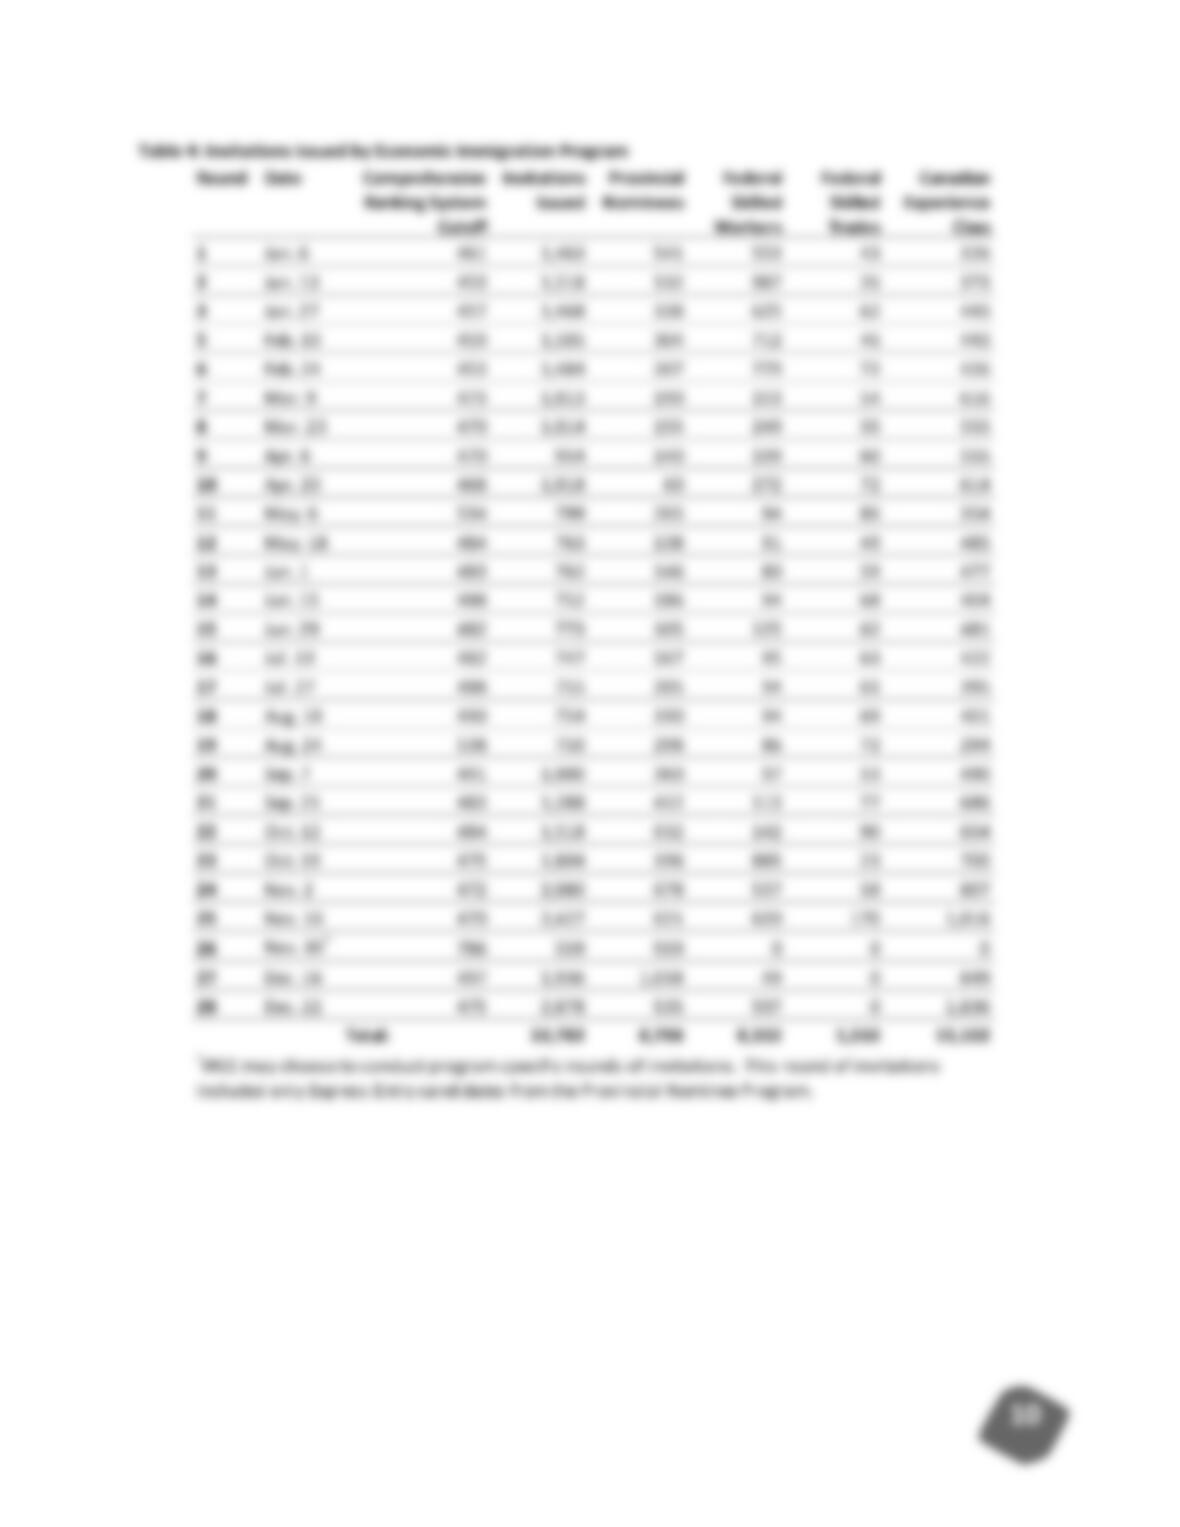
Table 4: Invitations Issued by Economic Immigration Program………………………………………. 10
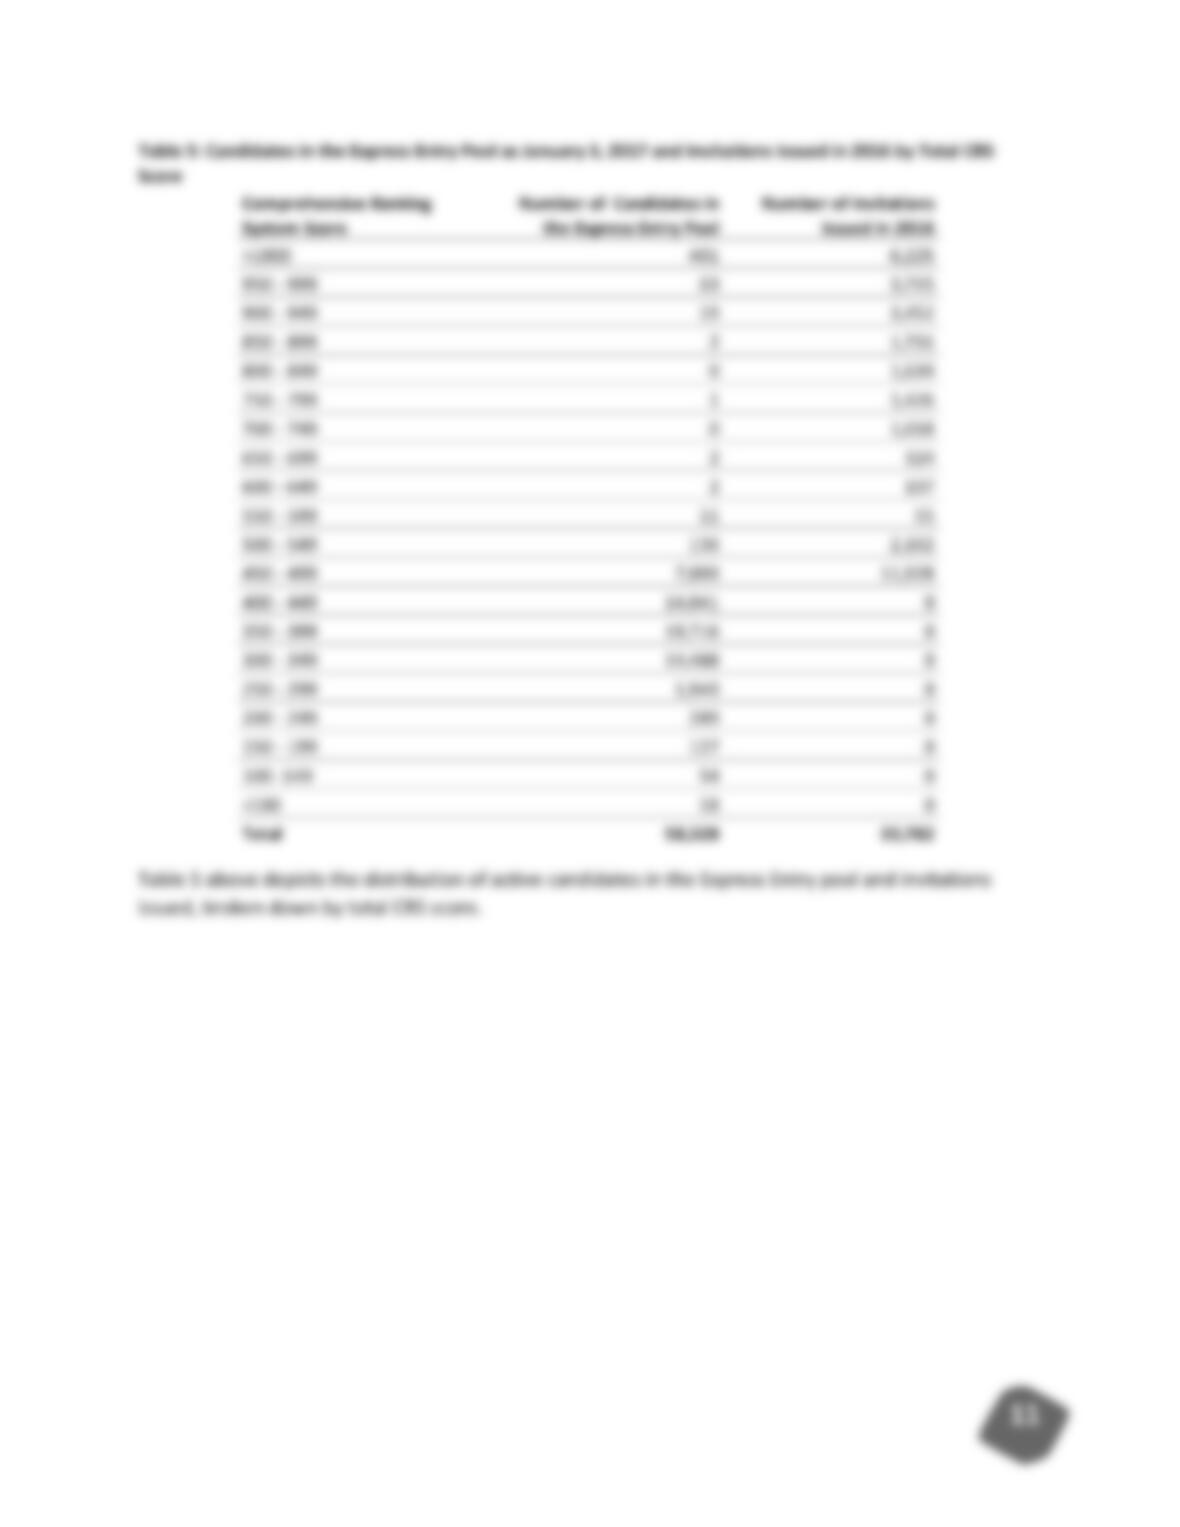
Table 5: Candidates in the Express Entry Pool as January 3, 2017 and Invitations Issued in
2016 by Total CRS Score ……………………………………………………………………………………………. 11
Chart 1: Candidates in the Express Entry Pool as of January 3, 2017 and Invitations Issued in
2016 by “core” CRS score ………………………………………………………………………………………….. 12
Round Results: Occupations of Invited Candidates …………………………………………………………………. 12
Table 6: Invited Candidates by Occupation …………………………………………………………………. 13
Round Results: Country of Residence and of Origin of Invited Candidates …………………………………. 14
Table 7: Invited Candidates by Country of Residence …………………………………………………… 14
Table 8.1: Invited Candidates by Country of Citizenship ……………………………………………….. 14
Table 8.2: FSW, CEC and FST Program Intake in 2014 by Country of Citizenship ………………. 15
Applications for Permanent Residence through Express Entry …………………………………………………. 15
Table 9: Aggregate Data on Applications for Permanent Residence Received Through
Express Entry Between January 1, 2015 and December 31, 2016 (Total Persons) ……………. 15
Table 10: Applications for Permanent Residence Received (Total Persons) by Province of
Destination in 2015 and 2016* ………………………………………………………………………………….. 16
Express Entry Processing Times ……………………………………………………………………………………………. 16
Table 11: Processing Time for Express Entry Based on Final Decision Date ……………………… 17
Admissions ………………………………………………………………………………………………………………………… 17
Table 12: Admissions (Total Persons) by Province of Destination and Immigration Category
in 2015 and 2016 under Express Entry* ……………………………………………………………………… 18
Table 13: Admissions (Total Persons) by Country of Citizenship in 2015 and 2016 under
Express Entry …………………………………………………………………………………………………………… 19

3
Table 14: Admissions (Total Persons) by Applicant’s Occupation in 2015 and 2016 under
Express Entry …………………………………………………………………………………………………………… 19
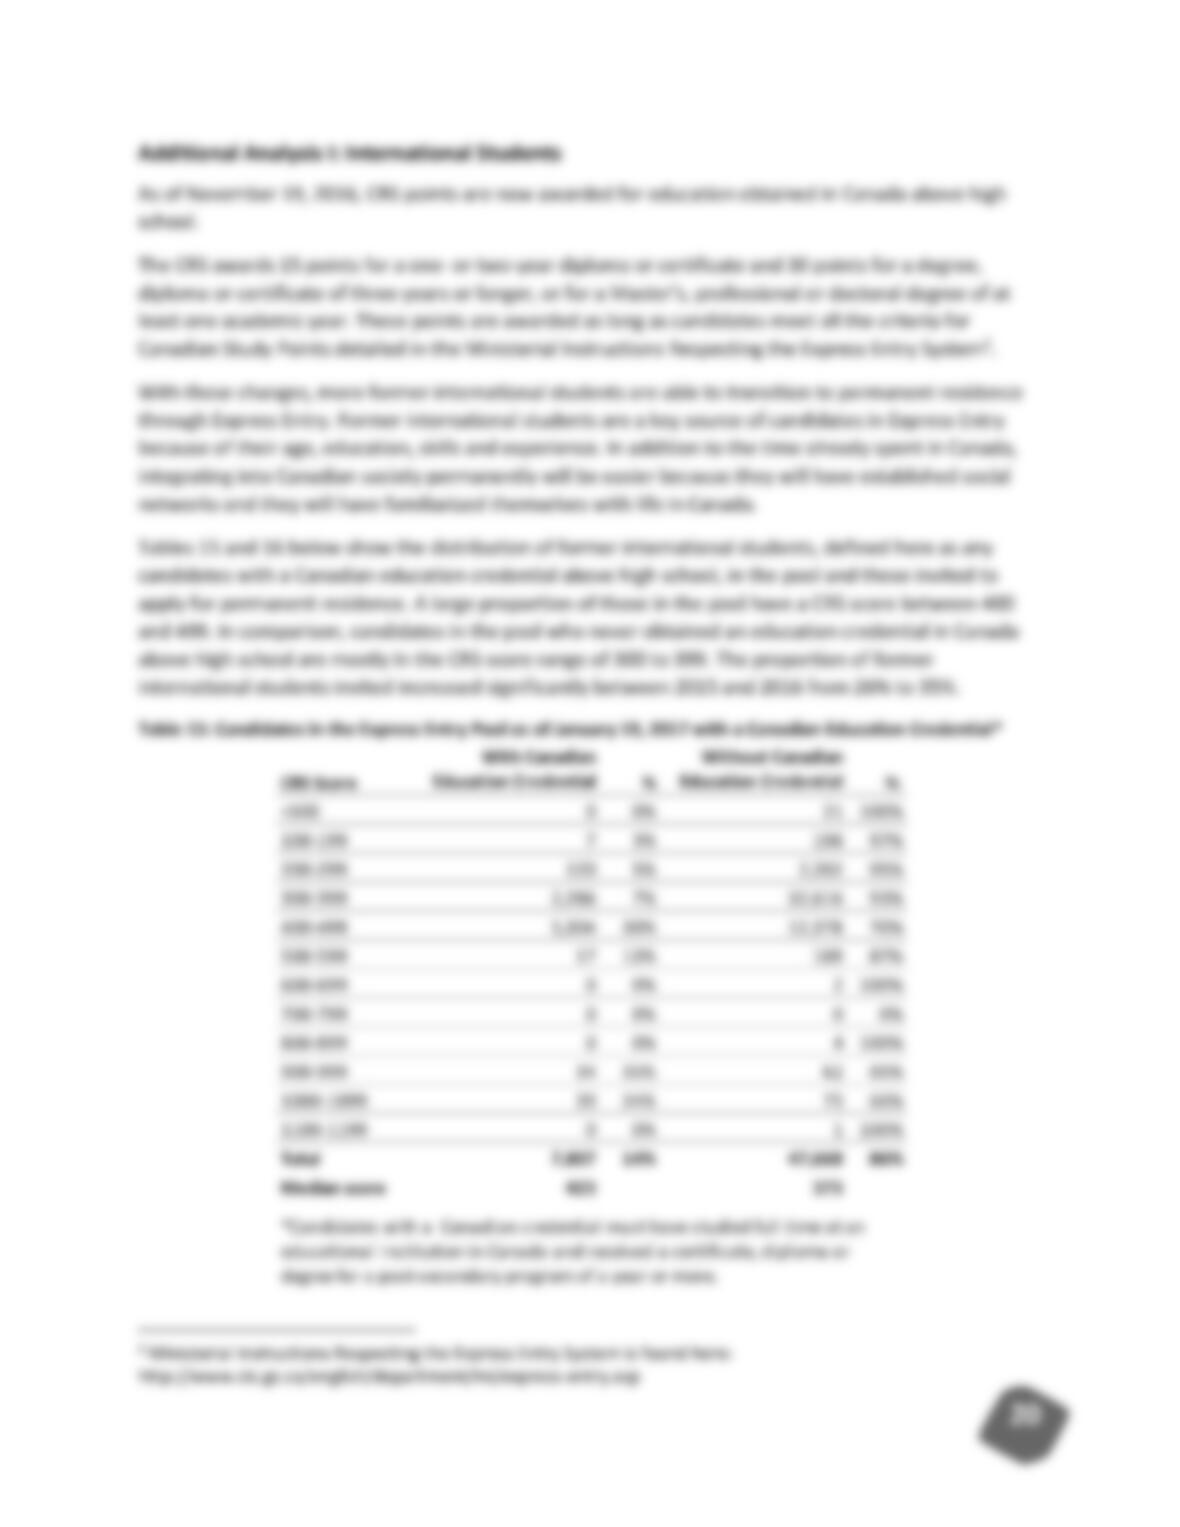
Additional Analysis I: International Students ………………………………………………………………………….. 20
Table 15: Candidates in the Express Entry Pool as of January 19, 2017 with a Canadian
Education Credential* ………………………………………………………………………………………………. 20
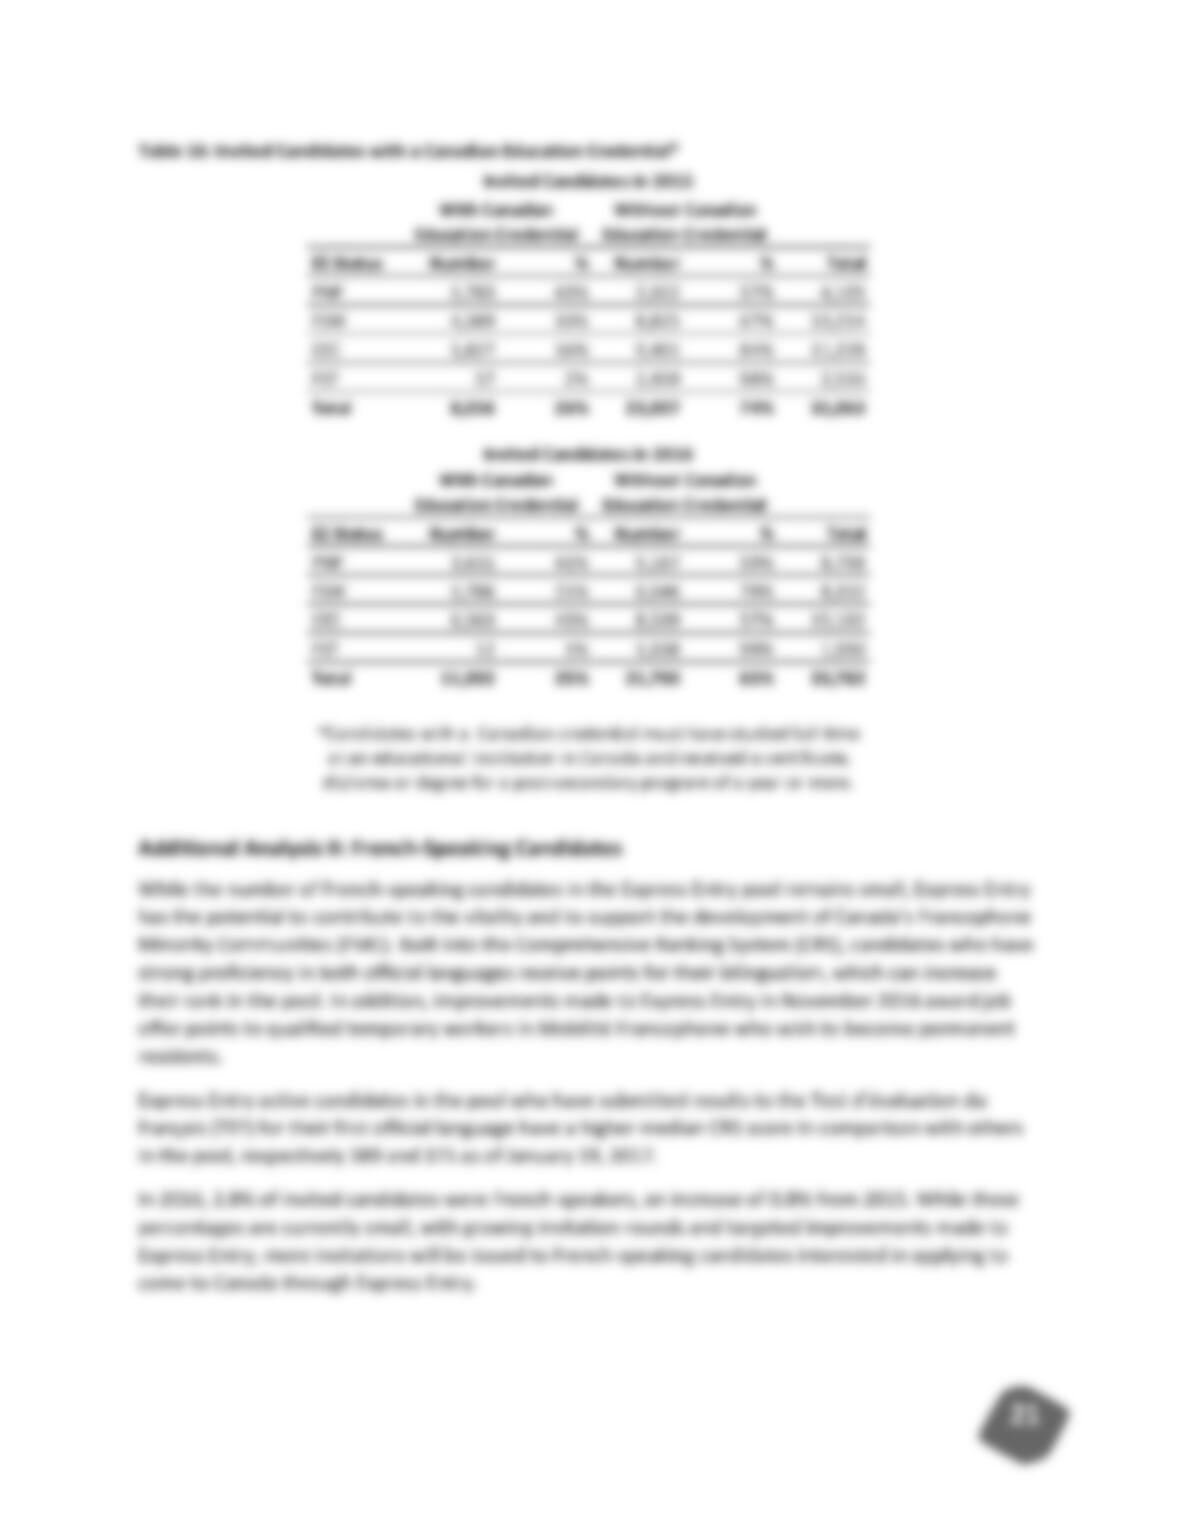
Table 16: Invited Candidates with a Canadian Education Credential* …………………………..… 21
Additional Analysis II: French-Speaking Candidates ………………………………………………………………… 21
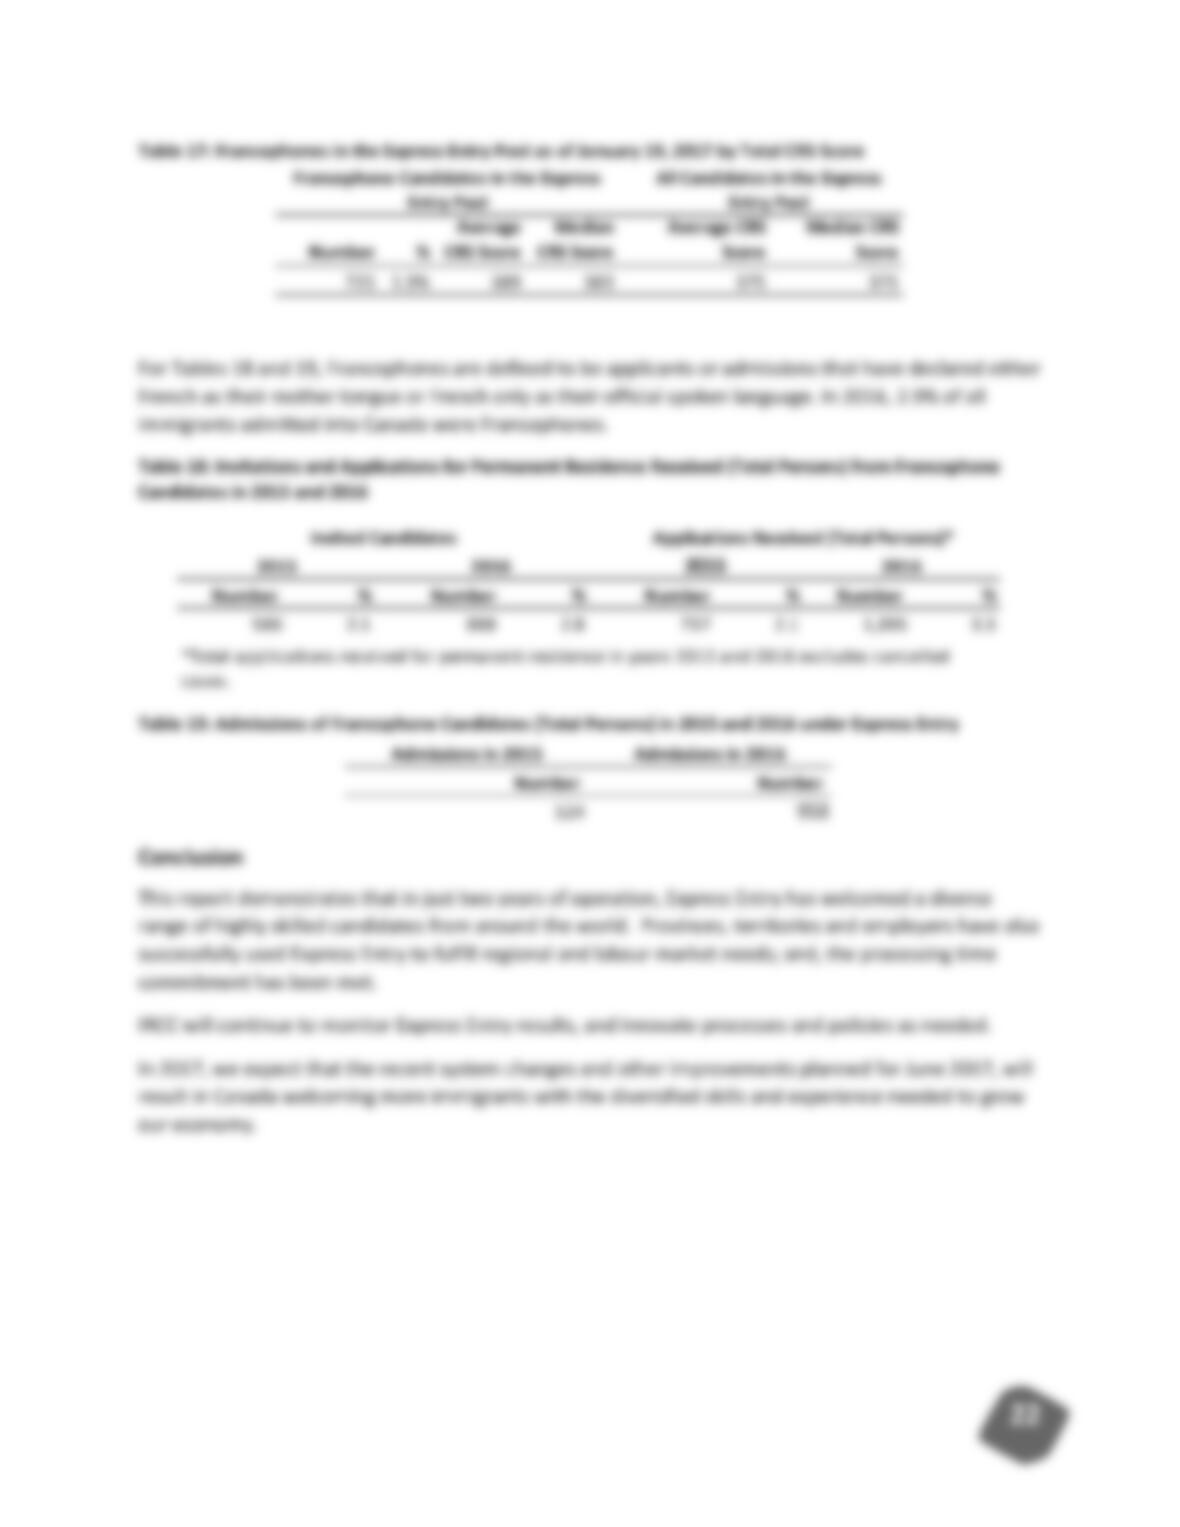
Table 17: Francophones in the Express Entry Pool as of January 19, 2017 by Total CRS Score
………………………………………………………………………………………………………………………………. 22
Table 18: Invitations and Applications for Permanent Residence Received (Total Persons)
from Francophone Candidates in 2015 and 2016 …………………………………………………………. 22
Table 19: Admissions of Francophone Candidates (Total Persons) in 2015 and 2016 under
Express Entry …………………………………………………………………………………………………………… 22
Conclusion …………………………………………………………………………………………………………………………. 22

4
Express Entry Year-End Report 2016
Express Entry Overview
Express Entry is Canada’s application management system for certain economic programs including the
Federal Skilled Worker Program, Federal Skilled Trades Program, Canadian Experience Class and a
portion of the Provincial Nominee Program. Potential candidates express their interest in immigrating to
Canada by first completing a profile online that is then pre-assessed to see if they meet criteria of one of
the three federal immigration programs mentioned above. Candidates who meet these criteria are given
a score by the system based on the information in their profile and ranked against others who also meet
these same criteria. Only the candidates with top scores get an invitation to apply for permanent
residence.
Express Entry was designed with three main objectives in mind: 1) flexibility in selection and application
management, 2) responsiveness to labour market and regional needs and 3) speed in application
processing. In its two years of operation, Express Entry has met its objectives.
In 2016, almost 34,000 invitations to apply for permanent residence were issued to Express Entry
candidates representing an increase of 3,000 from 2015. Since the launch of Express Entry, a total of
43,202 individuals (applicants and their families) have been admitted to Canada as permanent residents.
Key findings indicate that these applicants are highly skilled immigrants and many have studied in fields
related to science, technology, engineering, and mathematics. The top ten occupations of these
permanent residents included software and computer engineering fields.
Provinces, territories and employers have successfully used Express Entry to fill regional and labour
market needs. Express Entry increases the labour market responsiveness of the immigration system by
providing employers with a greater role through job offers to candidates which, if all conditions are met,
increases their chances of receiving an invitation to apply.
In addition, the processing time commitment of six months for 80% of cases has been met and
Immigration, Refugees and Citizenship Canada (IRCC) will continue to monitor the performance of
Express Entry and make adjustments as necessary.
To ensure a more fair and responsive immigration system that addresses emerging needs and long-term
economic growth for Canada, targeted improvements were made to Express Entry on November 19,
2016. These improvements include the following:
Reducing the number of points awarded for job offers to 50 points to candidates with a valid
job offer in a National Occupational Classification (NOC) 0, A or B occupation and 200 points to
candidates with a valid job offer in a NOC 00 occupation; this change rebalances the
Comprehensive Ranking System and allows for more highly skilled candidates to receive an
invitation to apply;
Awarding points for job offer to certain candidates already in Canada on Labour Market Impact
Assessment (LMIA) exempt work permits. For example, candidates who are here under the
North American Free Trade Agreement, a federal provincial agreement or Mobilité
Francophone no longer need to obtain a LMIA to be awarded job offer points. These candidates

5
must meet certain criteria, such as at least one year of work experience from the same
employer who is providing their job offer;
Changing the job offer requirement from indeterminate to one year; this allows for more highly
skilled candidates working in contract-based industries to have a higher likelihood of receiving
an invitation to apply for permanent residence;
Awarding 15 points for a one- to two-year diploma or certificate and 30 points for a degree,
diploma or certificate of three years or longer, or for a Master’s, professional or doctoral degree
of at least one academic year; these changes allow for more former international students,
which are a key source of candidates because of their age, education, skills and experience, to
be able to transition to permanent residence using Express Entry;
Finally, providing 90 days, instead of the previous 60 days, to candidates to complete their
application for permanent residence after they receive an invitation to apply.
Express Entry Results to Date
In January and February 2016, IRCC held regular invitation rounds issuing about 1,500 invitations per
round. As planned, smaller invitation rounds (between 750 and 1,000) were held between March and
August 2016 to allow the department to continue processing applications received prior to the launch of
Express Entry. During these months, a larger share of foreign nationals with a job offer or a Provincial
Nomination were invited as they were awarded an additional 600 points. In doing so, a smaller share of
candidates without either a job offer or a Provincial Nomination received an invitation to apply for
permanent residence.
In September 2016, invitation round sizes began to grow reaching close to 3,000 invitations per round
by December 2016. During this time, improvements to Express Entry were also implemented. These
changes have helped to attract top talent in the world, including former international students,
experienced professionals and talented workers who will strengthen Canada’s competitiveness in the
global marketplace.
The Express Entry pool is now the main source of permanent residence applications in the economic
immigration category of the Immigration Levels Plan.
Express Entry Profiles Submitted to the Express Entry Pool
Those who meet the criteria of one of the federal immigration programs managed by the Express Entry
system (i.e. Federal Skilled Worker, Canadian Experience Class and Federal Skilled Trades Program) are
accepted into a pool of candidates. Provincial Nominees participating in Express Entry must also meet
the criteria of one of these three immigration programs.
As of January 3, 2017, a total of 353,230 Express Entry profiles were submitted by foreign nationals since
launched on January 1, 2015. Of these, 170,221 were found not eligible because they did not meet the
criteria of at least one of the three programs; 1,554 were pending pool entry due to Job Bank
registration or verification of their Provincial Nomination by a province or territory requirement; 64,938
were in the pool as active candidates or with an outstanding invitation to apply; and the remaining
116,517 profiles have exited the pool.
Exit from the Express Entry pool can occur due to a variety of factors:

6
A profile expires (47,859 profiles expired as of January 3, 2017) because it has reached the 1-
year expiry limit or a candidate does not decline an invitation to apply and does not submit an
application within the 90-day mandatory period
1
;
A profile is withdrawn from the pool by a candidate (27,192 as of January 3, 2017);
An invited candidate successfully submits an application for permanent residence (41,466
applications as of January 3, 2017);
A candidate becomes ineligible (e.g. the candidate’s language test expires).
Table 1: Cumulative Profiles Submitted to the Express Entry Pool
Composition of the Express Entry Pool
Express Entry automatically assigns a Comprehensive Ranking System (CRS) score to candidates who
submit a profile. A candidate’s CRS score is divided into two portions. The candidate’s “core” CRS score
can reach a maximum of 600 points and it is based on the candidate’s age, education, official language
proficiency, work experience, and a combination of these human capital attributes. An additional 600
points is awarded to the candidate if they meet policy or other objectives such as having a provincial
nomination, a job offer, or obtained education in Canada above high school. A candidate’s maximum
CRS score is 1,200 points. All information is self-reported and must be supported with appropriate
documentation at the application stage or the candidate will be refused.
Candidates in the pool are ranked according to their CRS score at the time of an invitation round. CRS
scores may change as a candidate’s circumstances change. For example, a candidate could complete
another post-secondary degree, gain more work experience or be nominated by a province or territory.
The Express Entry pool is dynamic and a candidate’s rank may change as other candidates join and leave
the pool.
Candidates with higher CRS scores have a higher likelihood of being invited. The CRS score distribution
of candidates in the pool as of January 3, 2017, is presented in Table 2. This distribution is made up of
candidates with a wide range of scores based on their human capital attributes and additional points.
1
Prior to November 19, 2016, the mandatory period to submit an application was 60 days.
As of January 3, 2016 As of January 3, 2017
Profiles submitted 188,262 353,230
Not eligible 88,048 170,221
Pending 1,303 1,554
Profiles in the pool
Active candidates 60,042 58,328
Invitation to apply outstanding 3,895 6,610
Profiles no longer in the pool
Expired 2,656 47,859
Profile withdrawn from the pool 13,684 27,192
Applications submitted for processing* 18,634 41,466
*Total applications submitted for permanent residence in years 2015 and 2016 excludes cancelled cases.
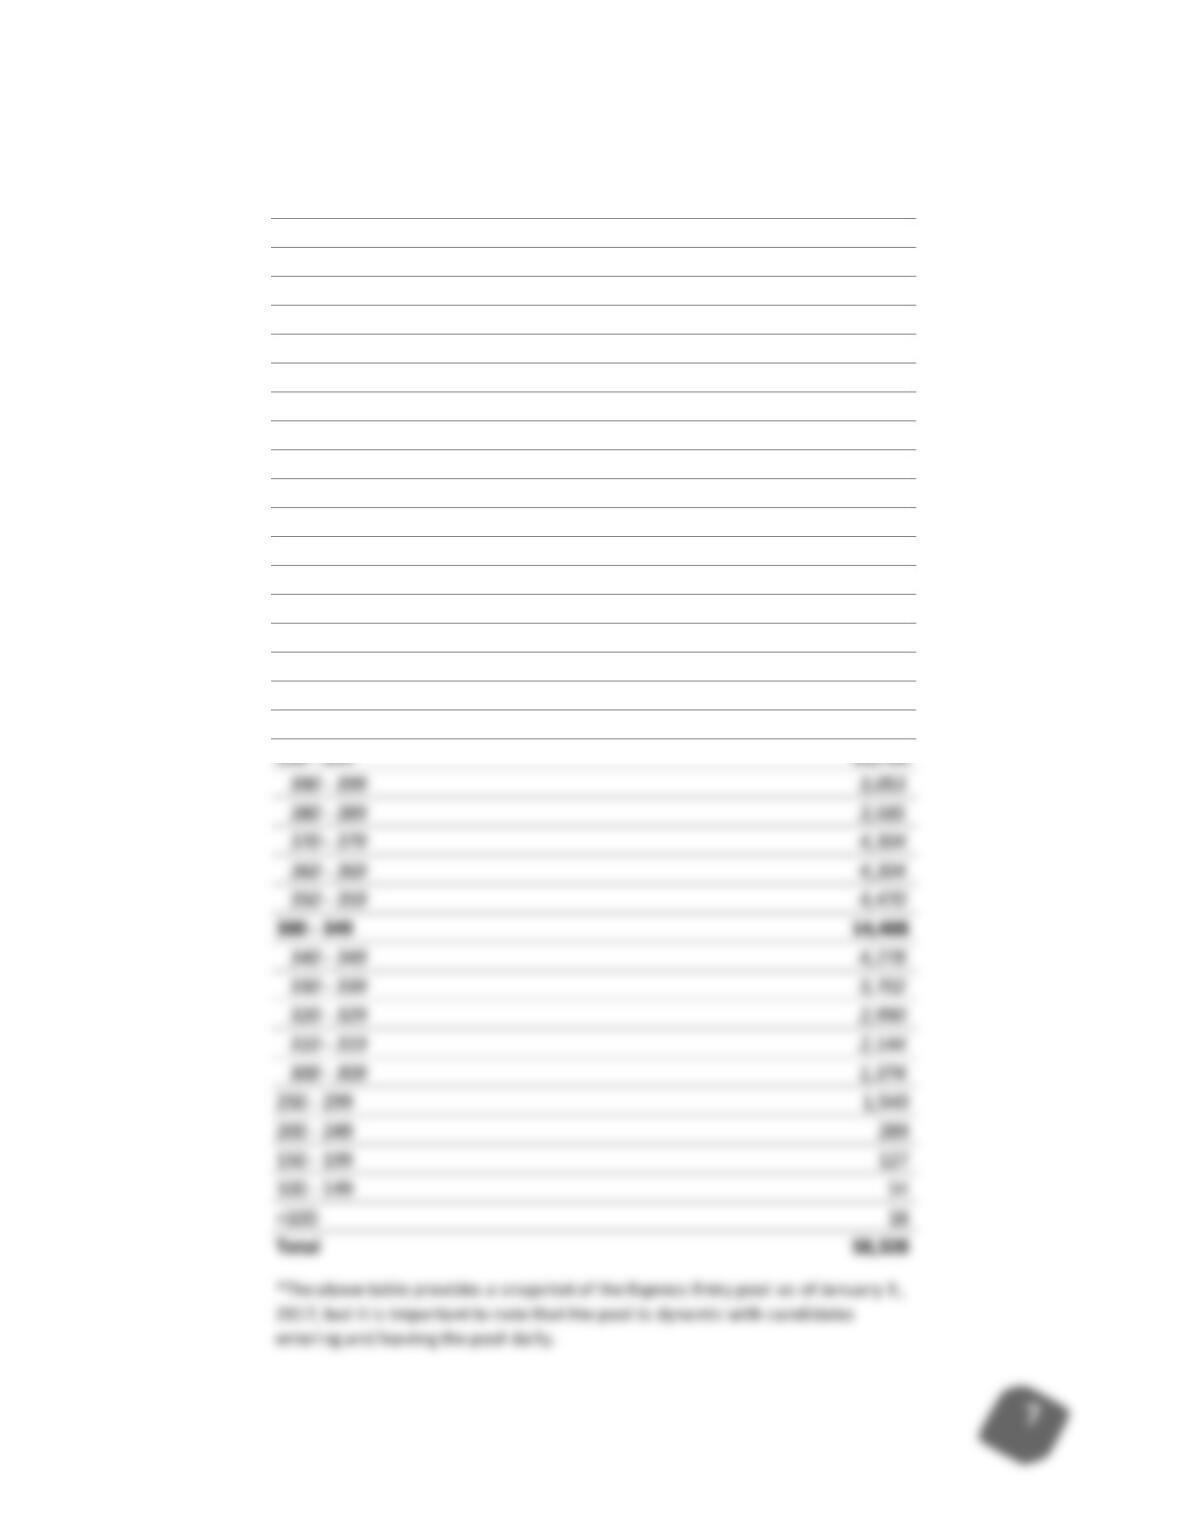
Table 2: Comprehensive Ranking System Score Distribution of Candidates in the Express Entry Pool as of January
3, 2017*
Comprehensive Ranking System Score Number of candidates
>1000 401
950 – 999 63
900 – 949 19
850 – 899 2
800 – 849 0
750 – 799 1
700 – 749 0
650 – 699 2
600 – 649 2
550 – 599 11
500 – 549 136
450 – 499 7,009
400 – 449 14,041
440 – 449 2,815
430 – 439 3,140
420 – 429 2,262
410 – 419 2,718
400 – 409 3,106