Import and Export (Singapore and Malaysia) by Ang Yi Min
Singapore is a small country located in Southeast Asia which has tiny natural
resources. She relied heavily on foreign direct investment (FDI) as well as the trade
which consists of port activities and exports of electronic components and refined oil
for development. To further illustrate, Singapore has a highly developed trade-oriented
market economy. Singapore’s economy has ranked as the most open in the world,7th
least corrupt, most pro-business, with low tax rates (14.2% of Gross Domestic Product,
GDP) and has the third highest per-capita GDP in the world regarding Purchasing
Power Parity (PPP). The Port of Singapore is one of the five busiest ports in the world.
Singapore has free trade access to the entirety of the ASEAN network. The
government has also encouraged firms to invest outside Singapore.
Furthermore, Singapore is the 14th biggest exporter worldwide, but also the
15thbiggest importer in the globe. From the World Trade Organization, Singapore has
the been the top of trade to GDP (Gross Domestic Product) ratio of 407.9% among all
countries in the world.
On the other hand, Malaysia is a rapidly developing economy in Asia. Malaysia, a
middle-income country, has change itself since the 1970s from a producer of raw
materials into an emerging multi-sector economy. The Malaysia Government has
always tried the different way to increase domestic demand to wean the economy off
of its dependence on exports.
The gross domestic product (GDP) is one of the foremost indicators used to display
the health of a country’s economy. Economic production and growth, what GDP
represents, has an enormous impact on most of the people within that economy.A
slight change in GDP, be it up or down will lead to a significant effect on the stock
market. A bad economy results in lower profits for companies, which leads to lower
stock prices. Negative GDP growth is one of the factors that investors worry about
when they are using to determine if an economy is having a recession. Appendix A
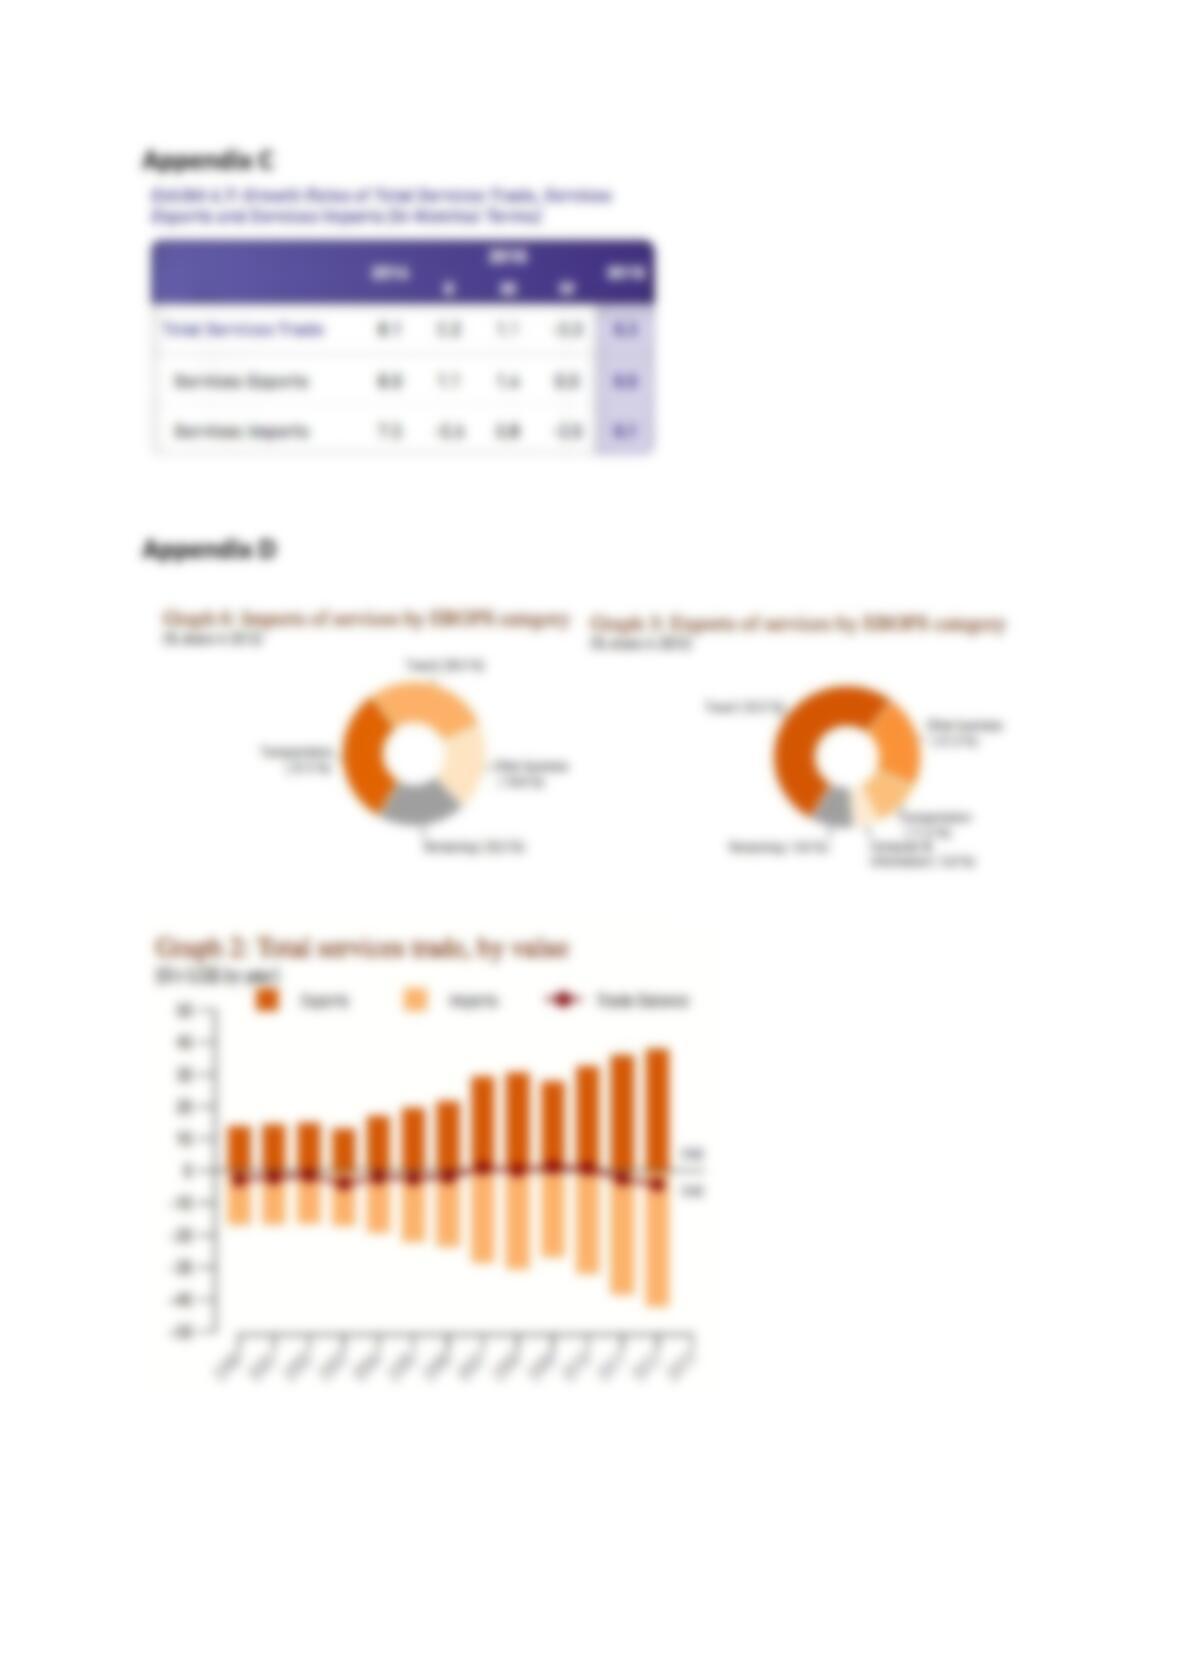
From the above graph, Singapore’s GDP growth rate has been fluctuating throughout
the years (small fluctuations from 2013 to 2016). As for Malaysia’s GDP growth rate,
there was more change during the years of 2009 to 2013, but then it stabilized from
2014 to 2016 as shown in the graph below. Appendix B
Malaysia was once the world’s largest producer of tin, rubber and palm oil. Its
manufacturing sector has a crucial role in its economic growth. The export industry
was hit hard during the late 2000 economic recession drastically dropping to 78% i.e.
FDI to RM4.2 billion in the first two-quarters of 2009. Total exports fell to $156.4 billion
in 2009 from $198.7 billion in 2008. The imports were reduced from 154.7 billion in
2008 to $119.5 billion 2009.
Within ASEAN, Singapore has always been committed to working with its ASEAN
partners to create the ASEAN Economic Community (AEC). ASEAN has also signed
FTAs with major regional economies such as Australia, China, India, Japan, Korea
and New Zealand. Beyond advancing our economic interests, this intro, and inter-
regional FTAs help build a web of strategic linkages for Singapore within the region
and with countries outside the area.
Malaysia trade in goods, FTA benefits our exporters through the preferential treatment
and market access. Exporters will also enjoy cost savings from elimination or reduction
of customs duties and mutual recognition agreements, trade facilitating customs
procedures and removal of onerous regulations.
Promote business in Singapore, for example, Lee Hsien Loong visited Myanmar
recently. It establishes a good relation FTAs Singapore pro-trade they will try to pay
the wave like Myanmar and others country. On the other hand, Malaysia promotes,
assist and develop Malaysia’s external trade with particular emphasis on the export of
manufactured and semi-manufactured products and on a selective basis, imports.
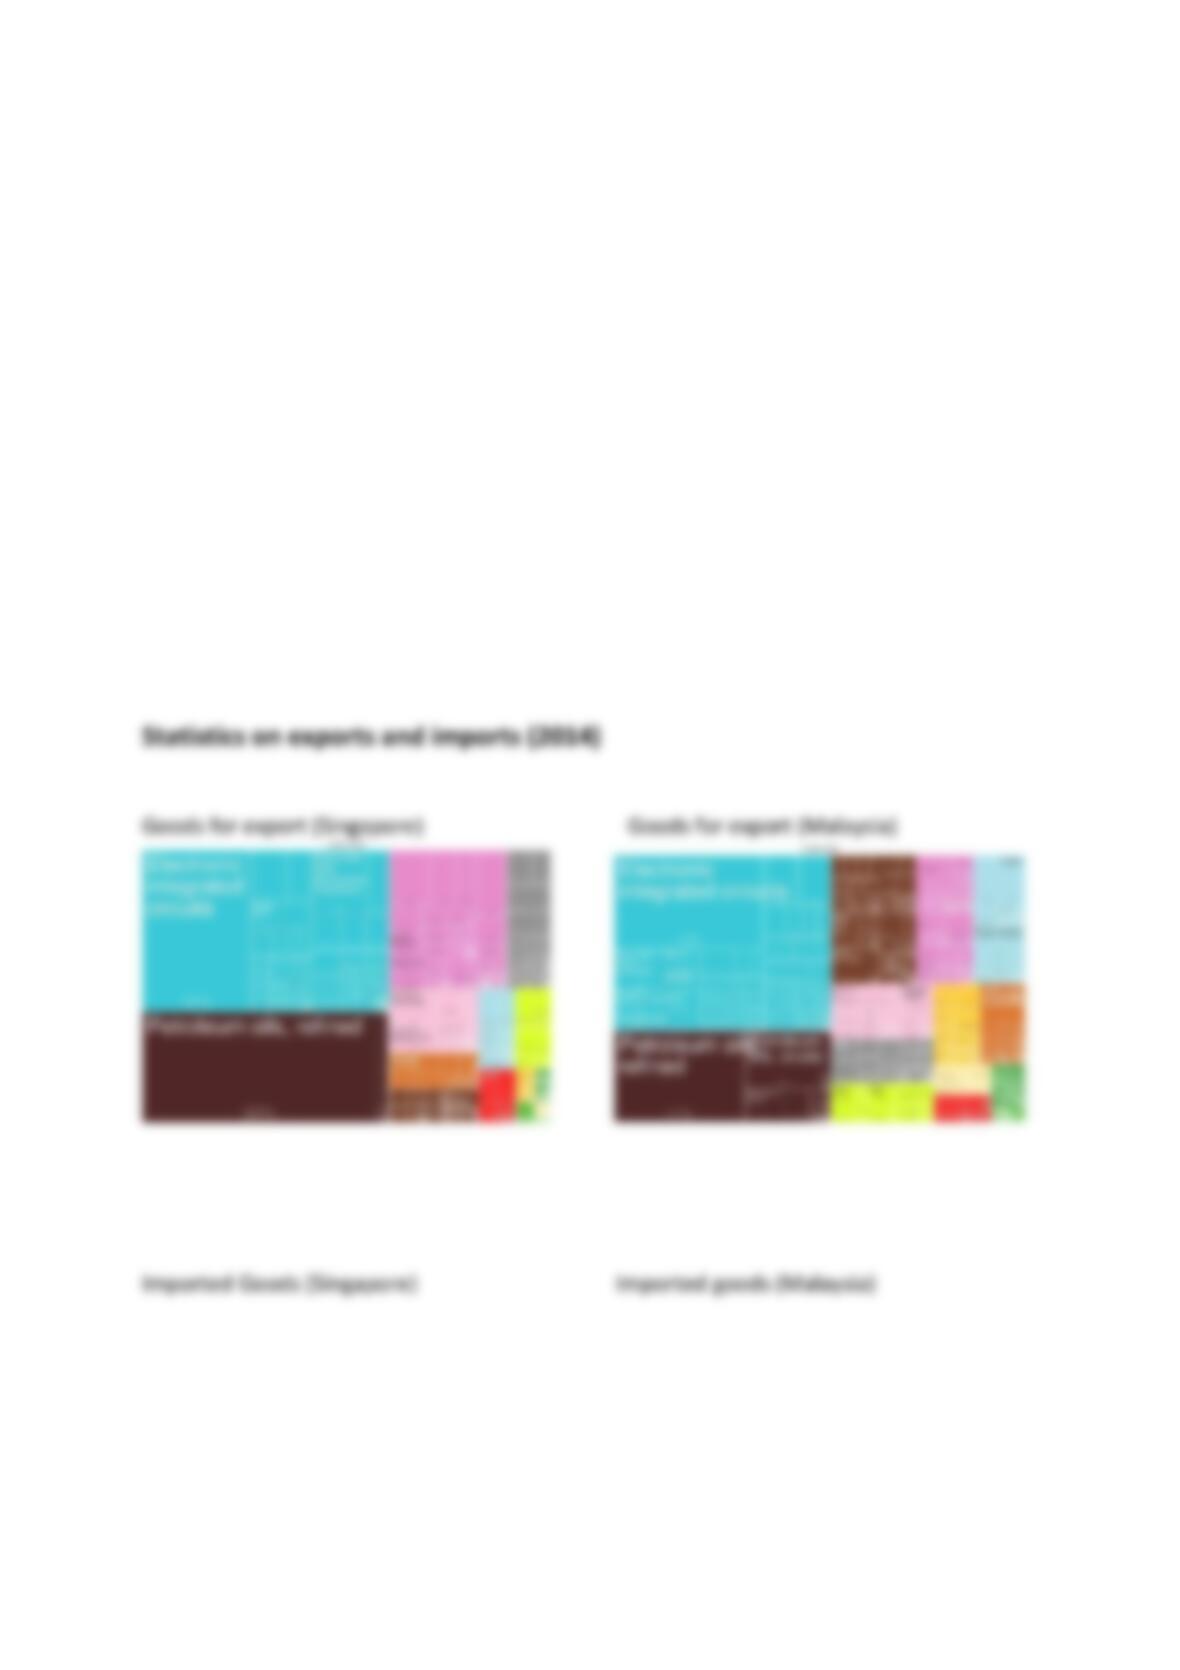
The record shows that Services exports growth in the fourth quarter, compared to the
1.4 percent increase in the preceding quarter (Exhibit 4.7). Exports of maintenance &
repair, insurance, and construction services posted strong growth of 9.0 per cent, 6.8
per cent, and 4.9 per cent respectively. On the other hand, receipts for the use of
intellectual property saw the largest decline of 6.7 per cent, extending the decline of
6.0 per cent in the preceding quarter. Services imports contracted by 0.5 per cent in
the fourth quarter, a reversal from the 0.8 per cent gain in the previous quarter of the
year.
Of all the services categories, imports of construction services have the highest
increase of 4.9 percent. Services imports for a use of intellectual property dropped by
6.7 percent in the fourth quarter. For the full year, services imports rose a little by 0.1
percent, a slowdown from the 7.5 percent increase in 2014. Among all the different
services, financial services imports recorded the highest full-year increase by 12
percent and contributed 0.3 percentage to the overall growth in imports of services in
2015. For 2015 as a whole, services exports grew by 0.5 per cent, easing from the
increase of 8.8 percent in 2014. Exports of almost all categories increase in 2015, with
financial services having the most growth of 8.0 percent. The increase in financial
services exports contributed 1.1 percentage points to the full-year growth in services
exports. Appendix C
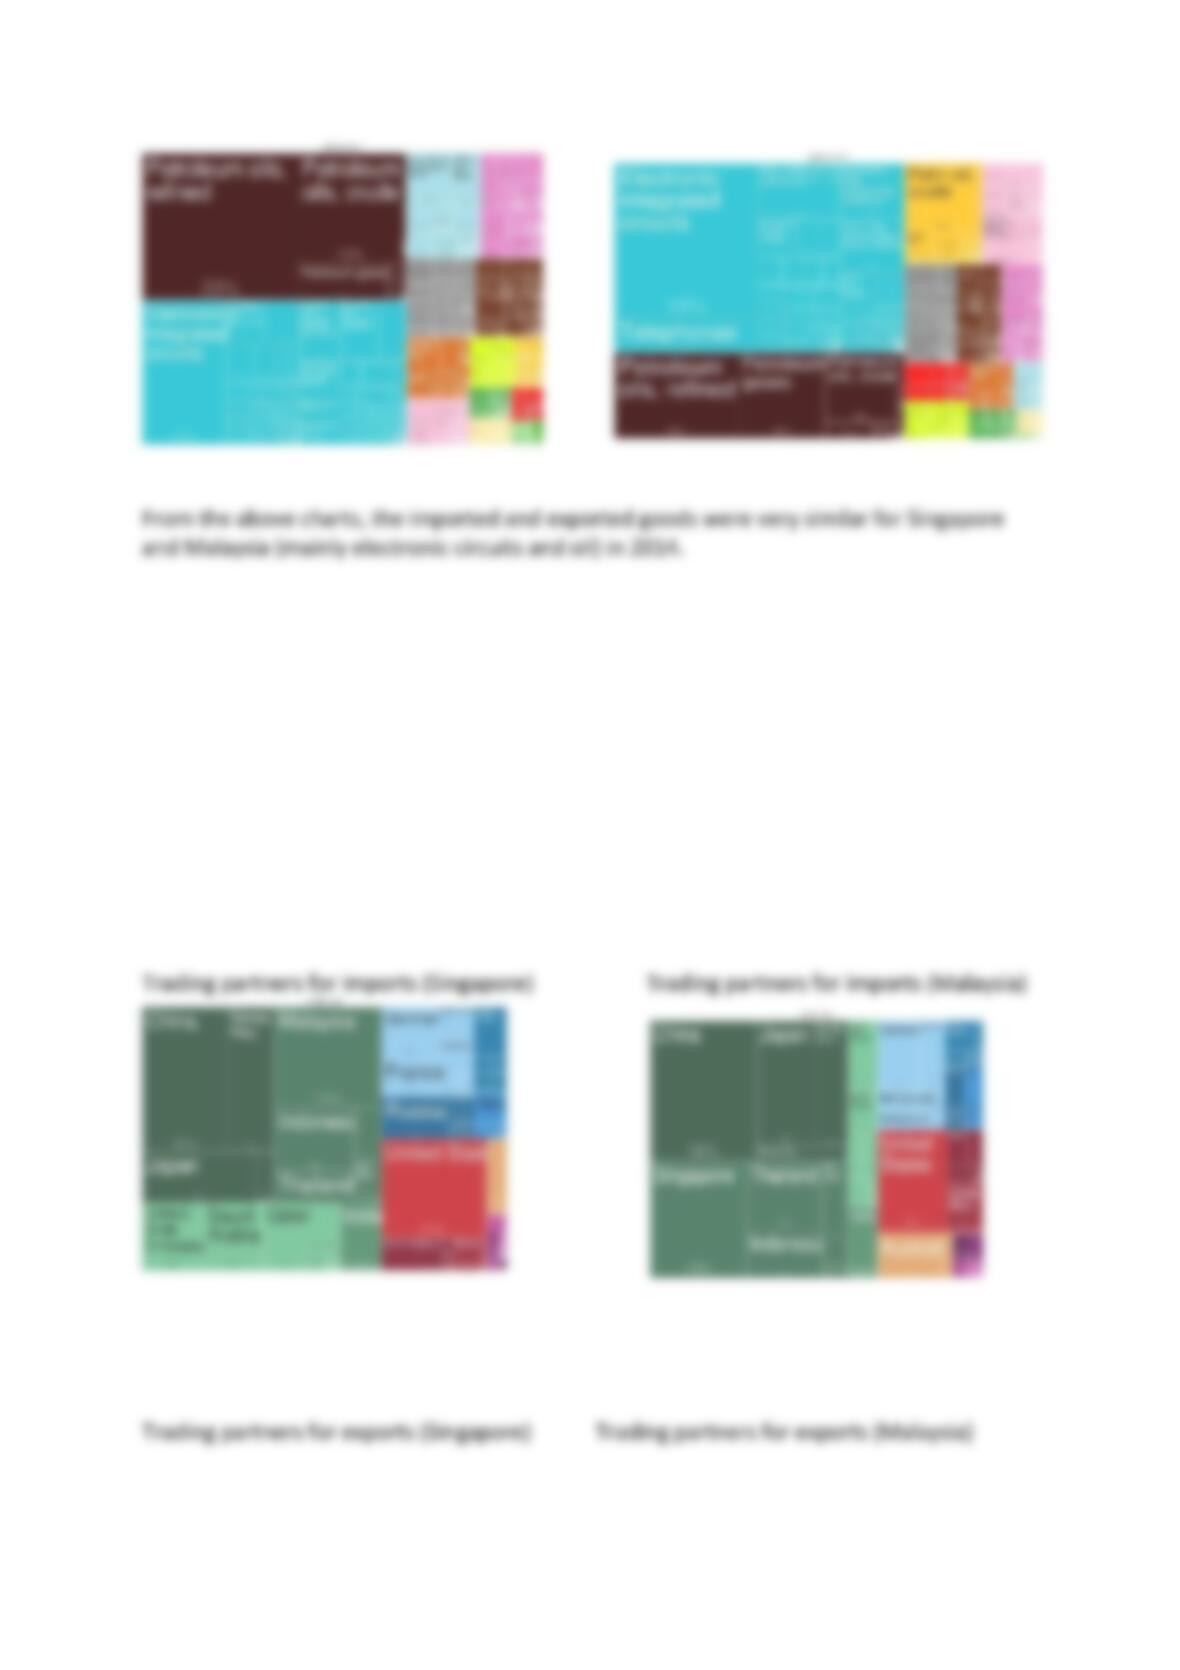
In 2012, the value of exports of Malaysia increased slightly by 5.4 percent, reaching
37.9 billion US$, while its imports of services increased modestly by 9.4 percent and
reached 42.2 billion US$ (see graph 2). There was a relatively small trade in services
deficit of 4.3 billion US$. “Transportation” (EBOPS code 205) accounted for the largest