Unlock document.
This document is partially blurred.
Unlock all pages and 1 million more documents.
Get Access
Economy of Switzerland
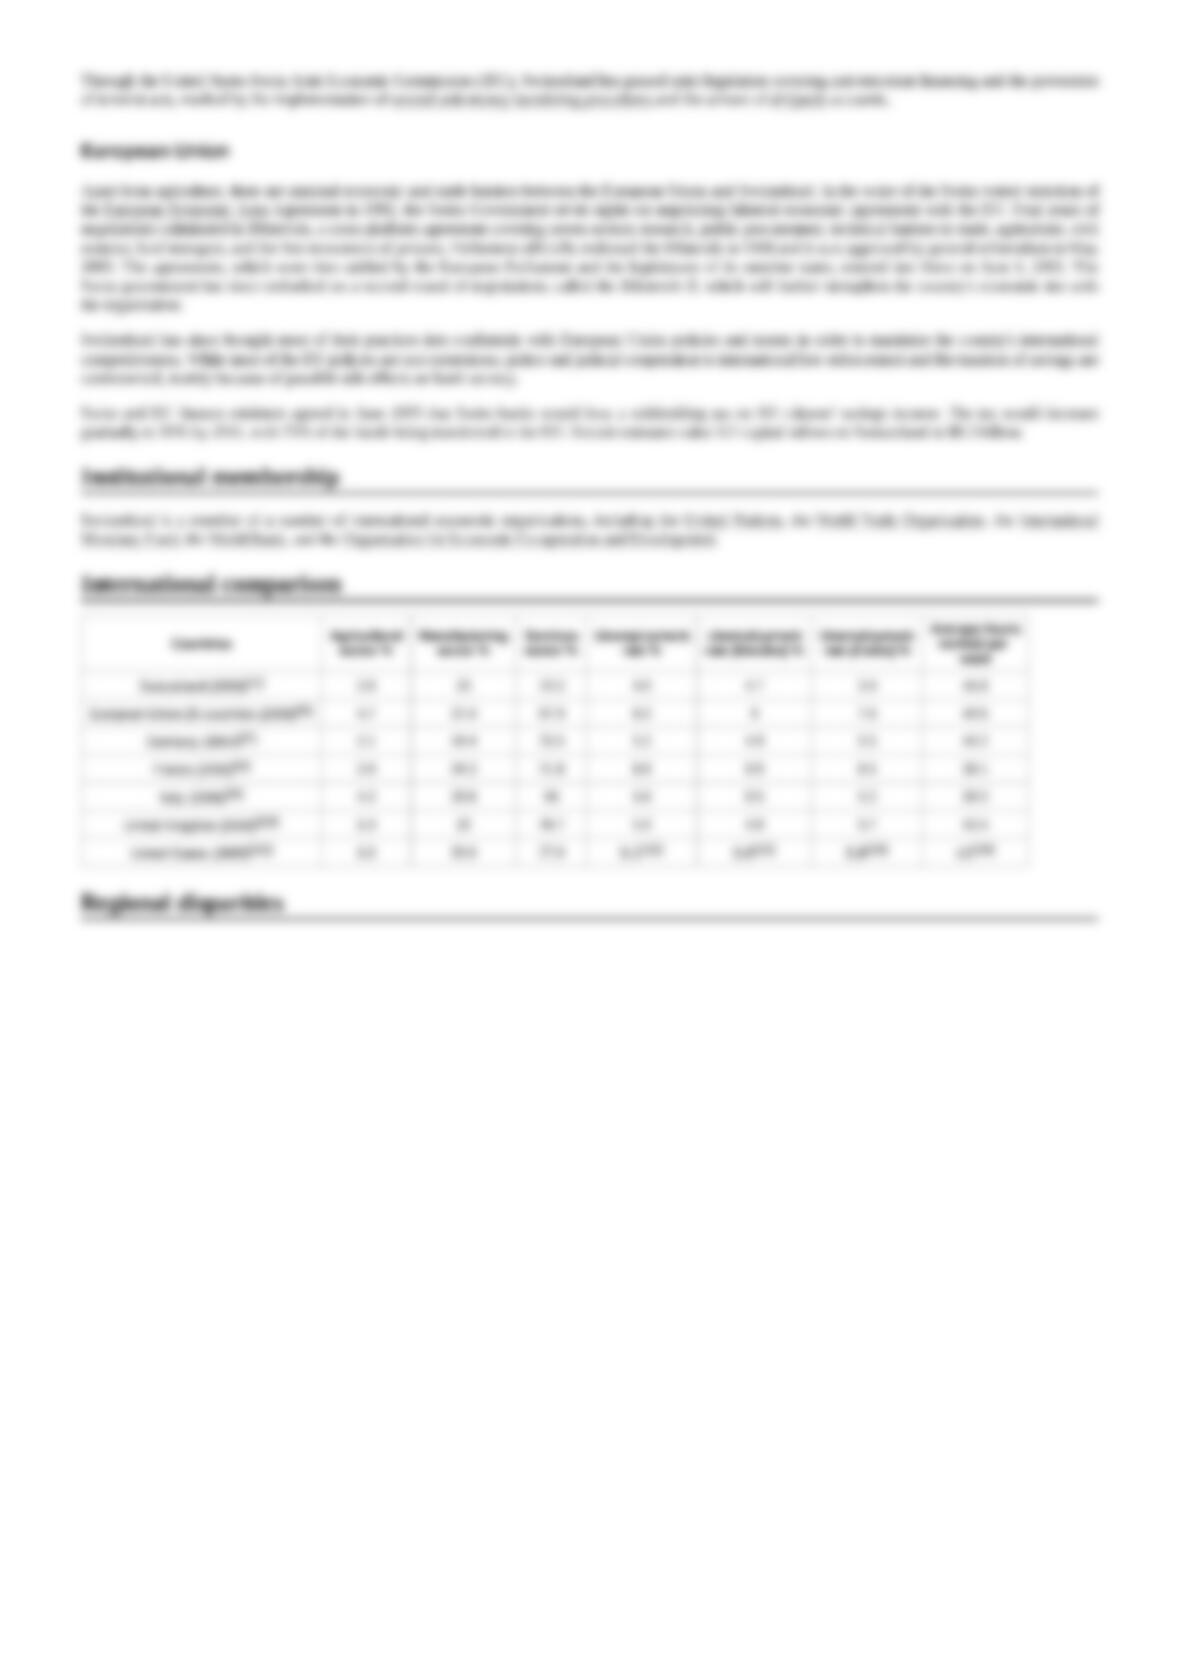
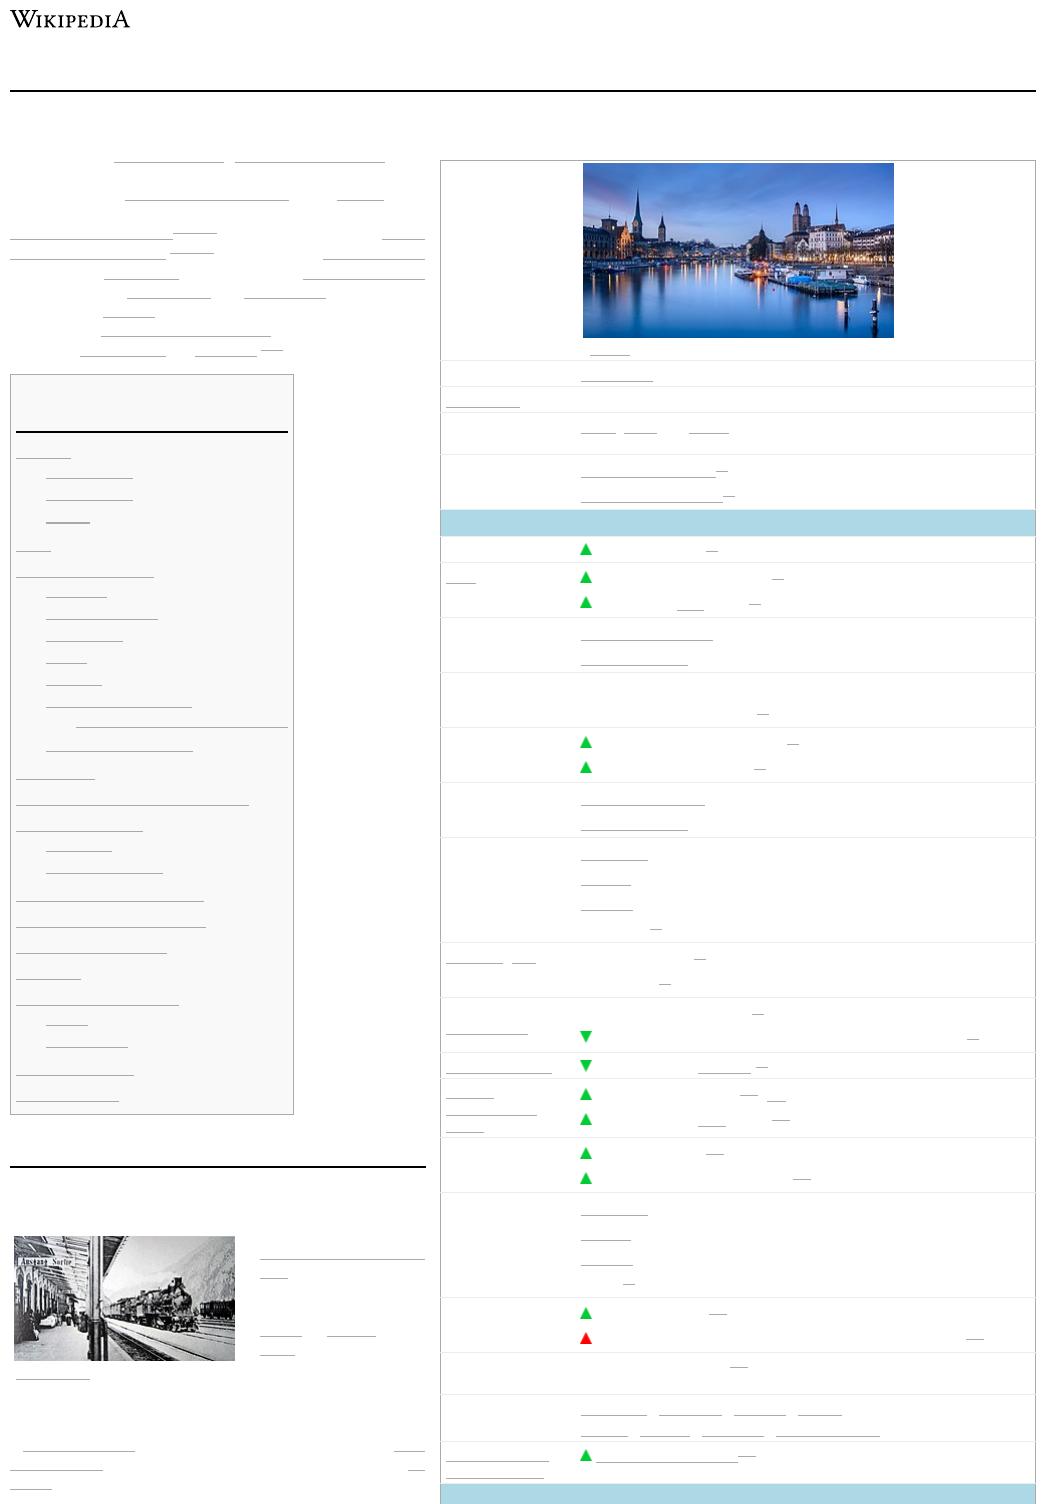
The city of Zurich, the most important economic center of the country
Currency Swiss franc (CHF)
Fiscal year Calendar year
Trade
organisations
EFTA, WTO and OECD
Country group Developed/Advanced[1]
High-income economy[2]
Statistics
Population 8,636,986 (2020)[3]
GDP $900 billion (nominal, 2022)[4]
$750 billion (PPP, 2022)[5]
GDP rank 18th (nominal, 2021)
35th (PPP, 2021)
GDP growth 2.7% (2018) 0.9% (2019)
−2.4% (2020) 3.8% (2021e)[5]
GDP per capita $100,750 (nominal, 2021 est.)[4]
$75,750 (PPP, 2021 est.)[4]
GDP per capita
rank
7th (nominal, 2021)
11th (PPP, 2021)
GDP by sector agriculture: 0.7%
industry: 25.6%
services: 73.7%
(2017 est.)[6]
Inflation (CPI) −0.4% (2020 est.)[5]
0.4% (2019)[7]
Population below
poverty line
6.6% in poverty (2014 est.)[6]
17.4% at risk of poverty or social exclusion (AROPE, 2018)[8]
Gini coefficient 29.7 low (2018, Eurostat)[9]
Human
Development
Index
0.962 very high (2021)[10] (1st)
0.894 very high IHDI (2021)[11]
Labour force 4,971,981 (2019)[12]
82.5% employment rate (2018)[13]
Labour force by
occupation
agriculture: 3.3%
industry: 19.8%
services: 76.9%
(2015)[6]
Unemployment 4.8% (June 2020)[14]
10.4% youth unemployment (15 to 24 year-olds; Q2-2020)[15]
Average gross
salary
$75,250, annual (2017)[16]
Main industries Machinery · chemicals · watches · textiles · precision instruments ·
tourism · banking · insurance · pharmaceuticals
Ease-of-doing-
business rank
36th (very easy, 2020)[17]
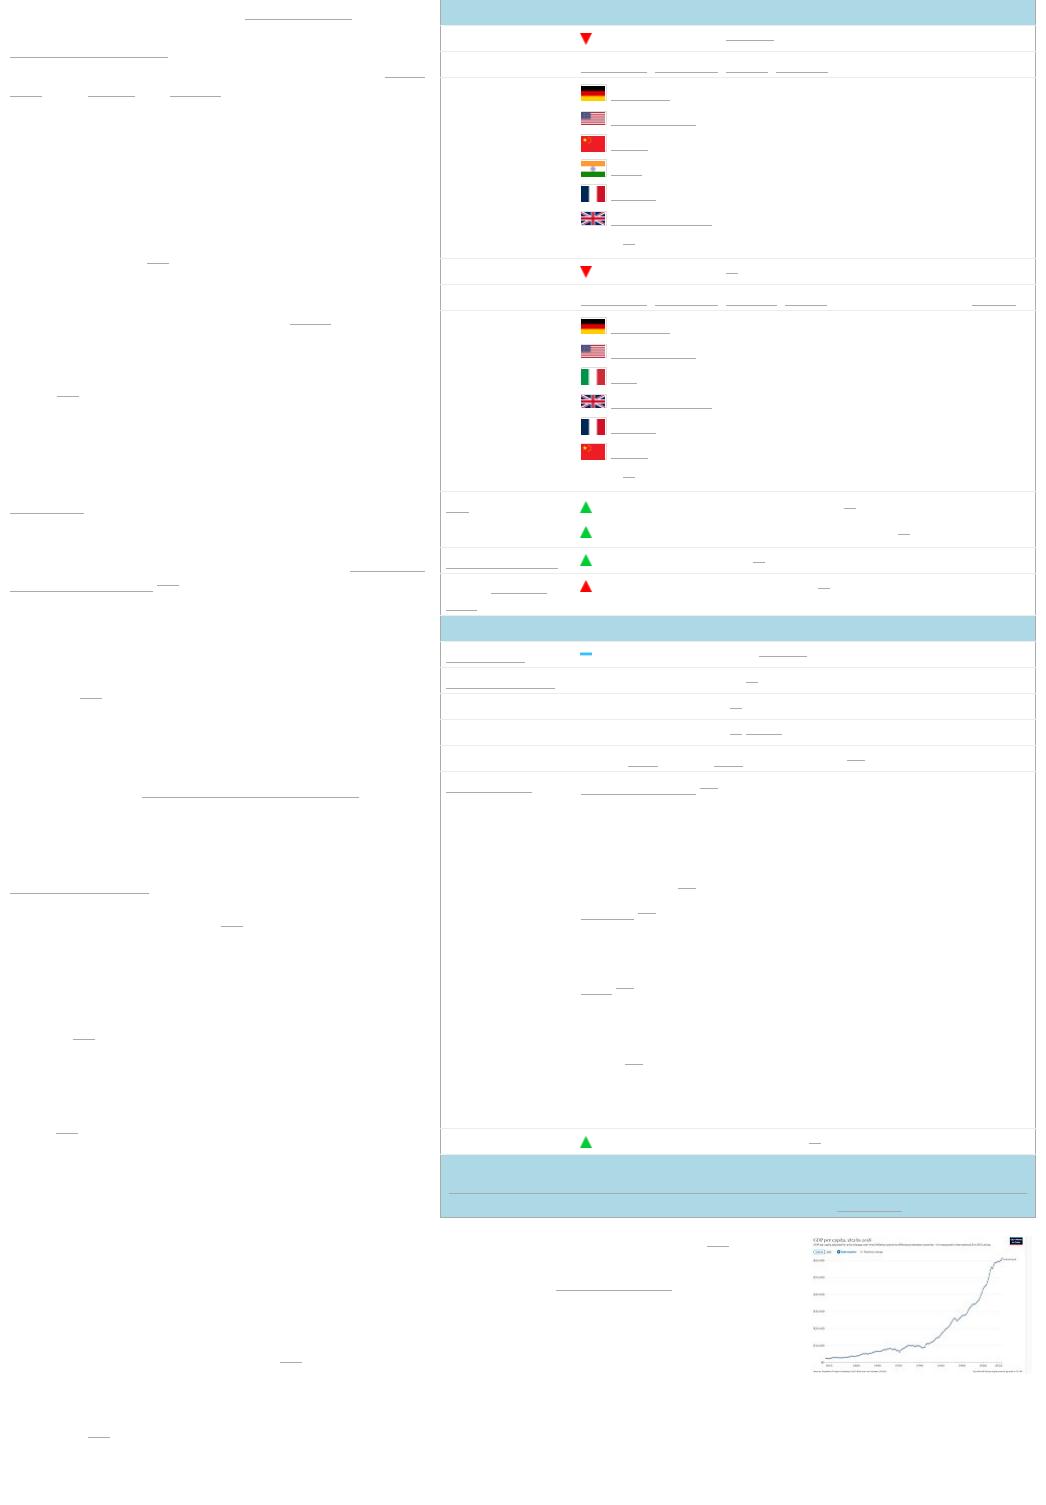
Gotthard line in 1882
Economy of Switzerland
The economy of Switzerland is one of the world's most
advanced and highly-developed free-market economies. The
service sector has come to play a significant economic role,
particularly the Swiss banking industry and tourism. The
economy of Switzerland ranked first in the world since 2015
Global Innovation Index[22][23] and third in the 2020 Global
Competitiveness Report.[24][25] According to United Nations
data for 2016, Switzerland is the third richest landlocked country
in the world after Liechtenstein and Luxembourg. Together with
the latter and Norway, they are the only three countries in the
world with a GDP per capita (nominal) above US$70,000 that
are neither island nations nor ministates.[26]
History
19th century
20th century
2000s
Data
Economic sectors
Watches
Industrial sector
Agriculture
Trade
Tourism
Banking and finance
Connection to illegal activities
Commodities trading
Workforce
Income and wealth distribution
Economic policy
Terrorism
European Union
Institutional membership
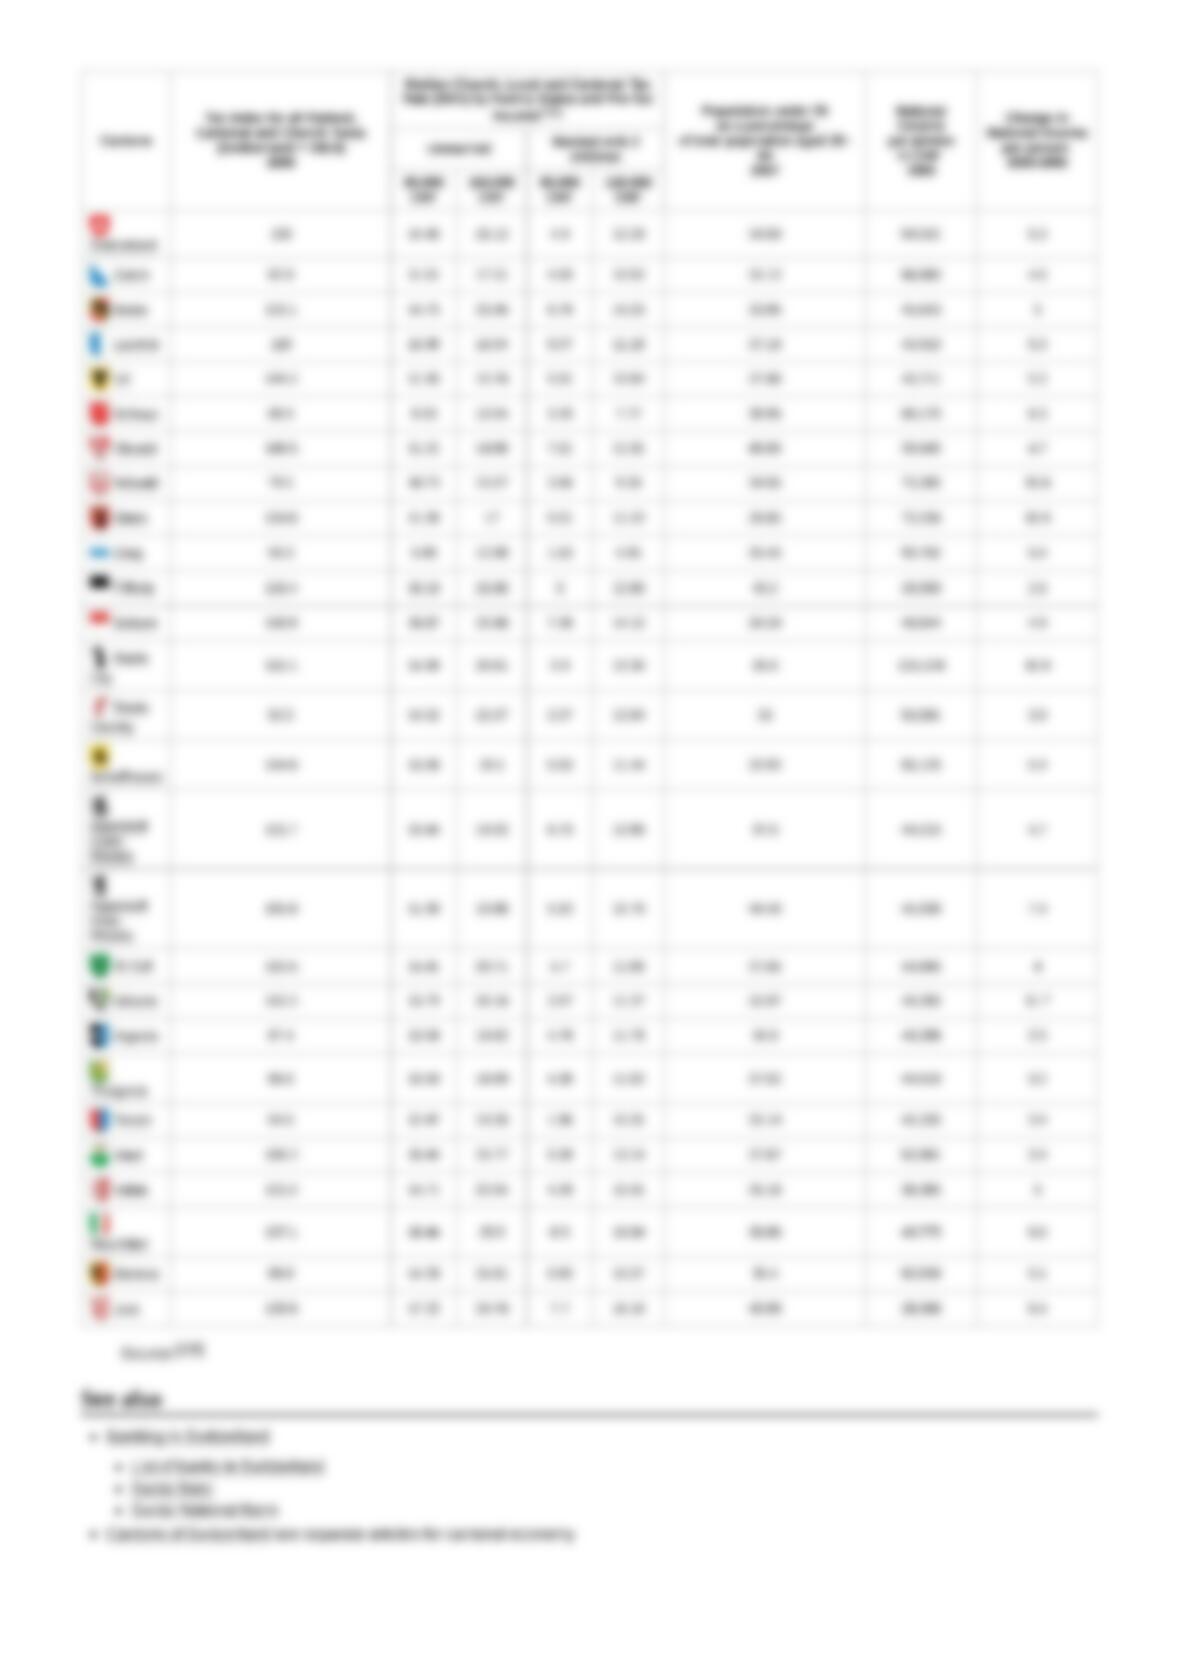
International comparison
Regional disparities
See also
Notes and references
Notes
References
Further reading
External links
Switzerland as a federal
state was established in
1848. Before that time,
the city-cantons of
Zurich, Geneva, and
Basel in particular began
to develop economically
based on industry and
trade, while the rural
regions of Switzerland remained poor and underdeveloped. While
a workshop system had been in existence throughout the early
modern period, the production of machines began in 1801 in St.
Gallen, with the third generation of machines imported from
Contents
History
19th century
External
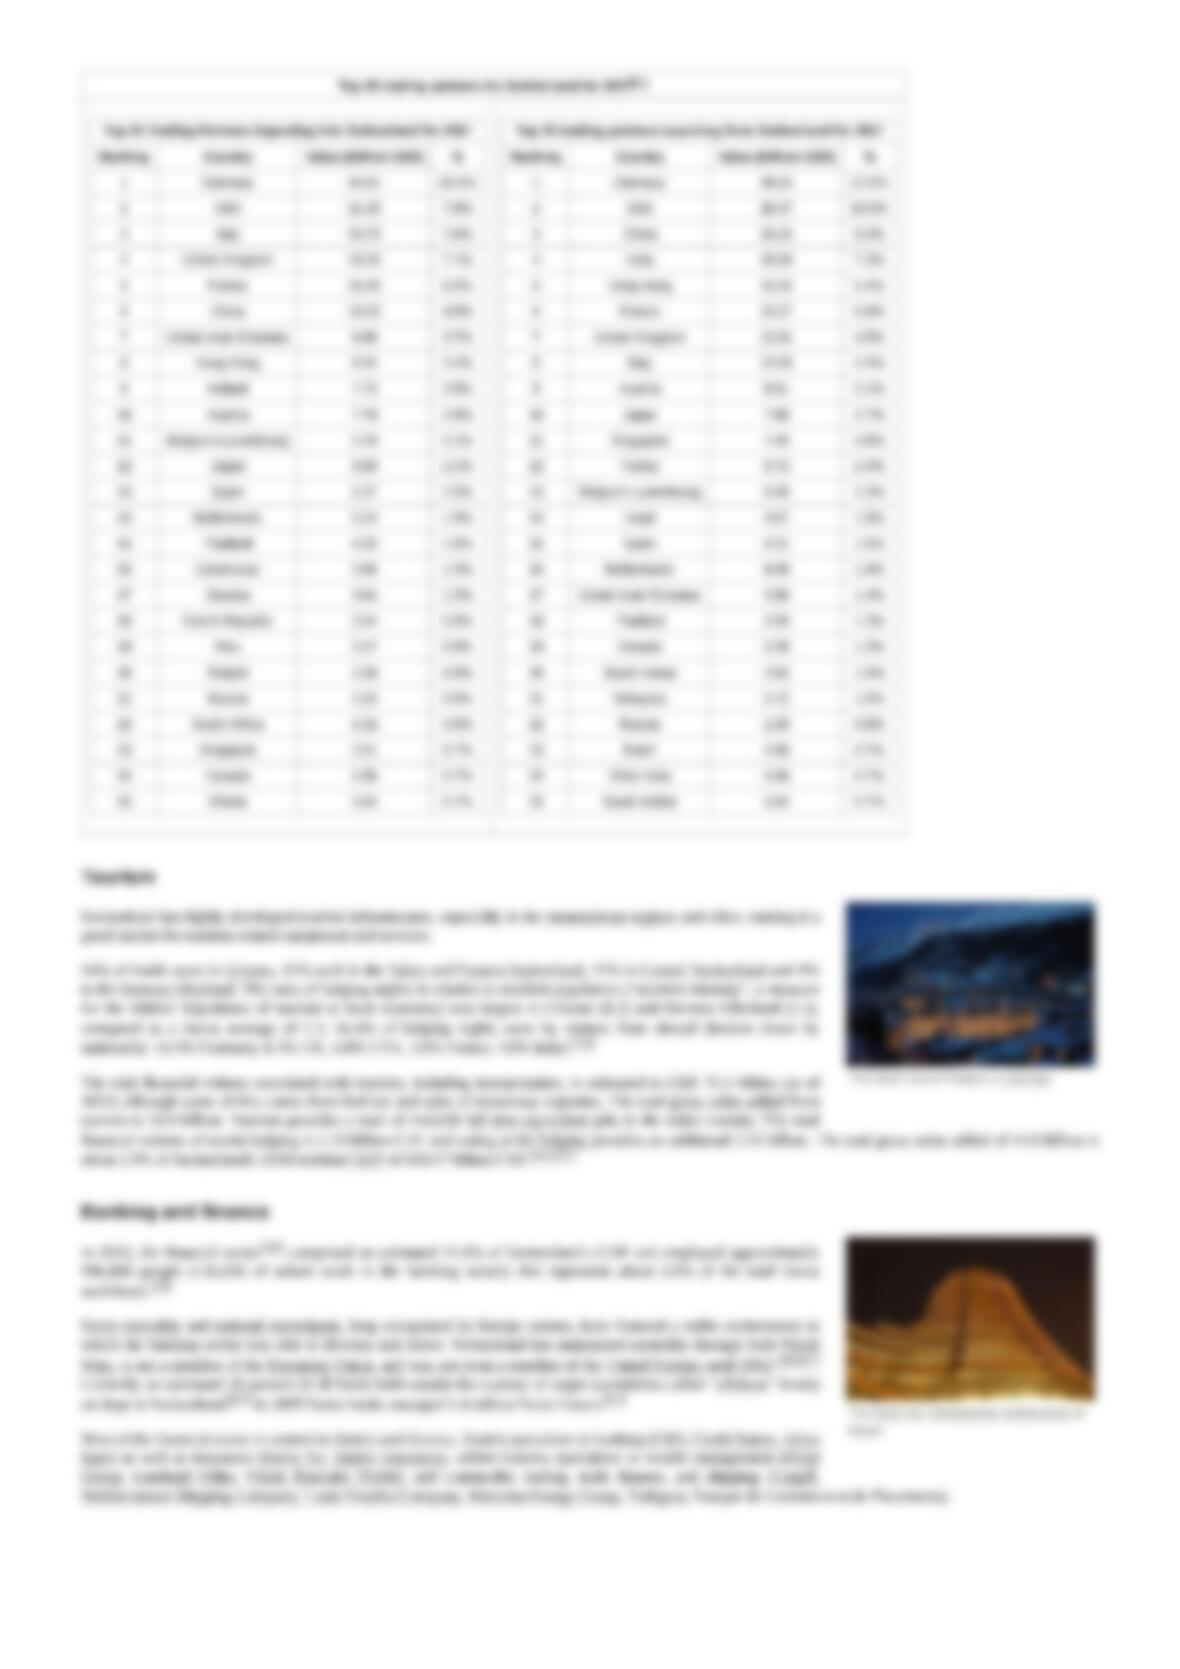
Exports $468.7 billion (2020)[6][note 1]
Export goods machinery, chemicals, metals, watches, agricultural products
Main export
partners
Germany(+) 15.2%
United States(+) 12.3%
China(-) 8.2%
India(+) 6.7%
France(+) 5.7%
United Kingdom(+) 5.7%
(2017)[6]
Imports $291.1 billion (2020)[6]
Import goods machinery, chemicals, vehicles, metals, agricultural products, textiles
Main import
partners
Germany(+) 20.9%
United States(+) 7.9%
Italy(+) 7.6%
United Kingdom(+) 7.3%
France(+) 6.8%
China(-) 5%
(2017)[6]
FDI stock $1.489 trillion (31 December 2017 est.)[6]
Abroad: $1.701 trillion (31 December 2017 est.)[6]
Current account $66.55 billion (2017 est.)[6]
Gross external
debt
$1.664 trillion (31 March 2016 est.)[6]
Public finances
Public debt 41.8% of GDP (2017 est.)[6][note 2]
Budget balance 1.1% (of GDP) (2017 est.)[6]
Revenues 242.1 billion (2017 est.)[6]
Expenses 234.4 billion (2017 est.)[6] [note 3]
Economic aid Donor: ODA 3 billion CHF (0.50% of GDP)[18]
Credit rating Standard & Poor's:[19]
AAA (Domestic)
AAA (Foreign)
AAA (T&C Assessment)
Outlook: Stable[20]
Moody's:[20]
Aaa
Outlook: Stable
Fitch:[20]
AAA
Outlook: Stable
Scope:[21]
AAA
Outlook: Stable
Foreign reserves $1.021 trillion (October 2020 est.)[6]
Main data source:
CIA World Fact Book (https://www.cia.gov/the-world-factbook/countries/switzerland)
All values, unless otherwise stated, are in US dollars.
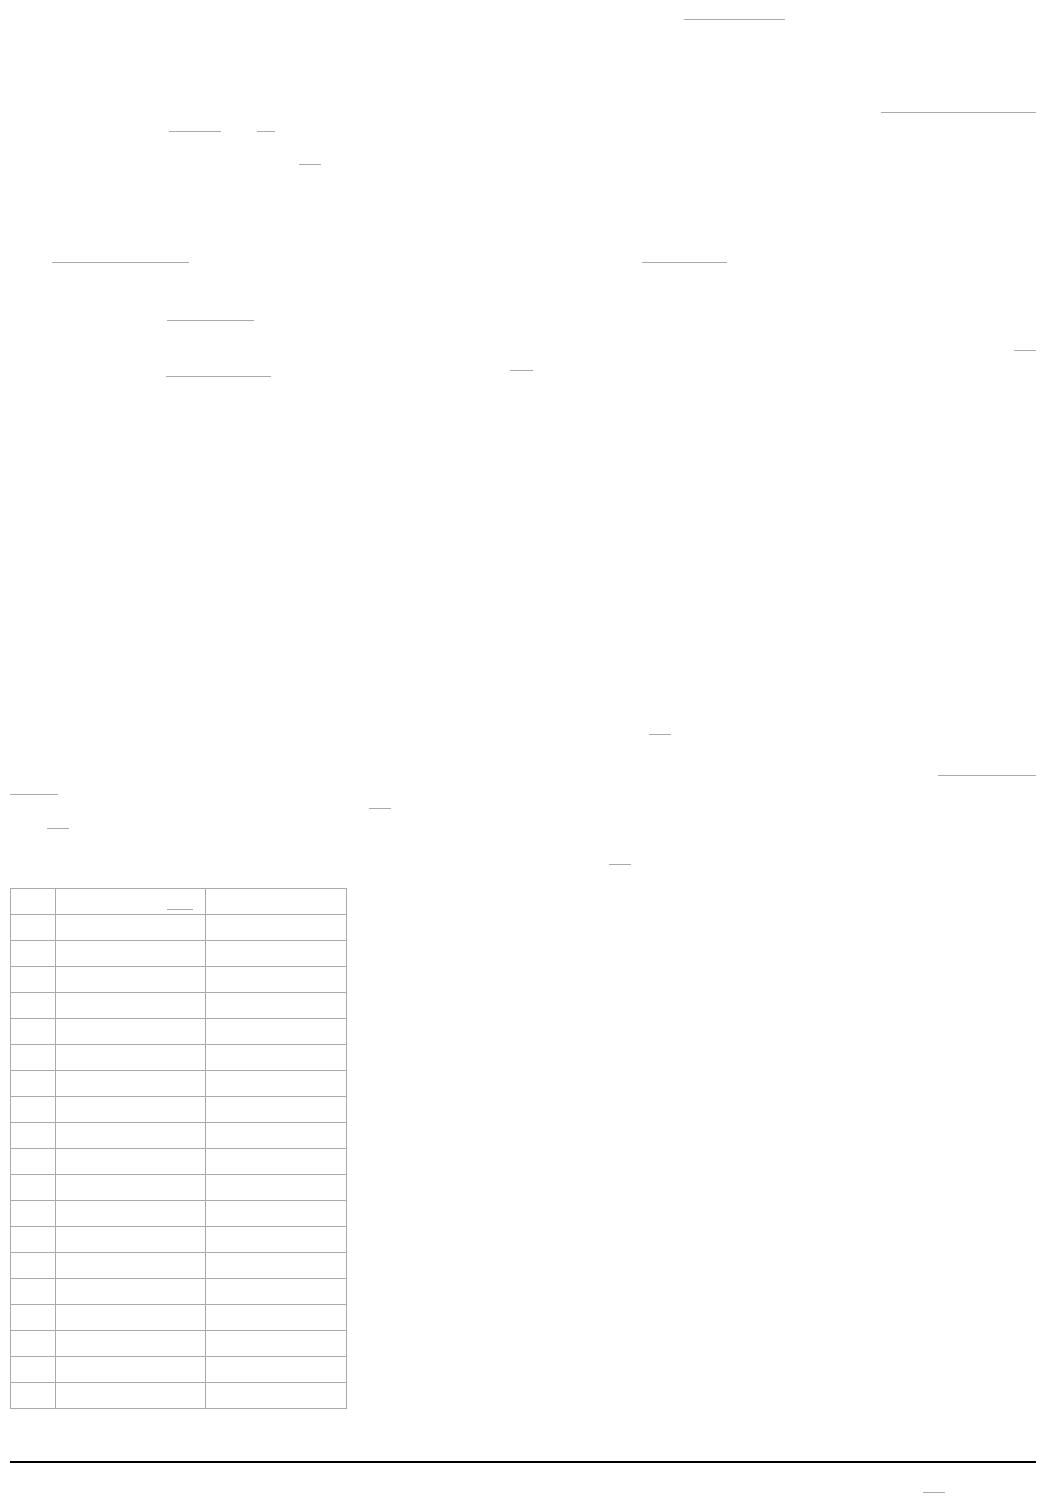
Development of real GDP per capita,
1851 to 2018
Great Britain. But in Switzerland, hydraulic power was often
used instead of steam engines because of the country's
mountainous topography and lack of significant deposits of coal.
By 1814, hand weaving had been mostly replaced by the power
loom. Both tourism and banking began to develop as economic
factors at about the same time. While Switzerland was primarily
rural, the cities experienced an industrial revolution in the late
19th century, focused especially on textiles. In Basel, for
example, textiles, including silk, were the leading industry. In
1888, women made up 44% of wage earners. Nearly half the
women worked in the textile mills, with household servants the
second largest job category. The proportion of women in the
workforce was higher between 1890 and 1910 than it was in the
late 1960s and 1970s.[27]
Railways played a major part in industrialization; the first railway
opened in 1847, between Zurich and Baden. Despite the
competition between private players, Switzerland was covered
with more than 1000 km of track by 1860. Nevertheless, the
network was barely coordinated because of the decentralised
system.[28]
The industrial sector began to grow in the 19th century with a
laissez-faire industrial/trade policy, Switzerland's emergence as
one of the most prosperous nations in Europe, sometimes termed
the "Swiss miracle", was a development of the mid 19th to early
20th centuries, among other things tied to the role of Switzerland
during the World Wars.[29]
Switzerland's total energy consumption, which was dropping
from the mid 1910s to the early 1920s, started to increase again in
the early 1920s. It stagnated during the 1930s before falling again
during the early 1940s; but rapid growth started once again in the
mid 1940s.[30]
In the 1940s, particularly during World War II, the economy
profited from the increased export and delivery of weapons to
Germany, France, the United Kingdom, and other European
countries. However, Switzerland's energy consumption decreased
rapidly. The co-operation of the banks with the Nazis (although
they also co-operated extensively with the British and French)
and their commercial relations with the Axis powers during the
war were later sharply criticised, resulting in a short period of
international isolation of Switzerland. Switzerland's production
facilities were largely undamaged by the war, and afterwards both
imports and exports grew rapidly.[31]
In the 1950s, annual GDP growth averaged 5% and Switzerland's
energy consumption nearly doubled. Coal lost its rank as
Switzerland's primary energy source, as other imported fossil
fuels, such as crude and refined oil and natural and refined gas,
increased.[32]
In the 1960s, annual GDP growth averaged 4% and Switzerland's
total energy consumption nearly doubled again. By the end of the
decade oil provided over three-quarters of Switzerland's
energy.[32]
In the 1970s the GDP growth rate gradually declined from a peak
of 6.5% in 1970; GDP then contracted by 7.5% in 1975 and
1976. Switzerland became increasingly dependent on oil
imported from its main suppliers, the OPEC cartel. The 1973
international oil crisis caused Switzerland's energy consumption to decrease in the years from 1973 to 1978.[32] In 1974
there were three nationwide car-free Sundays when private transport was prohibited as a result of the oil supply shock.
From 1977 onwards GDP grew again, although Switzerland was also affected by the 1979 energy crisis which resulted in
a short-term decrease in Switzerland's energy consumption. In 1970 industry still employed about 46% of the labor force,
but during the economic recession of the 1970s the services sector grew to dominate the national economy. By 1970
17.2% of the population and about one quarter of the work force were foreign nationals, though job losses during the
economic recession decreased this number.[31]
In the 1980s, Switzerland's economy contracted by 1.3% in 1982 but grew substantially for the rest of the decade, with
annual GDP growth between about 3% and 4%, apart from 1986 and 1987 when growth decreased to 1.9% and 1.6%
respectively.[33]
20th century
Switzerland's economy was marred by slow growth in the 1990s, having the weakest economic growth in Western Europe. The economy was affected by a three-
year recession from 1991 to 1993, when the economy contracted by 2%. The contraction also became apparent in Switzerland's energy consumption and export
growth rates. Switzerland's economy averaged no appreciable increase (only 0.6% annually) in GDP.
After enjoying unemployment rates lower than 1% before 1990, the three-year recession also caused the unemployment rate to rise to its all-time peak of 5.3% in
1997. In 2008, Switzerland was in second place among European countries with populations above one million in terms of nominal and purchasing power parity
GDP per capita, behind Norway (see list). Several times in the 1990s, real wages decreased since nominal wages could not keep up with inflation. However,
beginning in 1997, a global resurgence in currency movement provided the necessary stimulus to the Swiss economy. It slowly gained momentum, and peaked in
the year 2000 with 3.7% growth in real terms.[34]
In the early 2000s recession, being so closely linked to the economies of Western Europe and the United States, Switzerland could not escape the slowdown in
these countries. After the worldwide stock market crashes in the wake of the 9/11 terrorist attacks, there were more announcements of false enterprise statistics and
exaggerated managers' wages. The rate of GDP growth dropped to 1.2% in 2001; 0.4% in 2002; and minus 0.2% in 2003. This economic slowdown had a
noticeable impact on the labour market.
Many companies announced mass dismissals and thus the unemployment rate rose from its low of 1.6% in September 2000 to a peak of 4.3% in January 2004,[35]
although well below the European Union (EU) rate of 9.2% at the end of 2004.[36]
On 10 November 2002 the economics magazine Cash suggested five measures for political and economic institutions to implement to revive the Swiss economy:
1. Private consumption should be promoted with decent wage increases. In addition to that, families with children should get discounts on their health insurance.
2. Switzerland's national bank should revive investments by lowering interest rates. Besides that, monetary institutions should increasingly credit consumers and
offer cheaper land to be built on.
3. Switzerland's national bank was asked to devalue the Swiss Franc, especially compared to the Euro.
4. The government should implement the anti-cyclical measure of increasing budget deficits. Government spending should increase in the infrastructure and
education sectors. Lowering taxes would make sense in order to promote private household consumption.
5. Flexible work schedules should be instituted, thus avoiding low demand dismissals.
These measures were applied with successful results while the government strove for the Magical Hexagon of full employment, social equality, economic growth,
environmental quality, positive trade balance and price stability. The rebound which started in mid-2003 saw growth rate growth rate averaging 3% (2004 and
2005 saw a GDP growth of 2.5% and 2.6% respectively; for 2006 and 2007, the rate was 3.6%). In 2008, GDP growth was modest in the first half of the year
while declining in the last two quarters. Because of the base effect, real growth came to 1.9%. While it contracted 1.9% in 2009, the economy started to pick up in
Q3 and by the second quarter of 2010, it had surpassed its previous peak. Growth for 2010 was 2.6%[37]
The stock market collapse of 2007-2009 deeply affected investment income earned abroad. This translated to a substantial fall in the surplus of the current account
balance. In 2006, Switzerland recorded a 15.1% per GDP surplus. It went down to 9.1% in 2007 and further dropped to 1.8% in 2008. It recovered in 2009 and
2010 with a surplus of 11.9% and 14.6% respectively.[38] Unemployment peaked in December 2009 at 4.4%. In August 2018 the unemployment rate was
2.4%.[35]
The chart below shows the trend of the gross domestic product of Switzerland at market prices:[39]
Year GDP (billions of CHF) US Dollar Exchange
1980 184 1.67 Francs
1985 244 2.43 Francs
1990 331 1.38 Francs
1995 374 1.18 Francs
2000 422 1.68 Francs
2005 464 1.24 Francs
2006 491 1.25 Francs
2007 521 1.20 Francs
2008 547 1.08 Francs
2009 535 1.09 Francs
2010 546 1.04 Francs
2011 659 0.89 Francs
2012 632 0.94 Francs
2013 635 0.93 Francs
2014 644 0.92 Francs
2015 646 0.96 Francs
2016 659 0.98 Francs
2017 668 1.01 Francs
2018 694 1.00 Francs
The following table shows the main economic indicators in 1980–2021 (with IMF staff estimtates in 2022–2027). Inflation below 5% is in green.[40]
2000s
Data
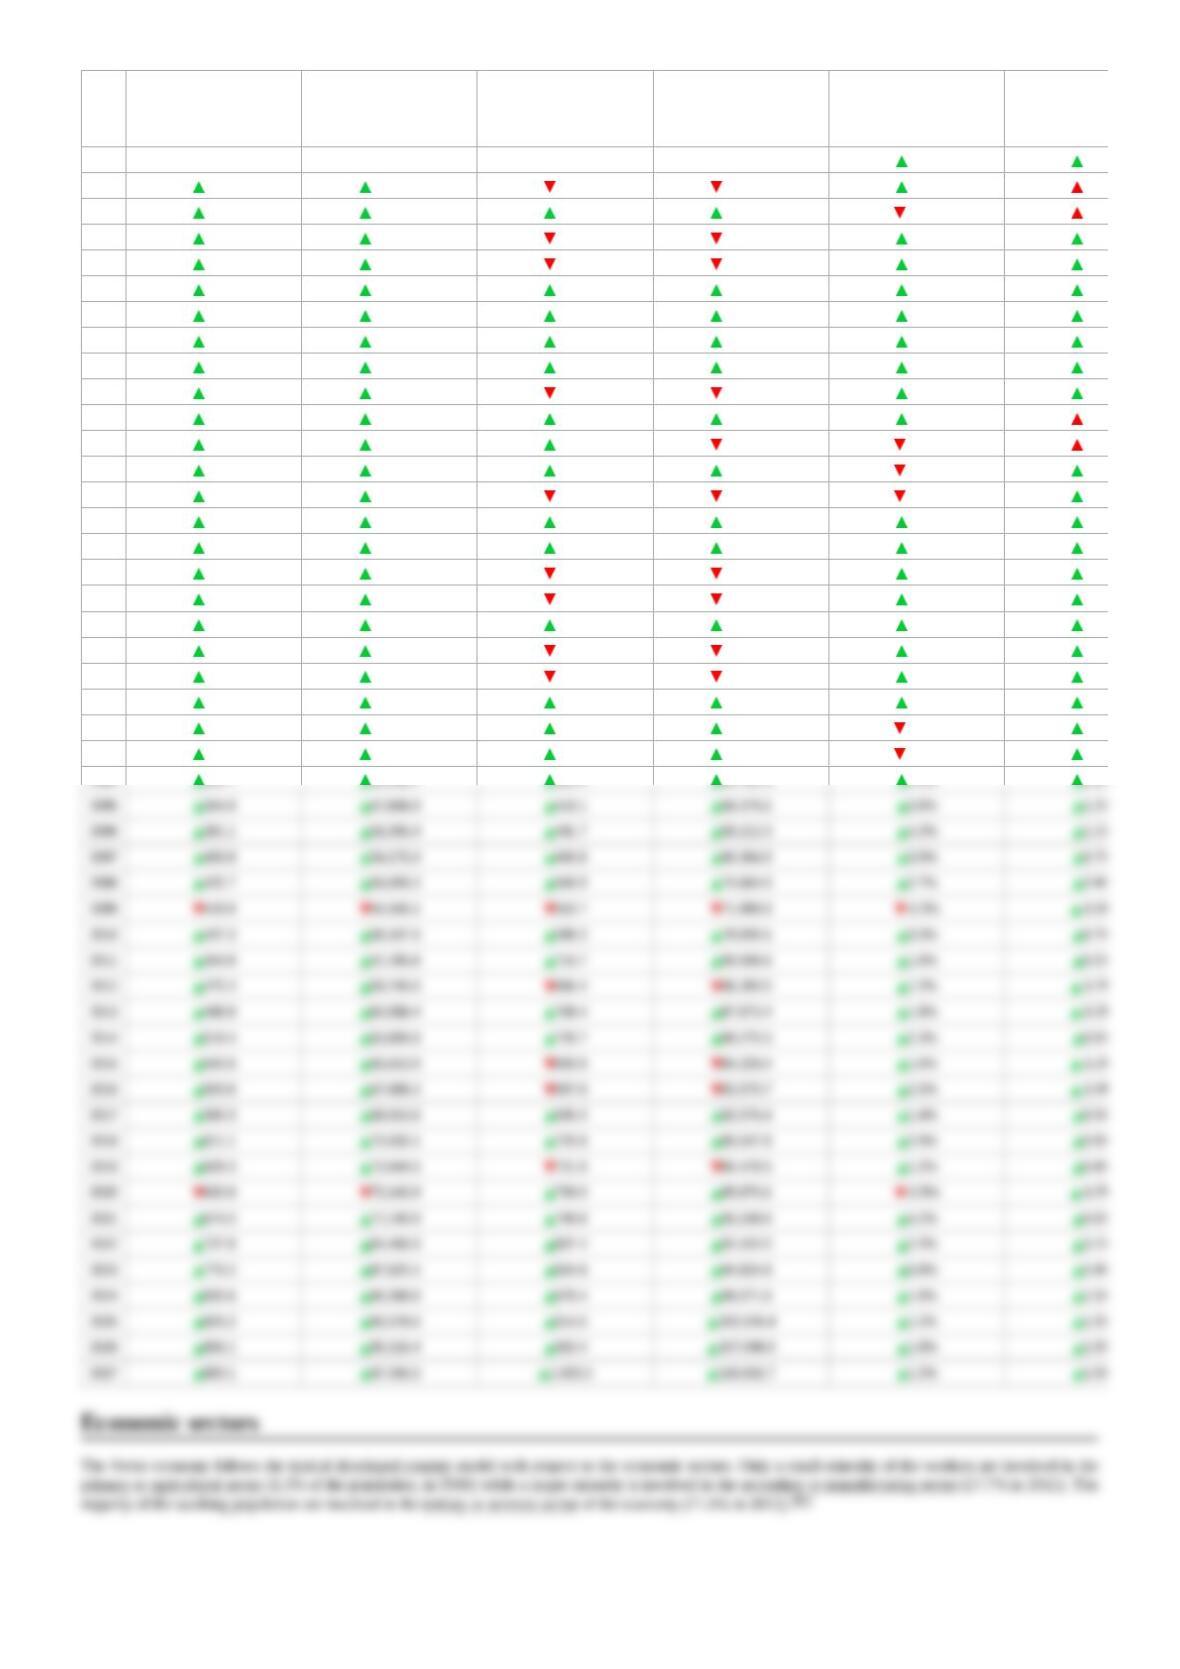
Year
GDP
(in Bil. US$PPP)
GDP per capita
(in US$ PPP)
GDP
(in Bil. US$nominal)
GDP per capita
(in US$ nominal)
GDP growth
(real)
Inflation
(in Percent)
1980 114.1 18,092.3 122.5 19,426.6 5.1% 4.0%
1981 126.9 20,028.6 112.1 17,699.8 1.6% 6.5%
1982 132.9 20,856.0 114.9 18,027.7 -1.3% 5.7%
1983 139.0 21,677.9 114.5 17,865.4 0.6% 3.0%
1984 148.4 23,084.4 109.4 17,019.4 3.1% 2.9%
1985 158.8 24,591.4 111.0 17,187.9 3.7% 3.4%
1986 164.9 25,433.0 159.1 24,529.6 1.8% 0.7%
1987 171.6 26,309.8 199.1 30,520.6 1.5% 1.4%
1988 183.5 27,943.3 215.4 32,794.3 3.3% 1.9%
1989 199.1 30,083.0 208.1 31,440.4 4.4% 3.2%
1990 214.3 32,105.6 265.9 39,842.8 3.7% 5.4%
1991 219.5 32,479.1 269.0 39,811.0 -0.9% 5.9%
1992 224.1 32,754.3 279.8 40,883.2 -0.1% 4.0%
1993 229.1 33,167.1 272.0 39,375.5 -0.1% 3.3%
1994 237.1 34,015.9 301.2 43,226.5 1.3% 0.9%
1995 243.4 34,675.3 353.0 50,287.8 0.6% 1.8%
1996 249.0 35,259.4 340.2 48,171.7 0.5% 0.8%
1997 258.9 36,567.3 294.7 41,623.1 2.2% 0.5%
1998 269.5 37,982.7 303.1 42,719.7 2.9% 0.0%
1999 277.8 38,999.4 297.5 41,765.2 1.7% 0.8%
2000 295.7 41,280.3 279.2 38,970.2 4.1% 1.6%
2001 307.3 42,698.6 286.7 39,832.2 1.6% 1.0%
2002 311.9 42,990.1 309.5 42,656.6 -0.1% 0.6%
2003 317.8 43,454.0 362.1 49,512.2 -0.1% 0.6%