Econ 305 – International Economy
Term Paper on the Economy of Italy
Submitted by
Yukun Gui
Jabari Holcomb
Needs to be done:
1. Correct grammar and wording
2. Rephrase the whole paper.
(use terminology from class notes)
3. Get rid of some info. (too long)
4. Insert charts (my infos are slightly outdated, see if you
can find info and create charts, or find updated charts)
5. Conclusion / Summary
6. Plagiarism check

Overview of Italian Economy
By the main trend of Italy’s economy and economic prospect according to the world organization
for economic and development data, Italy GDP (PPP Statistics) is ranked the sixth in the world.
The per capita income is 35.7% lower than American, but in the middle level in the EU. Italy has
a long history of international trade, which is very prosperous. Therefore, the Italian economy
can be open: Italy international trade accounted for 8.9% of the total in 7 major industrial
countries, the percentage is much higher than GDP. In the past 50 years, due to Italy’s
traditional business and the free trade policy, great changes have taken place in the economy.
During 1950-1963, Italy had a GDP average annual growth of 5.9%, with a peak of 8.3% annual
growth in 1961. This was known as the famous “Italy economic miracle” in 1958-1963. During
this period, the gross value of industrial output growth hit a record high, with an average of 10%.
The national unemployment rate is the lowest, the proportion of investment in GDP is very high:
for example, the ratio was as high as 27% in 1963. After 1963, the economic growth slowed,
since the first oil crisis in 1973, so that the economic slowdown. In the 70’s, the oil crisis on the
Italian economy have been particularly hard hit, because Italy is heavily dependent on foreign
energy supplies. High inflation era came in the 80’s and Italy’s industry went into restructuring
period, in order to adapt to the new changes in the international environment. The 90’s
economic policy was created to solve the problem of the previous fiscal year fiscal imbalances
accumulated. The focus was on the private sector, in order to promote it to become the main
driving force of economic growth: a lot of the original regulations were decreed to cancel the
implementation of the state-owned enterprises and bank large privatization programs. This is to
establish effective fiscal policy, currency value stability, low interest rate for the purpose of
making the right move, Italy joined the European Monetary Union (EMU) in January 1, 1999 and
became one of the euro to create a country. From then until the end of 2001, a member of the
European Monetary Union to admit the euro as their legal unit of currency trading. The euro
currency in circulation will be officially on January 1, 2002.
The trend and policy
Italy fiscal and monetary system in the past 20 years has been in a worse place from the 90’s of
last century. Italy policymakers was to stabilize and strengthen the financial and monetary
system as their main task. The effect is very significant, making the country the successful
accession to the European Monetary Union (EMU) in 1999 January, and become the euro to

create a country. In 1990, Italy had a budget deficit of 11.1% of GDP, by 1996, it went down to
7.1%. After a few years, the government adopted a tight fiscal policy, so that the budget deficit
to decline further to 2.7%, less than 3% of the Maastricht Treaty required to become the highest
standard to create the country’s euro. The 2000 budget deficit as a share of GDP is 1.5%. From
1991 onwards, the major surplus began to increase. Inflation has also achieved outstanding
results: during 1997-1999, the consumer price index was never more than 2%. The 2000
consumer price index was 2.6%. Successful inflation, low budget deficit and successful
accession to the European Monetary Union, decided to sharply reduce long-term interest rates,
making it flat with the big European countries. Over the past 10 years, the Italian government
changed the fiscal balance of payments situation. Since 1993, fiscal revenue has been in
surplus. The balance of net debt of Italy also accounts for the GDP in 1992 to 10.8% in 1999,
and Italy has become a creditor nation. Macro-economic adjustment policy of the last century
has led to the production field of short-term activity decreasing, GDP growth is slow, and the
recent Asian financial crisis has further weakened Italy’s 1998-1999 annual growth dynamics.
However, in 2000, Italy and other European countries, reentered the track of rapid economic
growth.
International trade
In 2000, Italy imports are at a 23.6% increase over the previous year, exports increased by
16.4%. The euro’s dominance over the U.S dollar makes Italy last year’s exports increased
rapidly. The stability of the euro area increased in Italy and as a member of the euro zone trade.
By the end of 2000 to early 2001, Italy’s exports to the EU grew faster than non-European
regions. On the whole, imports grew faster than exports, there was a trade surplus in 2000 of
1.3 billion US dollars (0.1% of GDP) which is 90% less than the 1.49 billion US dollars in 1999
(1.3% of GDP). The economic slowdown in the United States and the euro area, is expected to
have a large impact on Italy’s export. Considering the GDP slower growth, net exports will be
growing faster than GDP, making Italy the trade surplus. Italy’s trade surplus will be higher than
expected a percentage. In 2000, Italy’s foreign exchange reserves reduced to 40.3 billion US
dollars more than 40.8 billion US dollars in 1999 slightly dropped.
Italy’s inflation is strictly within the prescribed scope of the EU. The wage adjustment protocol
1992 and issued in 1993, make the wages floating pressure and inflation rate is unchanged, the
agreement was re-signed on 1998, and was valid until 2002. In addition to the wage agreed
terms, the new protocol framework also cost cutting employment, also include investment
incentives and worker training etc. The 2001 inflation rate estimation will stabilize at about 2.5%,
slightly lower than the planned 2.3%.
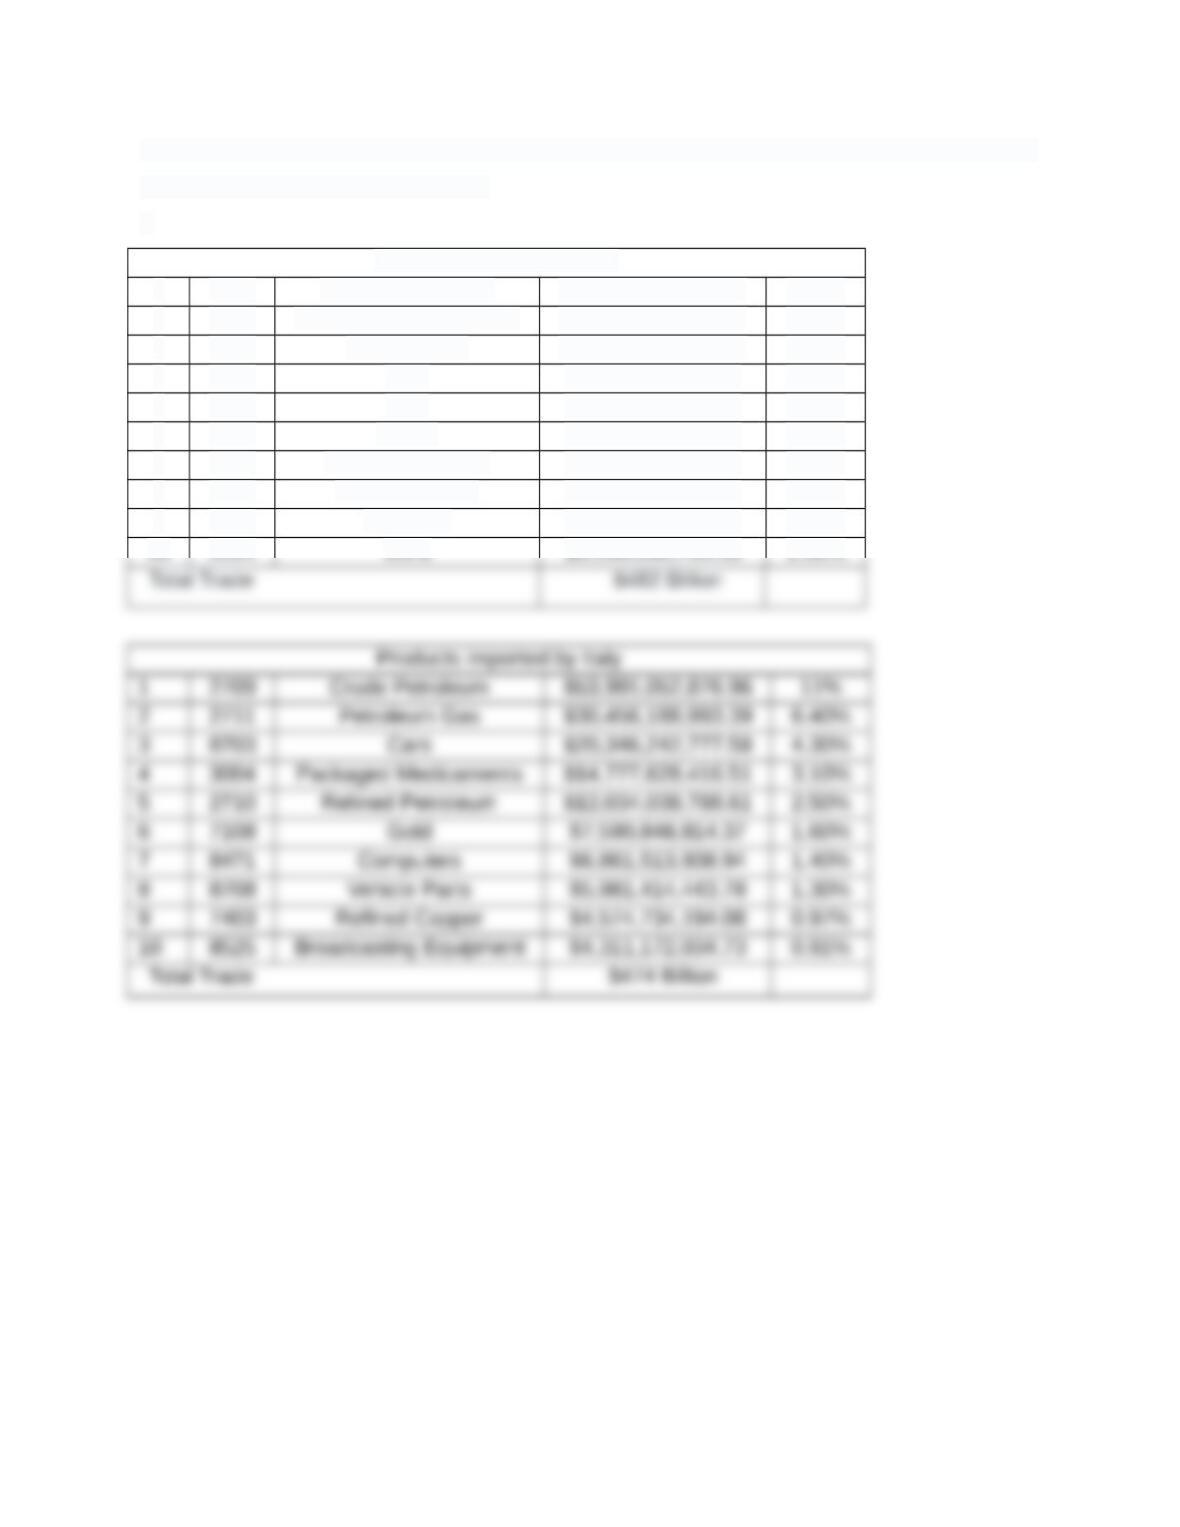
In 2013, Italy has a trade surplus of $482-$474 = $8 billion U.S. dollars.
Products exported by Italy
1 2710 Refined Petroleum $25,040,030,371.30 5.20%
2 3004 Packaged Medicaments $20,159,881,409.47 4.20%
3 8708 Vehicle Parts $12,839,542,230.02 2.70%
4 8703 Cars $9,587,416,229.21 2.00%
5 7108 Gold $9,248,299,761.85 1.90%
6 8481 Valves $8,244,040,362.55 1.70%
7 6403 Leather Footwear $7,145,771,834.54 1.50%
8 9403 Other Furniture $6,355,322,472.39 1.30%
9 7113 Jewellery $6,247,713,509.00 1.30%