
ECONOMIC ENVIRONMENT & POLICY
SUBMITTED TO: DR. PAROMA MITRA
SUBMITTED BY: GROUP B9
EEP ASSIGNMENT
PROJECT REPORT BY:
———-GROUP B9———-
AMIT KUMAR 20PGPM077
DHAANYA 20PGPM090
GURKIRAT SINGH BASOOR 20PGPM092
ROHAN TEKRIWAL 20PGPM115
SAYAN MITRA 20PGPM120
VISHAL DAYMA 20PGPM133
GUDAPATI JITENDRA PAVAN 20PGPM136
INTRODUCTION: –
Since both the Indian and Japanese economies are being majorly influenced by automobiles industries in
manufacturing sector, it makes economic sense to make a comparative analysis of these two sectors when
we do a macroeconomic analysis, in this project we, the B9 did a detailed comparative analysis of both these
largest countries with massive economic output, one being a developed country and the other being a
developing country, it’s a very good learning curve for our team doing this project report. That being said,
we did comparison of GDP’s of both the countries and their growth rates from year 2012 to the latest i.e.,
2020, and we did analysis on how automobiles manufacturing sector had/having an impact on these
countries GDP and the per capita income.
DEMOGRAPHIC COMPARISON: –
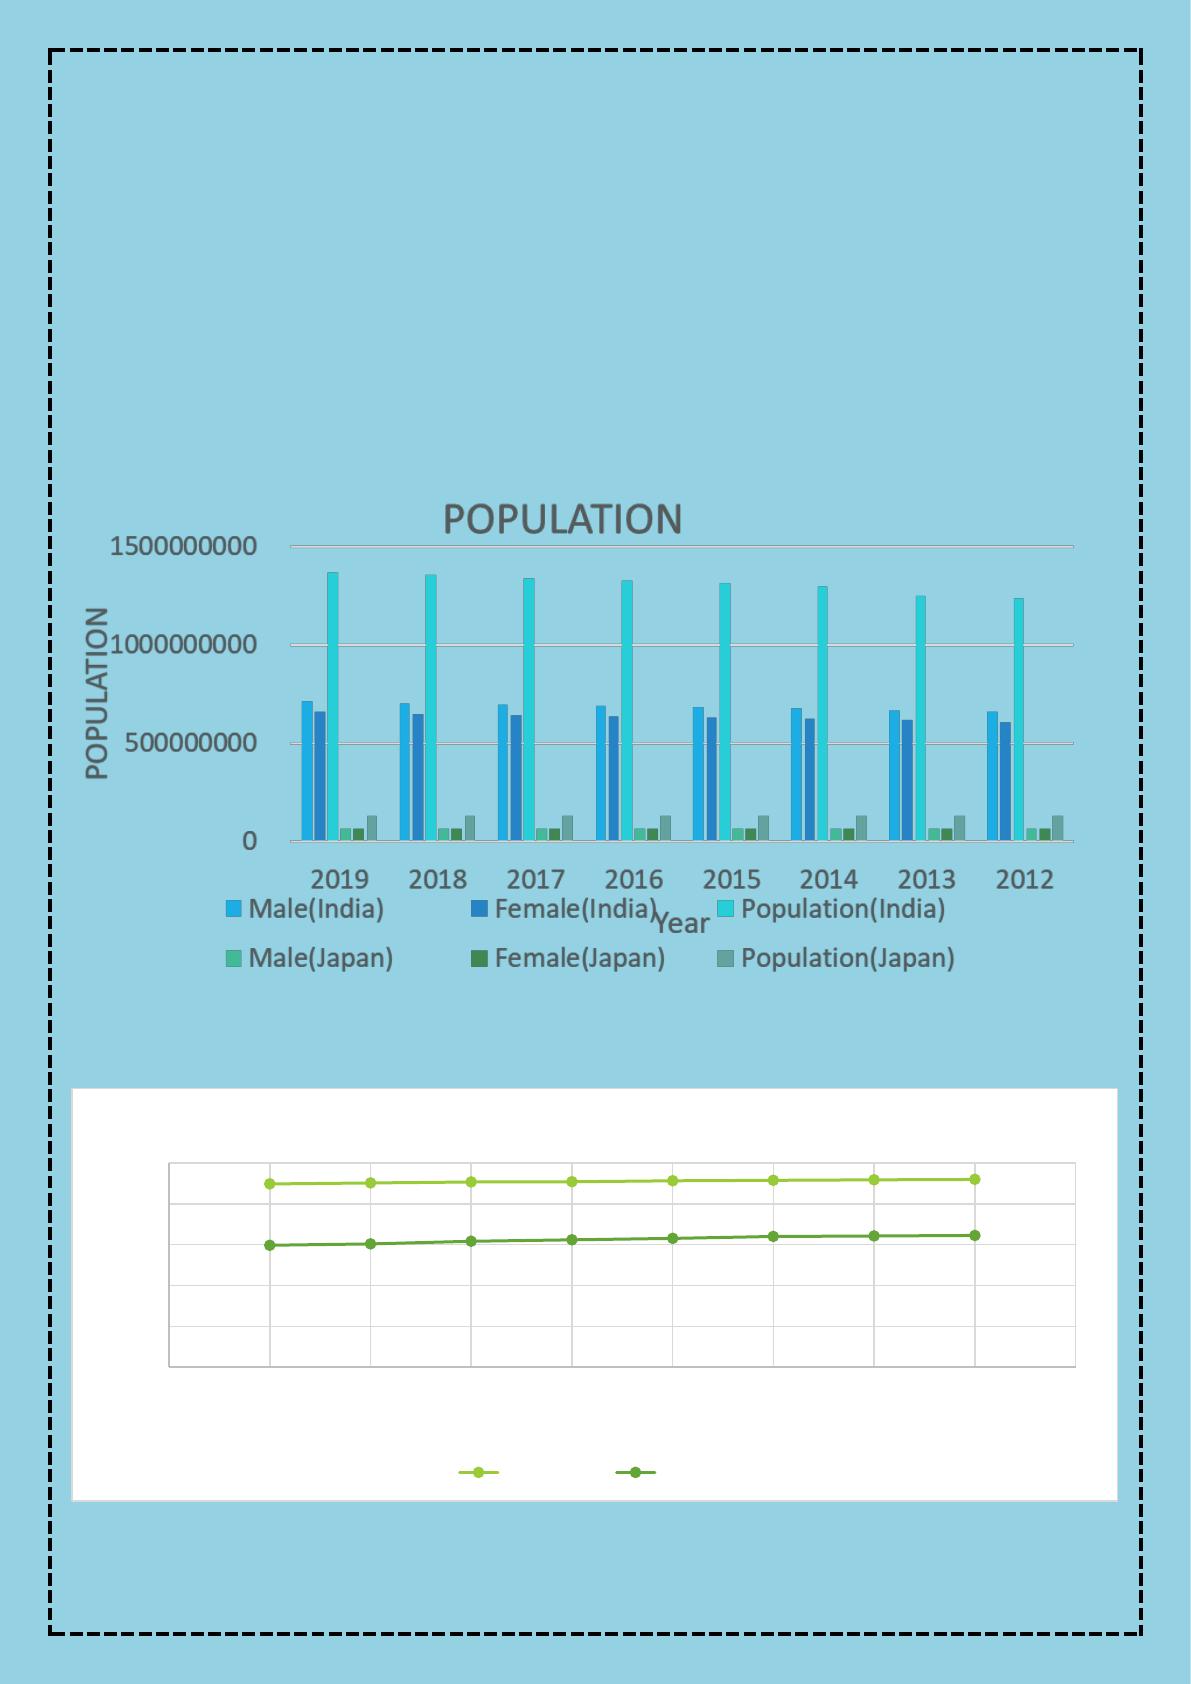
India is approximately 3,287,263 sq km, while Japan is approximately 377,915 sq km, making Japan 11.5%
the size of India. Meanwhile, the population of India is ~1.3 billion people and Japan’s is of 12.63 crores.
0
0.2
0.4
0.6
0.8
1
2011 2012 2013 2014 2015 2016 2017 2018 2019 2020
HDI
Year
HDI Comparison
HDI Japan HDI India
In 2020, the unemployment rate in India was estimated to be 5.4 percent. In 2020, the unemployment rate in
Japan was at about 2.34 percent.
Comparison on the basis of Inflation, Exchange and Interest rates-
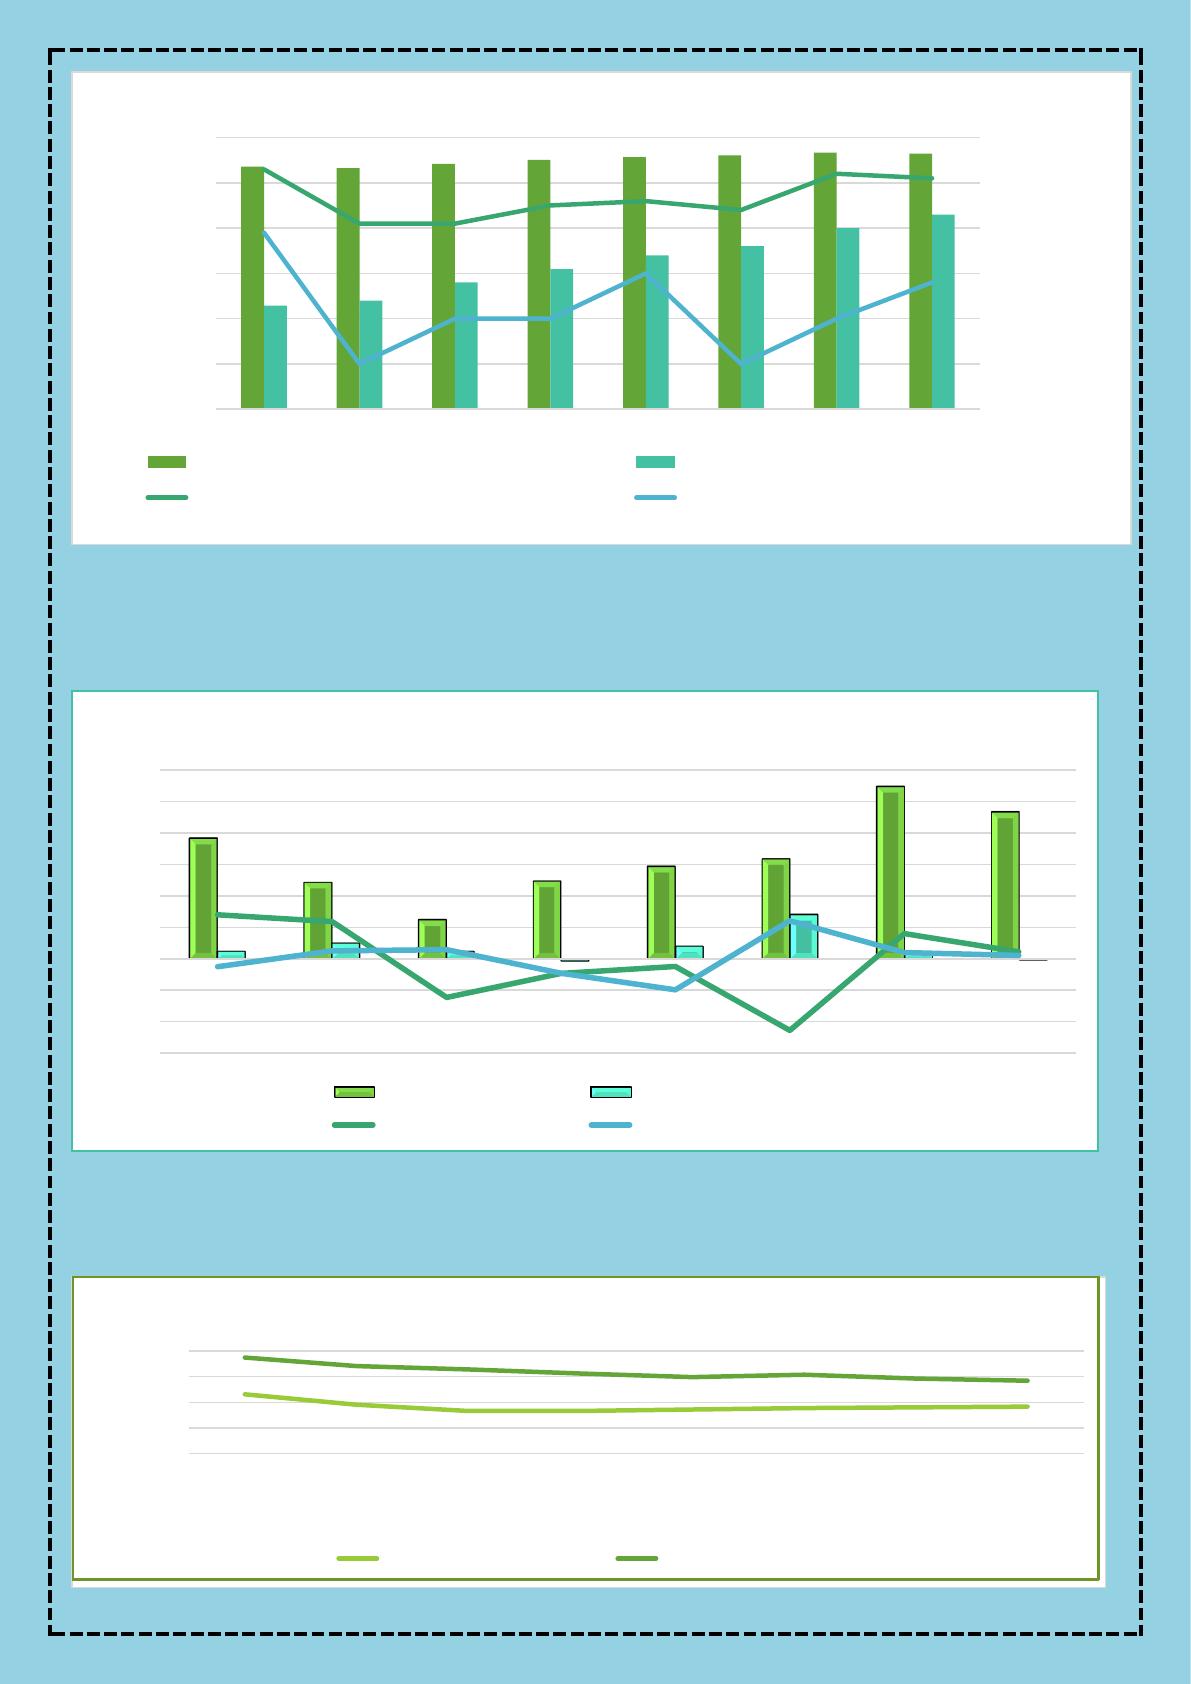
India fairs well in exchange rates compared to Japan (comparison in USD), but Interest rates in Japan are
way less than that of in India, in fact they have negative interest rates in Japan as of now, where as in India it
is around 6.4% in the year 2019.
-0.50%
-0.40%
-0.30%
-0.20%
-0.10%
0.00%
0.10%
0.00%
1.00%
2.00%
3.00%
4.00%
5.00%
6.00%
Year 2019 2018 2017 2016 2015 2014 2013
ANNUAL CHANGE %
UNEMPLOYMENT %
year
UNEMPLOYMENT COMPARISON
Unemployment Rate (%) INDIA Unemployment Rate (%) JAPAN
Annual Change INDIA Annual Change JAPAN
-6.00%
-4.00%
-2.00%
0.00%
2.00%
4.00%
6.00%
8.00%
10.00%
12.00%
Year 2019 2018 2017 2016 2015 2014 2013
Inflation rate Variation
Inflation Rate (%) India Inflation Rate (%) Japan
Annual Change India Annual Change Japan
0
0.005
0.01
0.015
0.02
2012 2013 2014 2015 2016 2017 2018 2019
Exchange rate in USD
Year
Exchange rates
exchange rates Japan exchange rates India

As spotted in the graph Japan also have tried putting negative interest rate to boost development and growth
but still if we see the performance of Japan in the subsequent year it did not perform that well. It will be
worth to conclude that introduction of negative interest rate also did not help Japan.
ECONOMY OF INDIA: –
The economy of India is characterised as a middle-income developing market economy. It is the world’s
fifth-largest economy by nominal GDP and the third-largest by purchasing power parity (PPP).
According to the International Monetary Fund (IMF), on a per capita income basis, India ranked 142nd by
GDP (nominal) and 124th by GDP (PPP) in 2020.
Since the start of the 21st century, annual average GDP growth has been 6% to 7%, and from 2014 to 2018,
India was the world’s fastest growing major economy, surpassing China. Historically, India was the largest
economy in the world for most of the two millennia from the 1st until 19th century.
The automotive industry in India is the fifth-largest in the world (fourth largest in 2018, a bit ahead of
Germany, then back to fifth the following year). India is expected to displace Japan as the third largest auto
market by 2021.
Overall, domestic automobiles sales increased at 1.29% CAGR between FY16-FY20 with 21.55 million
vehicles being sold in FY20.
Overall, automobile export reached 4.77 million vehicles in FY20, growing at a CAGR of 6.94% during
FY16-FY20.
ECONOMY OF JAPAN: –
The economy of Japan is a highly developed free-market economy. It is the third-largest in the world by
nominal GDP and the fourth-largest by purchasing power parity (PPP) and is the world’s second largest
developed economy.
According to the International Monetary Fund, the country’s per capita GDP (PPP) was at $41,637 (2020).
In 2018, Japan was the world’s fourth-largest importer and the fourth-largest exporter.[29] It has the world’s
second-largest foreign-exchange reserves worth $1.3 trillion.[20] It ranks 29th on Ease of doing business
index and 5th on Global Competitiveness Report.[30] It ranks first in the world in the Economic Complexity
Index. Japan is also the world’s third-largest consumer market.
-2
-1
0
1
2
3
4
5
6
7
8
2012 2013 2014 2015 2016 2017 2018 2019
Interest Rate
Year
Interest Rates
Interest Rate India Interest Rate Japan
Japan has been in the top three of the countries with most cars manufactured since the 1960s, surpassing
Germany. The automotive industry in Japan rapidly increased from the 1970s to the 1990s (when it was
oriented both for domestic use and worldwide export) and in the 1980s and 1990s, overtook the U.S. as the
production leader with up to 13 million cars per year manufactured and significant exports.
Japan is currently the third largest automotive producer in the world with an annual production of 9.9
million automobiles.
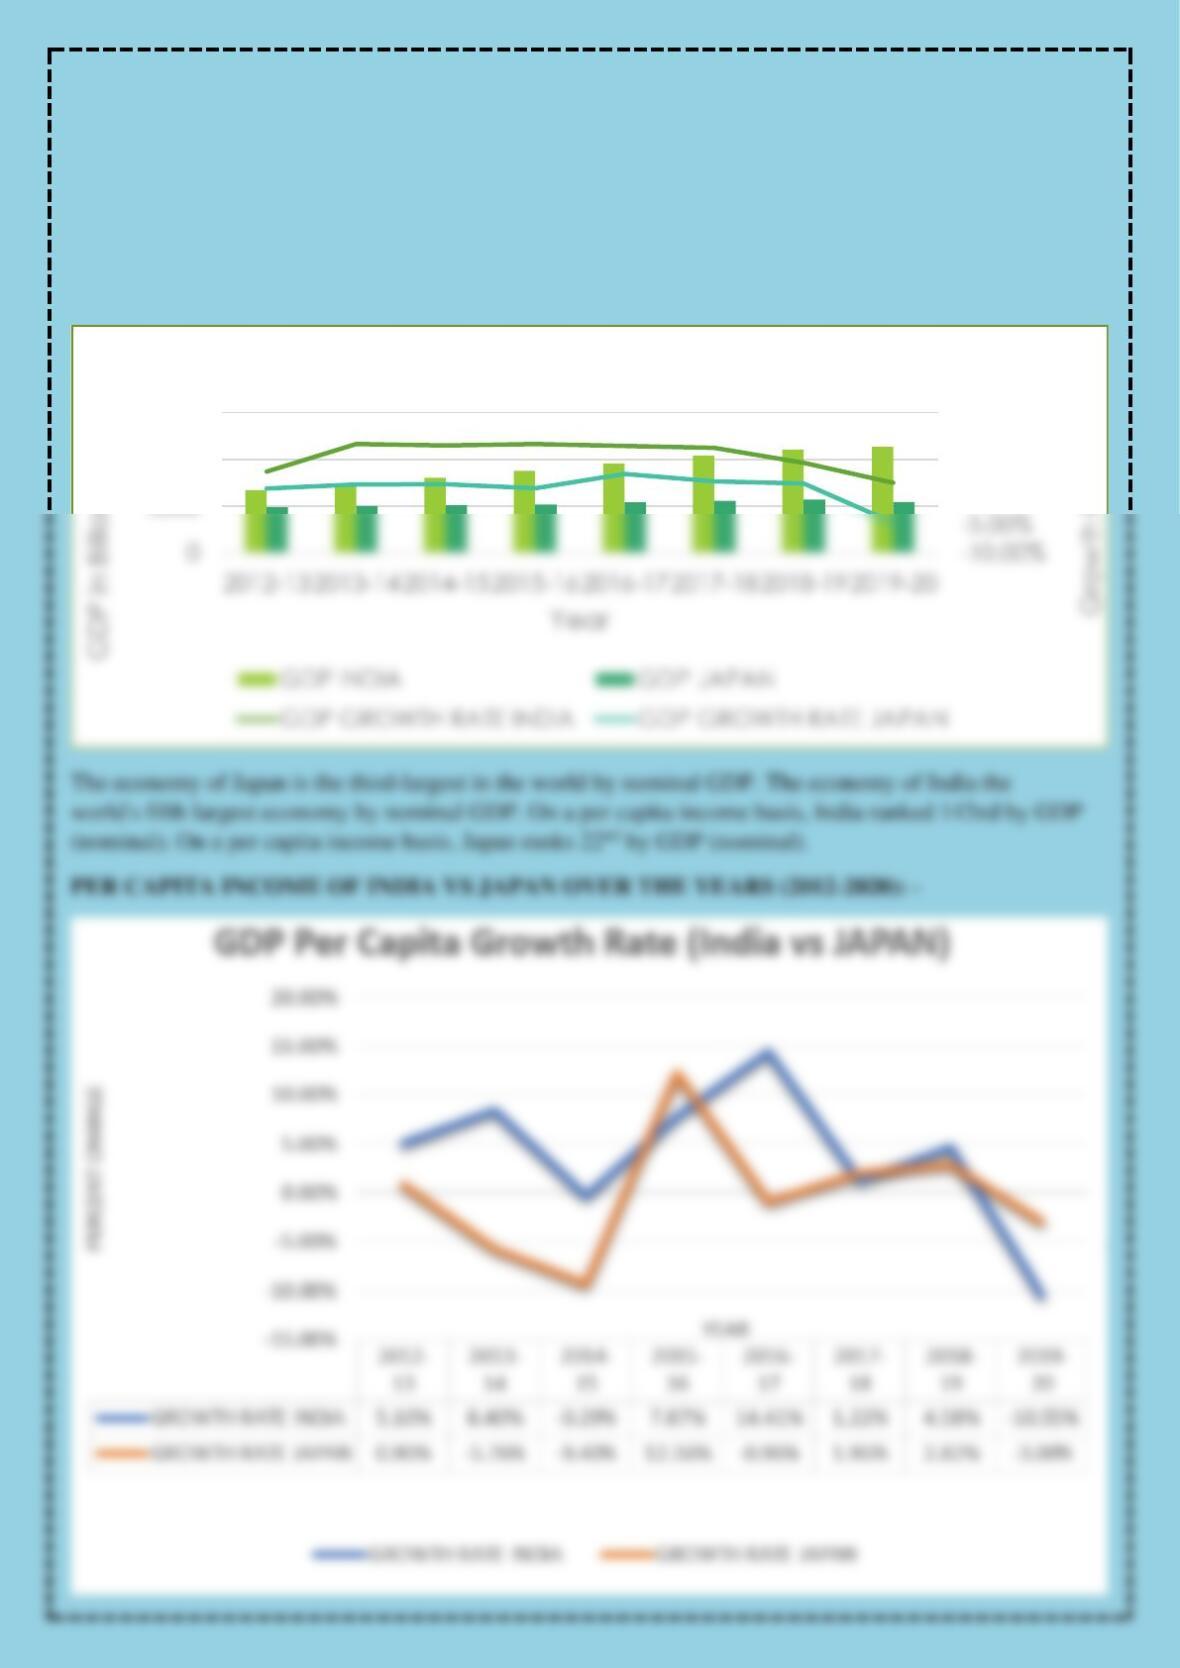
GDP OF INDIA AND JAPAN OVER YEARS (2012-2020): –
0.00%
5.00%
10.00%
15.00%
10000
15000
GDP Comparison