Caitlin Hendren
66461982
1
ECON105-17S2
Assignment 1
Final Word Count: 998 words
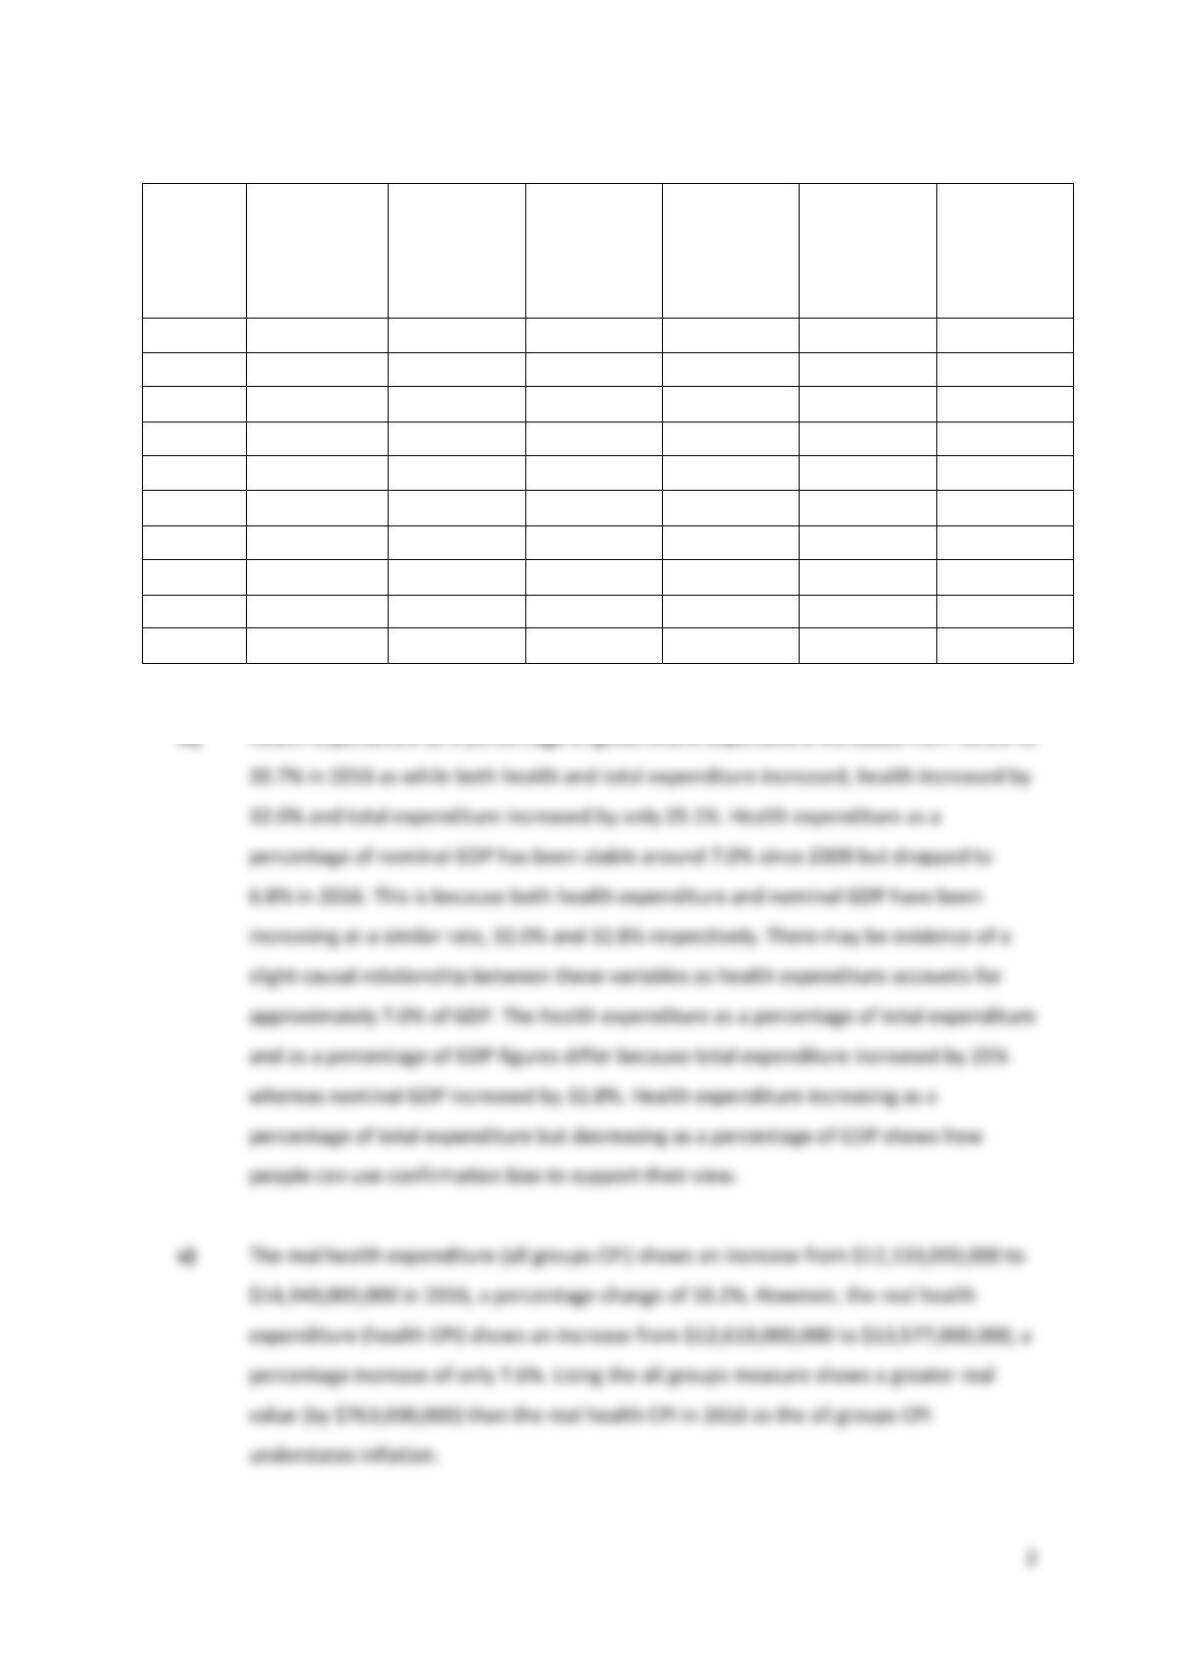
i)
ii) The nominal values of government health expenditure show consistent increases in
health spending from $13,058,000,000 in 2009 to $17,233,000,000 in 2016. This is a
32.0% increase over 8 years, averaging 4% each year. However as this is nominal data,
the increase could be due to an increasing quantity of healthcare, or increasing prices.
Using real values eliminates the effect of changing prices and only shows the increasing
quantity making the data comparable between periods. The real health expenditure
(health CPI) shows a smaller increase from $12,619,000,000 to $13,577,000,000, a 7.6%
change. As the nominal data showed a percentage increase of 32.0% and the real data
an increase of only 7.6%, it is evident that using nominal data can greatly distort the
trends as they include the effect of changing prices.
Year
Central Government
Expenses by Function
(Year Ended June)
Nominal GDP-
Production
Measure (Year
Ended March)
CPI (mean for year
ended June) June 2006=
1000
Estimated
Resident
Population
(1)
(2)
(3)
(4)
(5)
(6)
Total
Health
All
Groups
Health Sub-
group
2009
66657
13058
189618
1076
1035
4298000
2010
69711
13679
194251
1096
1074
4348200
2011
85381
14195
203433
1138
1139
4383200
2012
76087
14846
213239
1163
1175
4407300
2013
76901
15657
217472
1173
1212
4439000
2014
78678
16293
232324
1191
1244
4502900
2015
81060
16785
241926
1198
1267
4587900
2016
83377
17233
251767
1202
1269
4684500
Caitlin Hendren
66461982
iii)
Year
Health as a
% total of
Government
Expenditure
Health
Expenditure
as a % of
Nominal
GDP
Real Health
Expenditure
(All Groups
CPI)
Real Health
Expenditure
(Health CPI)
Real Health
Expenditure
(All Groups
CPI) per
capita
Real Health
Expenditure
(Health CPI)
per capita
Percent
Percent
($m)
($m)
($)
($)
(1)
(2)
(3)
(4)
(5)
(6)
2009
19.6%
6.9%
12133
12619
2823
2936
2010
19.6%
7.0%
12481
12742
2870
2931
2011
16.6%
7.0%
12476
12468
2846
2845
2012
19.5%
7.0%
12765
12632
2896
2866
2013
20.4%
7.2%
13354
12916
3008
2910
2014
20.7%
7.0%
13686
13100
3039
2909
2015
20.7%
6.9%
14014
13245
3055
2887
2016
20.7%
6.8%
14340
13577
3061
2898