ECON 1500 Economic Statistics
Homework 1 Fall 2019
Due September 19, 2018 in class
1) Is it possible for a set of observations to be either a sample or a population? Give an
illustrative example.
Yes, it is possible for a set of observations to be either a sample or a population. This is because
whether a data set is viewed as a sample or a population is based on the scope of the study. For
example, if you wanted to observe the cancer rates for a particular town and were solely
interested in that town, then that would count as sample. However, if you were interested in the
whole of the United States, then this town would only count as a sample of the population of the
United States of America.
2.THE NEXT QUESTIONS ARE BASED ON THE FOLLOWING INFORMATION:
The data presented below were collected on the amount of time, in hours; it takes an
employee, to process an order at a local plumbing wholesaler.
2.8
4.9
0.5
13.2
14.2
8.9
3.7
15.2
11.2
13.4
5.5
10.2
1.1
14.2
7.8
4.5
10.9
8.8
18.2
17.1
2a) Construct a frequency distribution of the data.
Time(in hours)
Frequency
0 but < 3.5
3
3.5 but < 6.5
4
6.5 but < 9.5
3
9.5 but < 12.5
3
12.5 but < 15.5
5
15.5 but < 18.5
2
2b) Construct cumulative frequency and cumulative percent distributions of the data.
Time(in hours)
Frequency
Cumulative Frequency
Cumulative Percent
0 but < 3.5
3
3
15
3.5 but < 6.5
4
7
35
6.5 but < 9.5
3
10
50
9.5 but < 12.5
3
13
65
12.5 but < 15.5
5
18
90
15.5 but < 18.5
2
20
100
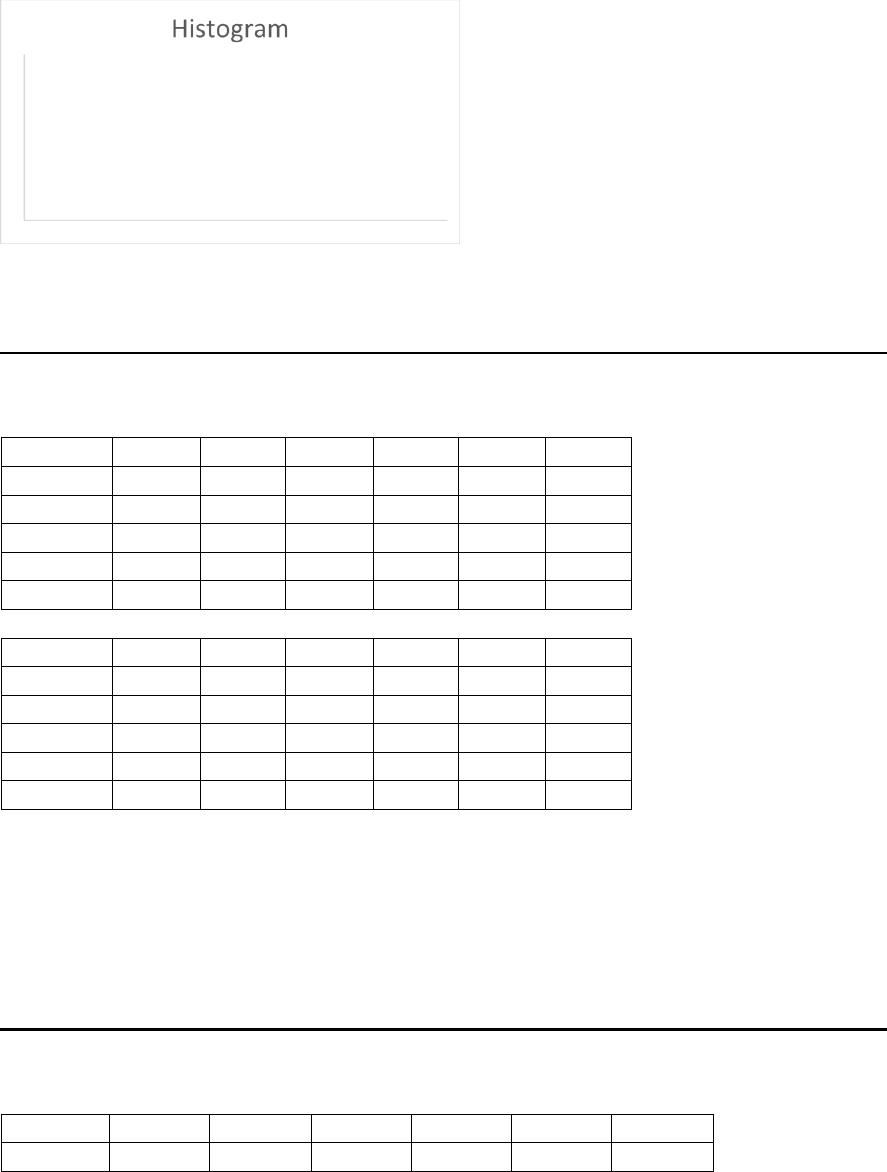
2c) Construct a frequency histogram of the data.
2d) Determine the percentage of time it takes an employee at most 12.5 hours to process an
order at the plumbing wholesaler.
90%.
3. THE NEXT QUESTIONS ARE BASED ON THE FOLLOWING INFORMATION:
A statistics professor has developed the cross table presented below, that compares
students’ class standing with their final grades.
Year
A
B
C
D
F
Total
Freshman
13
17
28
8
3
69
Sophomore
14
23
17
10
1
65
Junior
17
19
10
2
1
49
Senior
5
8
4
0
0
17
Total
49
67
59
20
5
200
Year
A
B
C
D
F
Total
Freshman
13
17
28
8
3
34.5%
Sophomore
14
23
17
10
1
32.5%
Junior
17
19
10
2
1
24.5%
Senior
5
8
4
0
0
8.5%
Total
24.5%
33.5%
29.5%
10%
2.5%
100%
3a) Calculate the missing values identified by asterisks. What patterns do you see in this
table?
It seems that, generally, the older the student, the better the grade they will get.
3b) Convert the data to overall percentages. What patterns do you see in this table?
The Freshman make up the biggest portion of the class. The Majority of grades are between a B
and a C.
4. THE NEXT QUESTIONS ARE BASED ON THE FOLLOWING INFORMATION:
The final-inspection defect report for an assembly line is reported on the table and Pareto
diagram as shown below:
Defect
Blemish
Scratch
Chip
Bend
Dent
Others
Count
61
50
28
17
13
11
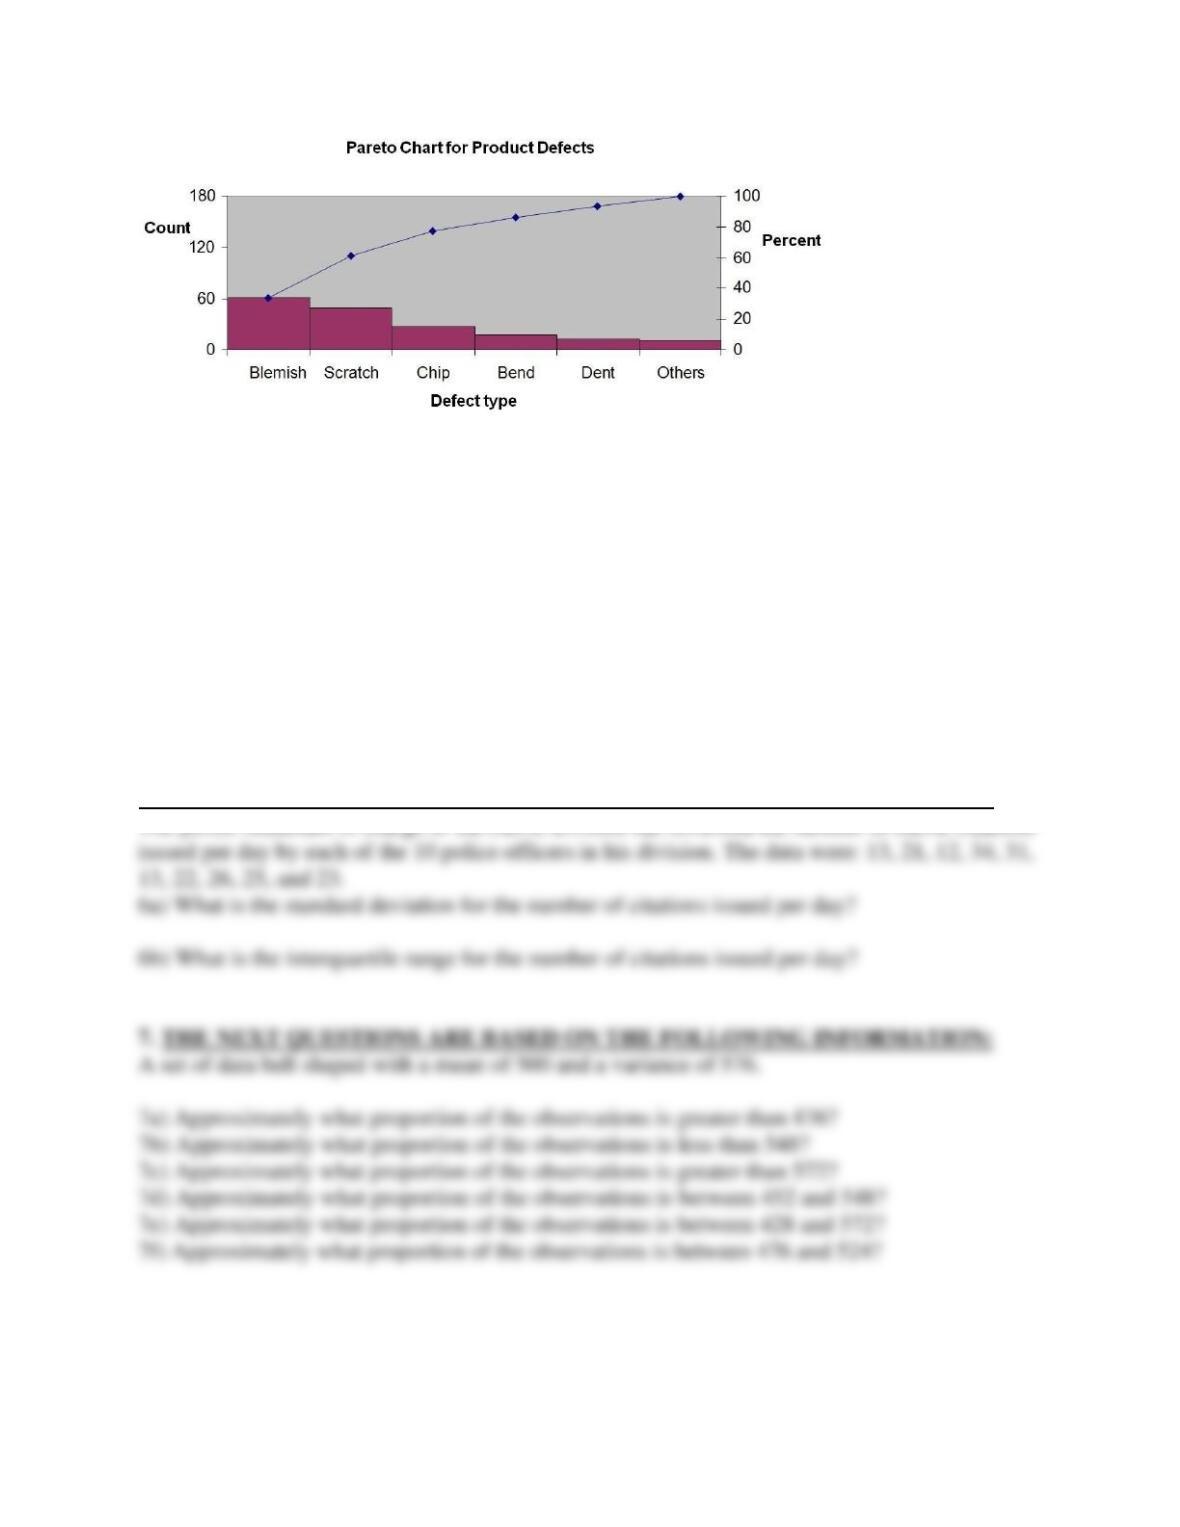
4a) What is the total defect count in the report?
180.
4b) Find the percentage for “chip” defect items.
28/180 * 100% = 15.5%
4c) Find the cumulative % through Bend, and explain what that value means.
(61+50+28+17)/180 * 100% = 86.7%. This means that 86.7% of the defects are due to
blemishes, scratches, chips and bends.
5) The management at a small manufacturing plant has noticed that the price of steel has
increased significantly over the past several years. Looking over their records, they find
that over the four-year period, prices have increased by 40%. They expect this same trend
in prices for next year. In budgeting for next year, by how much should they expect prices
to increase?
6. THE NEXT QUESTIONS ARE BASED ON THE FOLLOWING INFORMATION: