ECON-3010 – FINAL EXAM PRACTICE QUESTIONS:
• Multiple Choice Questions (20)
• T/F with explanation (4-5)
• short-answer questions with parts (3-4)
T/F with explanation.
1. According to the sticky-price model, other things being equal, the greater the
proportion, s, of firms that follow the sticky-price rule, the greater the decrease in
output in response to an unexpected price increase.
2. According to the sticky-price model, deviations of output from the natural level
are negatively related to the deviations of the price level from the expected price
level.
3. According to the imperfect-information model, when the price level rises and the
producer expects the price level to rise, the producer:
4. A central bank that chooses a small value of θ
π
, the responsiveness of nominal
interest rates to inflation, and a large value of θ
Y
, the responsiveness of nominal
interest rates to output, is choosing to obtain less output variability at the expense
of more inflation variability.
5. An ongoing unemployment insurance program is an example of a fiscal policy
that has no inside lag?
6. Keeping the money supply constant over the business cycle is an example of
passive monetary policy.
7. The inside lag is the time between a shock is recognized and the policy action
responding to the shock.
ANSWERs:
1. F 2. F 3. F. 4. T 5. T 6. T 7. T

SHORT-ANSWER/ANALYTICAL/PROBLEMS:
Q.1:
Derive the Phillips curve from a short-run aggregate supply curve given by
)(6
e
PPYY −+= and an estimate of Okun’s Law given by )(3
n
uuYY −−=− .
Q.2:
Suppose that short-run fluctuations in the economy are governed by a horizontal short-
run aggregate supply curve SRAS in which prices are fixed in the short run at
P
, a
vertical long-run aggregate supply curve where long-run output is
Y
and a simplified
downward sloping aggregate demand curve AD with a slope that is strictly between 0 and
∞
−
.
AD :
P
MV
Y= P for 0 < M; V; P < 1;
where M is nominal money balances and V is the velocity of money. Imagine two
different potential Federal Reserves. Suppose Fed A cares only about keeping the price
level stable at
P
in both the short run and in the long run. And suppose that Fed B cares
only about keeping output at its natural (long-run) level
Y
in both the short run and long
run. Each central bank’s only policy instrument with which to achieve its objective is to
change the money supply M, which shifts the aggregate demand curve AD.
(a) How would each Fed respond to an exogenous decrease in the velocity of
money (V)?
(b) How would each Fed respond to an exogenous increase in the price of oil
P
?
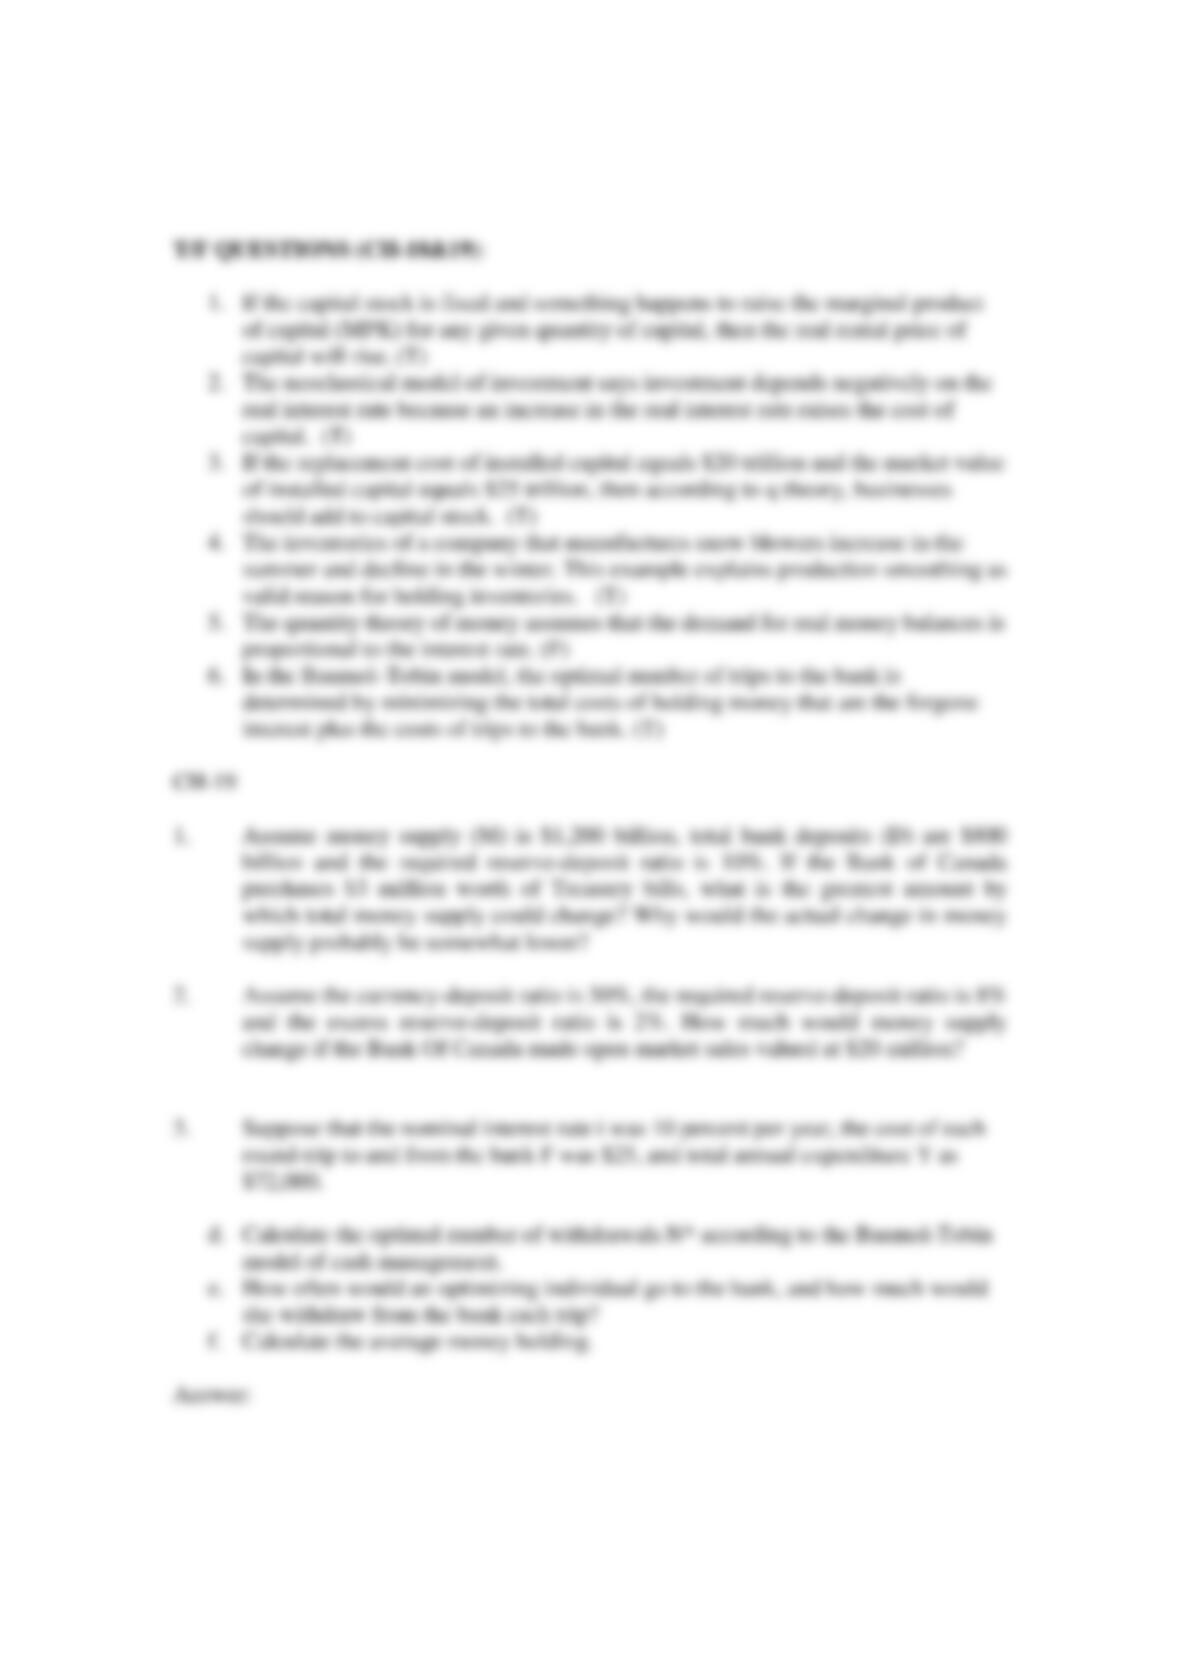
Q.3: Assume that an economy is initially at the natural rate of unemployment.
a.
Use a Phillips curve diagram to illustrate graphically how the inflation rate
and unemployment rate change both in the short ru
n and in the long run to an
unexpected expansionary monetary policy.
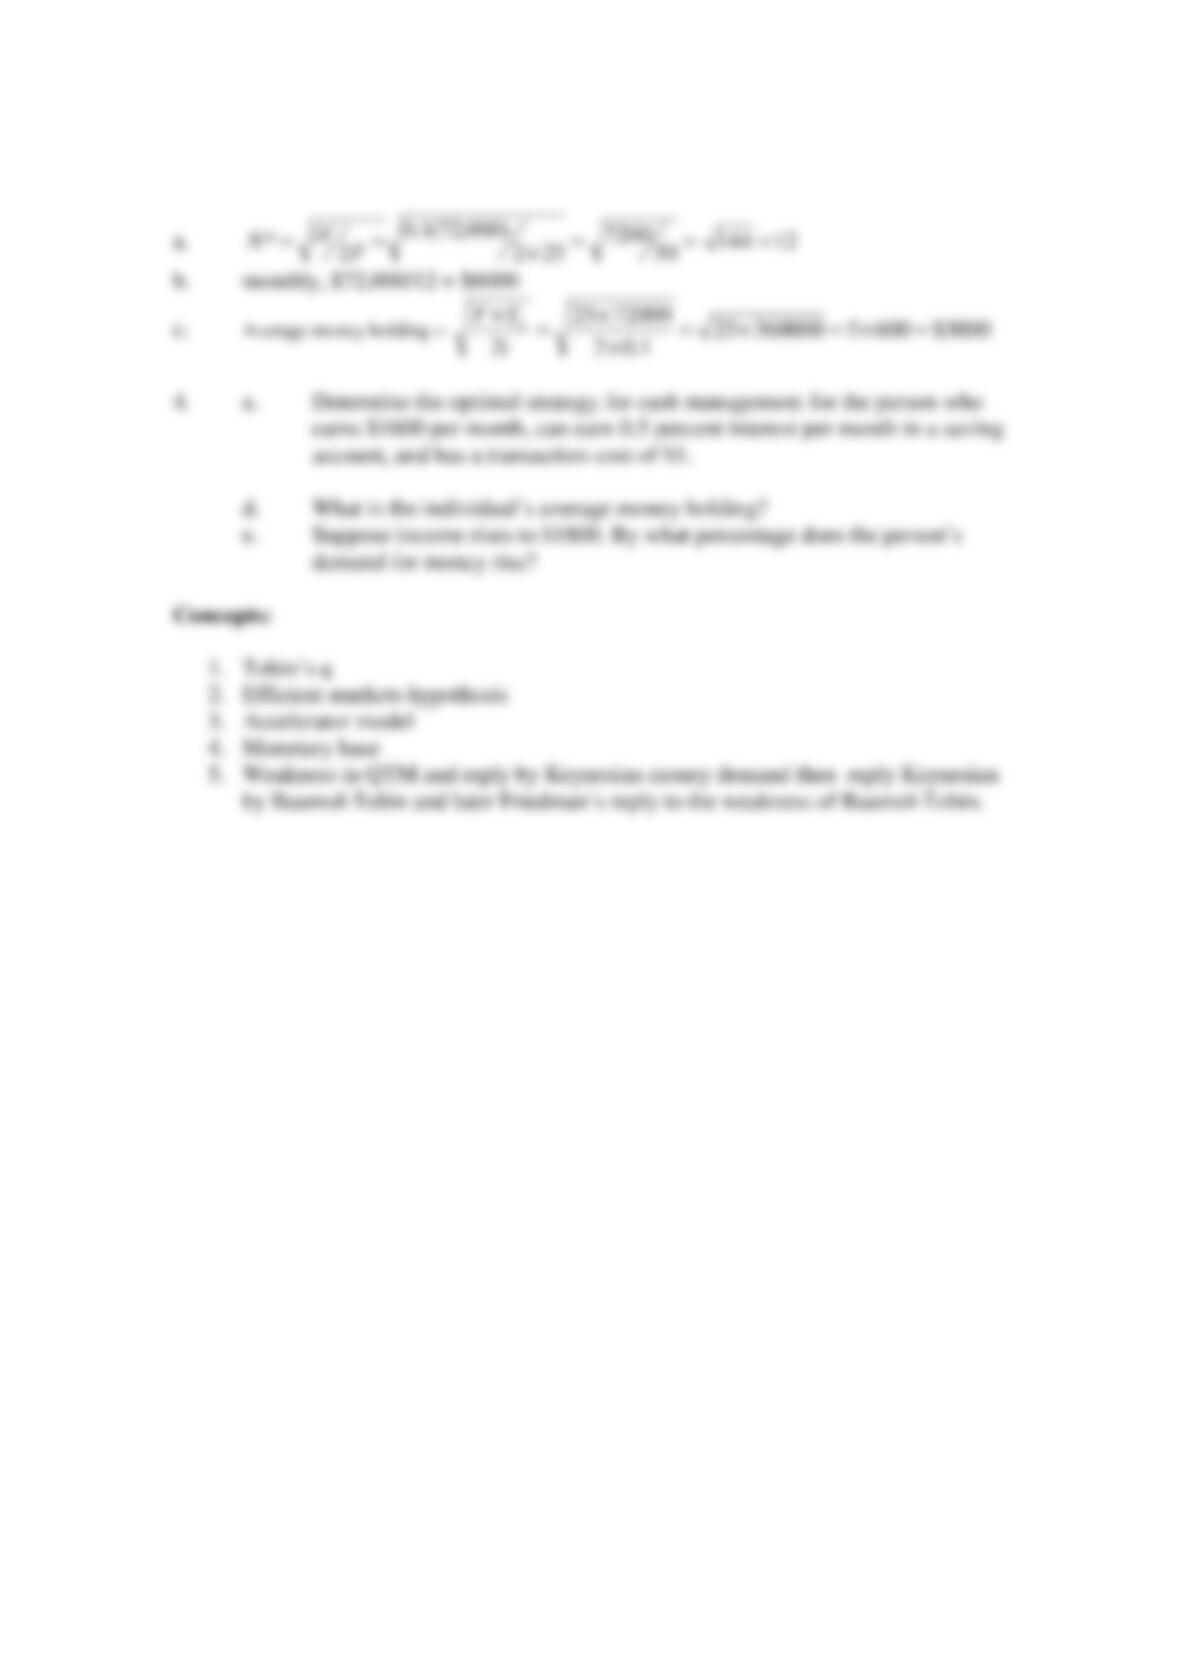
b.
Use a Phillips curve diagram to illustrate graphically how the inflation rate
and unemployment rate change both in the short run and in the long run to
the announcement of a credible
plan of expansionary monetary policy when
people have rational expectations.
Answer:
a)
In the short run, the inflation rate increases to π
2
and the unemployment falls to u
2
.
However, in the long run, the Phillips curve shifts upward to the right. The
unemployment rate returns to the natural rate, but with a higher rate of inflation than what
it was initially. There is a short-run tradeoff between inflation and unemployment.
b)
Since expectations are formed rationally and the policy is credible, the Phillips curve will
immediately shift upward to the right. In both the short run and the long run, the inflation
rate increases to π
2
, but the unemployment rate remains at u
n
. There is no short-run
tradeoff between inflation and unemployment in the short run or in the long run.
Q.4:
Assume that people form expectations rationally and that the sticky-price model
describes the aggregate supply curve in the economy. For each of the following scenarios,
explain whether or not monetary policy can have real effects on the economy:
a. The central bank determines monetary policy us
ing the same information available to all
firms and at the same time firms are setting prices, so both firms and policymakers have the
same information.
b.
The central bank determines monetary policy after firms have set prices using information
not available at the time prices were set.
Answer:
a.
The aggregate supply curve implies that the central bank can only cause output to deviate
from the natural level and have an impact on real variables if it can change (P – EP
).
Therefore, only unexpected chan
ges in monetary policy can change output. If firms have
access to all information when they form expectations, then they have already taken into
account the anticipated effect of monetary policy, and the expected monetary policy cannot
have real effects on the economy.
b.
If the central bank sets monetary policy after all firms have formed expectations, then
monetary policy can have real effects on the economy by changing the price level. As a
result the actual price level will deviate from the expected p
rice level, which was already
set, and the level of output will deviate from the natural level, a real change in the economy.
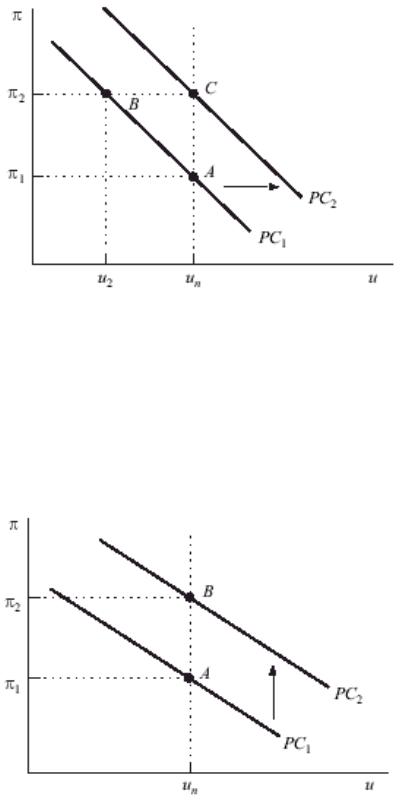
Q.5:
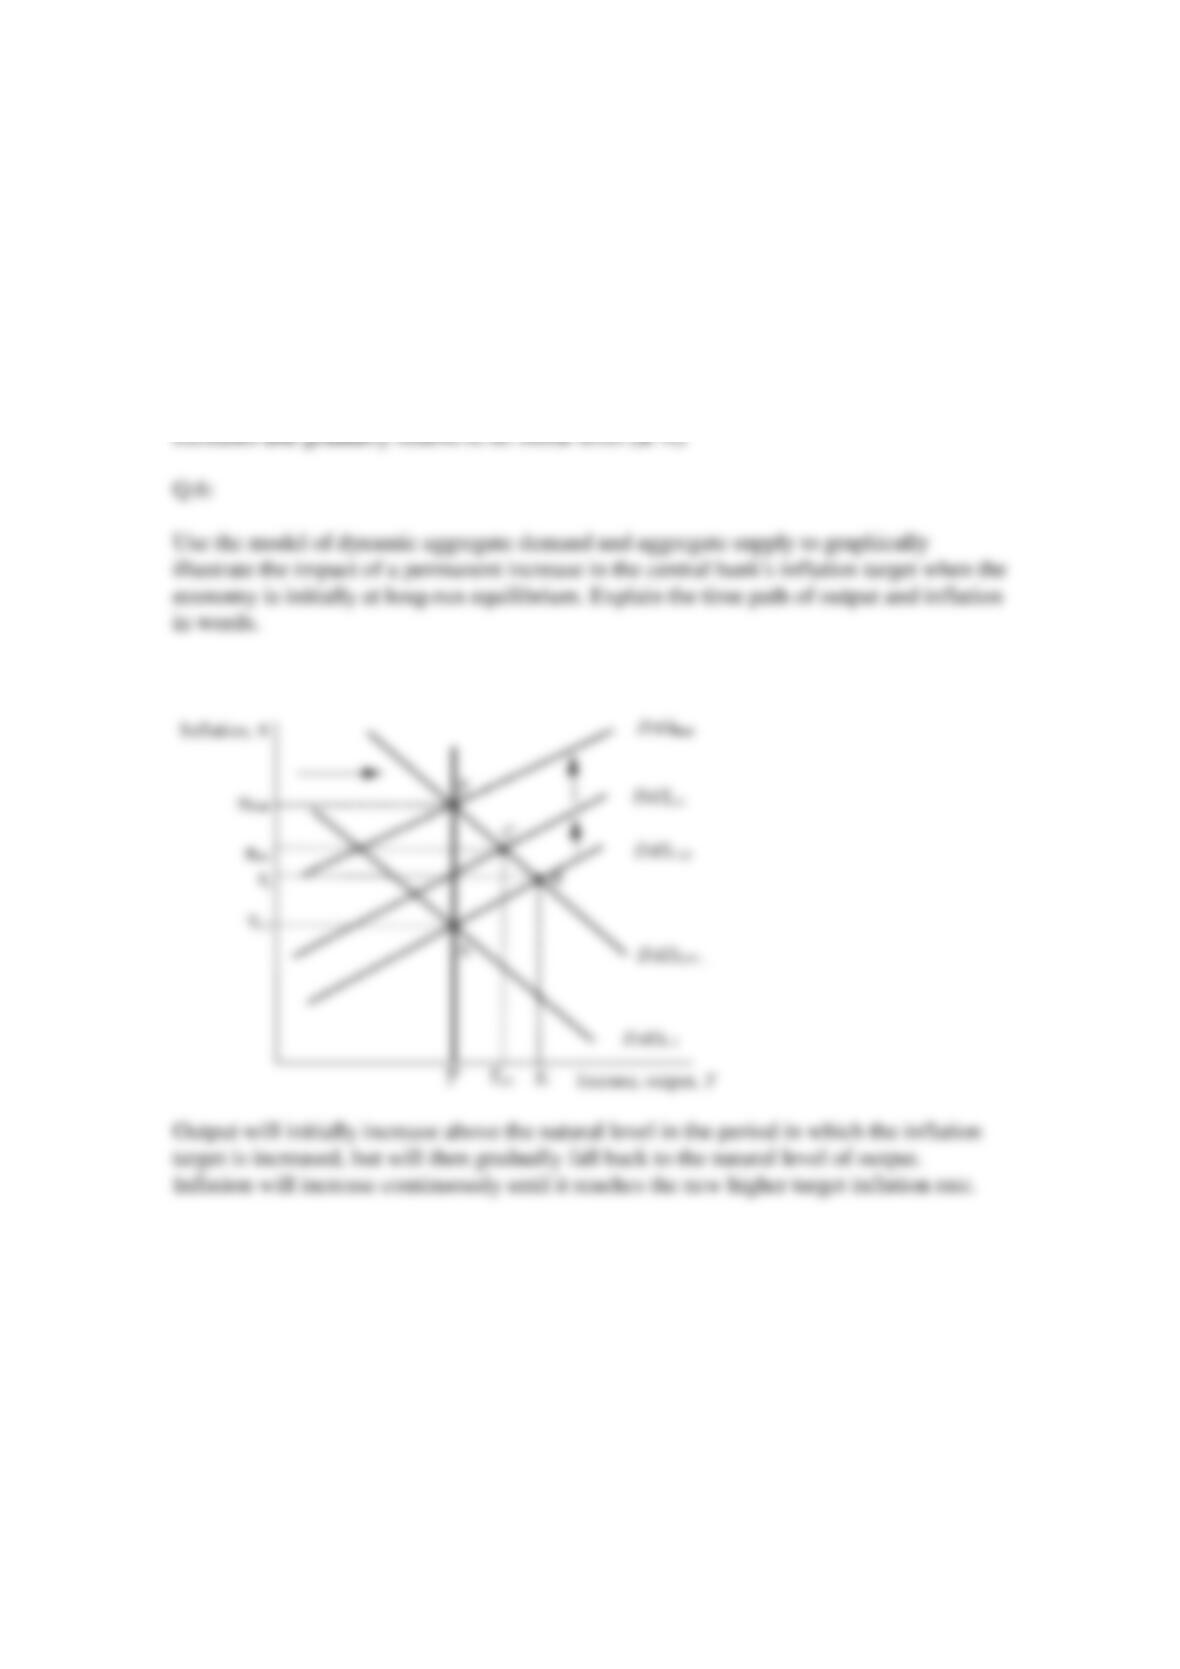
Use the model of dynamic aggregate demand and aggregate supply to graphically
illustrate the impact of a temporary four-period increase in taxes (a four-period negative
demand shock) on output and inflation when the economy is initially at long-run
equilibrium. Explain the time path of output and inflation in words.
Answer:
Beginning at A in period t – 1, output falls below the natural level in period t (to B) and
then gradually moves back toward the natural level in periods t + 1, t + 2, and t + 3 (to C).
In period t + 4, when the demand shock ends and the DAD returns to its original position,
output moves above the natural rate (to D), because the DAS in period t + 4 continues to
shift down as inflation expectations decrease as a result of lower inflation in the previous
period. Output then gradually returns to the natural level (at A) as the DAS shifts upward.
Beginning at A in period t – 1, inflation falls in period t and continues to fall through
period t + 3. In period t + 4, when the DAD returns to its original position, inflation