2.1
Supply and Demand
2.2
The Market Mechanism
2.3
Changes in Market Equilibrium
2.4
Elasticities
of Supply and Demand
2.5
Short-Run versus Long-Run
Elasticities
2.6
Understanding and Predicting the
Effects of Changing Market
Conditions
2.7
Effects of Government
Intervention—Price Controls
C H A P T E R 2
Prepared by:
Fernando Quijano, Illustrator
The Basics of Supply
and Demand CHAPTER OUTLINE

1
•
Understanding and predicting how changing world economic conditions
affect market price and production
•
Evaluating the impact of government price controls, minimum wages, price
supports, and production incentives
•
Determining how taxes, subsidies, tariffs, and import quotas affect
consumers and producers
Supply-demand analysis is a fundamental and powerful tool that can be applied
to a wide variety of interesting and important problems. To name
a few:
2
The Supply Curve
●supply curve Relationship between the quantity of a good that producers
are willing to sell and the price of the good.
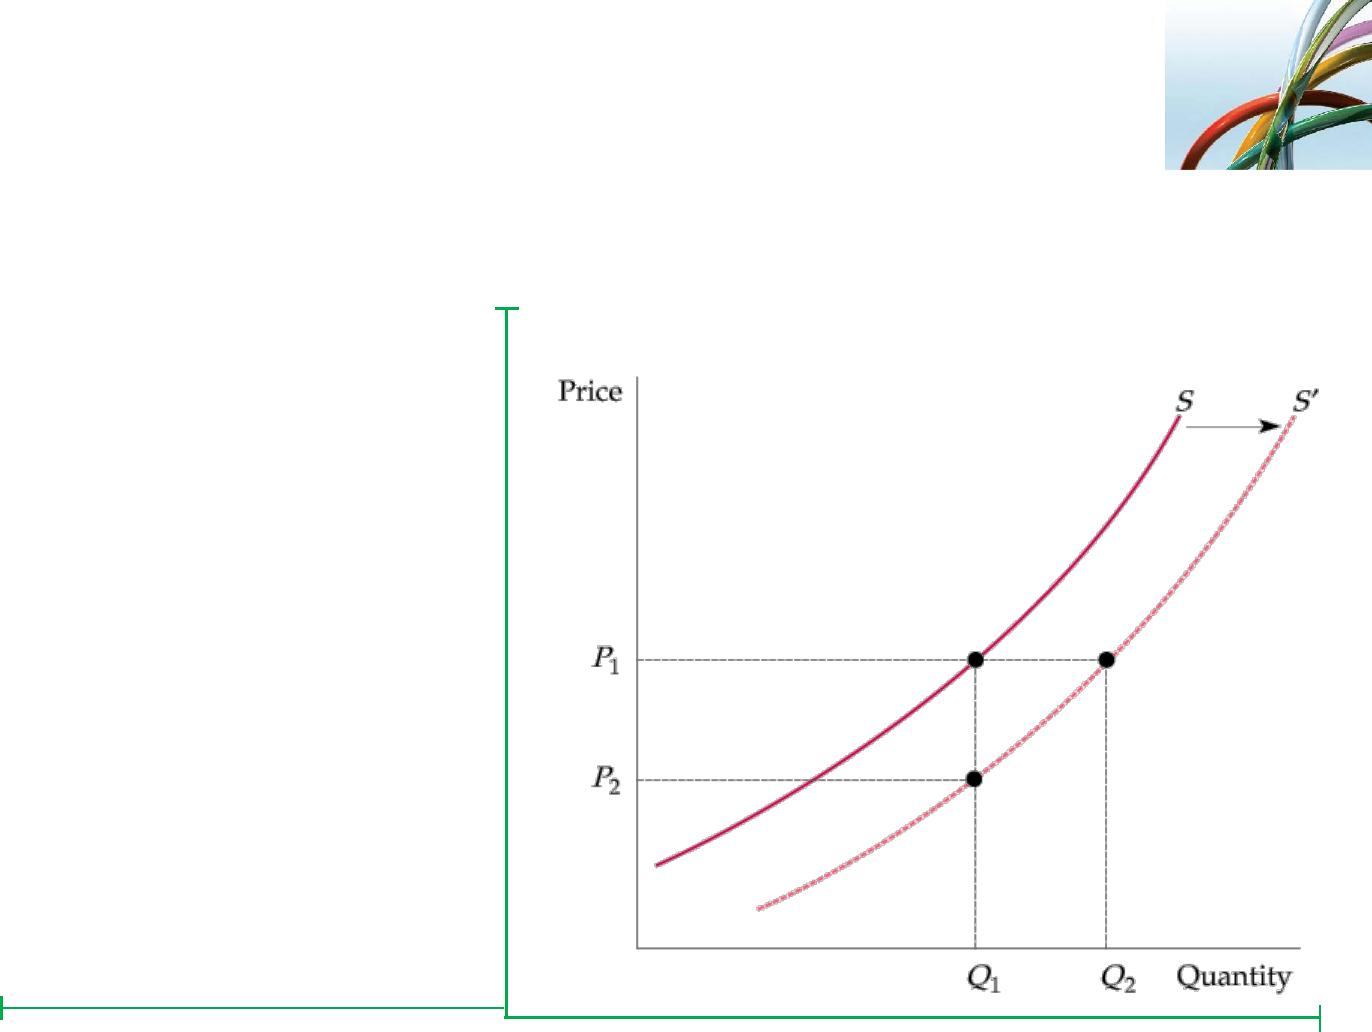
THE SUPPLY CURVE
The supply curve, labeled S in
the figure, shows how the
quantity of a good offered for
sale changes as the price of the
good changes. The supply curve
is upward sloping: The higher
the price, the more firms are
able and willing to produce and
sell.
If production costs fall, firms can
produce the same quantity at a
lower price or a larger quantity at
the same price. The supply
curve then shifts to the right
(from S to S’).
FIGURE 2.1
Supply and Demand
2.1
QS
= QS
(P)

3
OTHER VARIABLES THAT AFFECT SUPPLY
The quantity that producers are willing to sell depends not only
on the price
they receive but also on their production costs, including wages, interest
charges, and the costs of raw materials.
When production costs decrease, output increases no matter what the market
price happens to be. The entire supply curve thus shifts to the right.
Economists often use the phrase change in supply to refer to shifts in the
supply curve, while reserving the phrase change in the quantity supplied to
apply to movements along the supply curve.
4
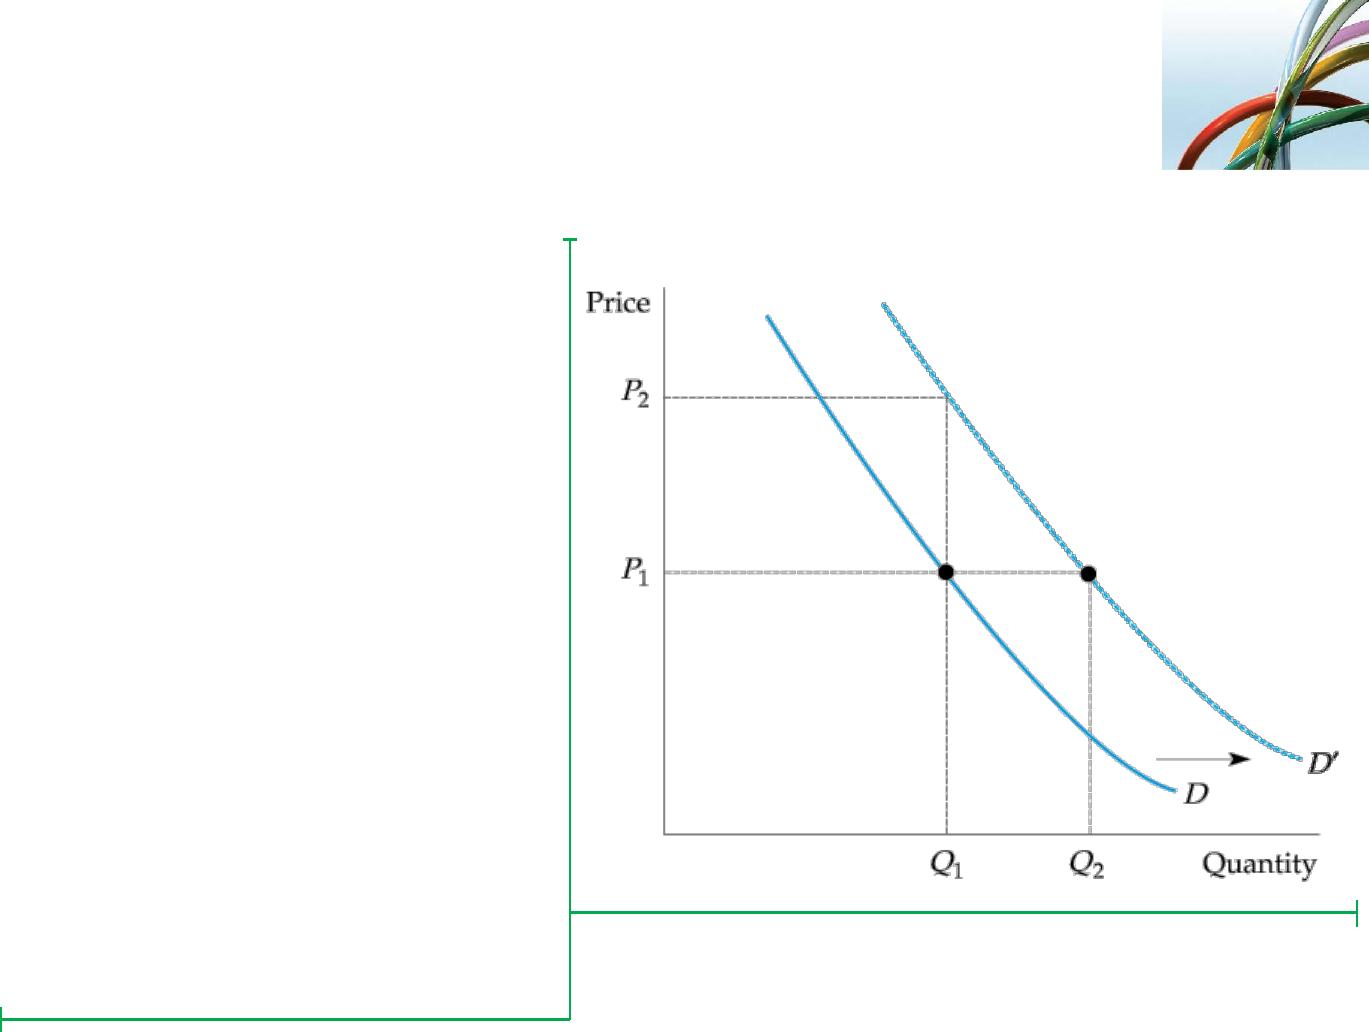
THE DEMAND CURVE
The demand curve, labeled D, shows
how the quantity of a good
demanded by consumers depends
on its price. The demand curve is
downward sloping; holding other
things equal, consumers will want to
purchase more of a good as its price
goes down.
The quantity demanded may also
depend on other variables, such as
income, the weather, and the prices
of other goods. For most products,
the quantity demanded increases
when income rises.
A higher income level shifts the
demand curve to the right (from D to
D’).
FIGURE 2.2
●demand curve Relationship between the quantity of a good that
consumers are willing to buy and the price of the good.
The Demand Curve
QD
= QD
(P)
5
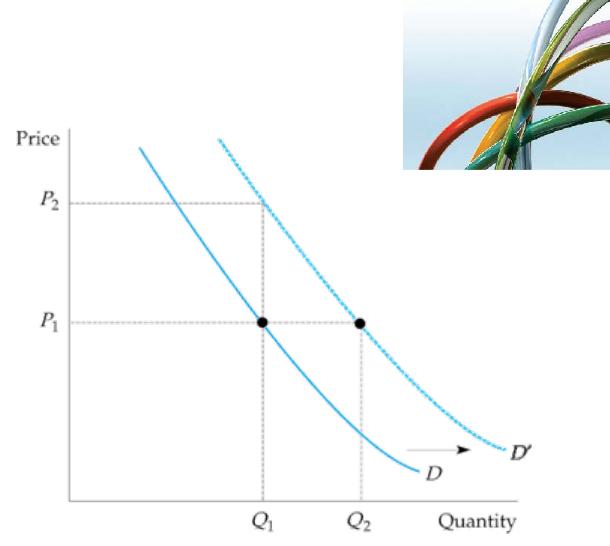
SHIFTING THE DEMAND CURVE
If the market price were held constant at P1
,
we would expect to see an increase in the
quantity demanded—say, from Q1
to Q2
, as a
result of consumers’
higher incomes.
Because this increase would occur no matter
what the market price, the result would be a
shift to the right of the entire demand curve.
SUBSTITUTE AND COMPLEMENTARY GOODS
●substitutes Two goods for which an increase in the price of one leads to
an increase in the quantity demanded of the other.
●complements Two goods for which an increase in the price of one leads to
a decrease in the quantity demanded of the other.
SUPPLY AND DEMAND
The market clears at price
P0
and quantity Q0
.
FIGURE 2.3
The Market Mechanism
2.2