ECN313 REPORT
Fall 2020
Econometrics Project
Charbel Bou Tanos

1
Contents:
1. Introduction …………………………………………………………………………………………………………………………………. 2
2. The variance-covariance: ……………………………………………………………………………………………………………. 3
3. The Fama and French Equation: ………………………………………………………………………………………………….. 4
4. Coefficients Significance Test: ……………………………………………………………………………………………………… 4
5. Confidence Intervals of the Coefficients: …………………………………………………………………………………………. 6
6. Significance of β2 and β3: ……………………………………………………………………………………………………………… 7
7. Is our portfolio Riskier than the market?. ……………………………………………………………………………………… 7
8. In-sample forecast…………….……………………………………..………………………….……………………………………………8
9. Correlation matrix ………………………………………………………………………………………………………………………………………..9
10. Graphing the square of errors and the Independent Variables………………………………………………………………….9
11. Dummy Variable………………………………………………………………………………………………………………………………………10
12. January Effect……………………………………………………………………………………………………………………………………………10

2
I. Introduction:
The Fama and French Three-Factor Model is an updated version of the Capital Asset Pricing
Model (CAPM) by adding to it the size risk and value risk factor. Fama and French was originally
tested on the three indexes NASDAQ, NYSE and AMEX by Daniel and Titman in 1996. Where they
found that there’s no relation between the expected return of the portfolio and the model’s return.
Later, Davis, come up with a contradictory result when he extended the previous work on the Fama
and French model. The model finally is given by the following:
(Rt – rft) = α + β1(Rmt – rft) + β2SMBt + β3HMLt + ∈t
Rt is the monthly return of the portfolio, Rm t is the S&P500 monthly return, rf t is the monthly return
of the US T-bills, SMB t is the small minus big; β3 is the sensitivity of the risk factor related to the
book-to-market, HML t: “high minus low”, β2 is the sensitivity of the risk factor related to the firm
size, SMB accounts for the spread in returns between small- and large-sized _firms (rms), which is
based on the company’s market capitalization. HML accounts for the spread in returns between value
and growth stocks. HML argues that companies with value stocks outperform those growth stocks.
Fama and French expectations are true if β2 and β3 are greater than zero.
Our main objective is to explain the accuracy of the “Fama and French model” by following
these steps: Run regressions and estimate Fama and French model after building an econometric
model of the cars’ industry portfolio. Calculation wise, the model will give us more accurate values of
the dependent than using the CAPM; by adding independent variables, R2 will increase each time.
First, we will discuss and analyze our findings. Initially, we will analyze the series and
estimate the model, then use a forecast to check the model’s accuracy. Also, we will test the
implemented model in recessions to see if there’s any January effect.
II. Findings:
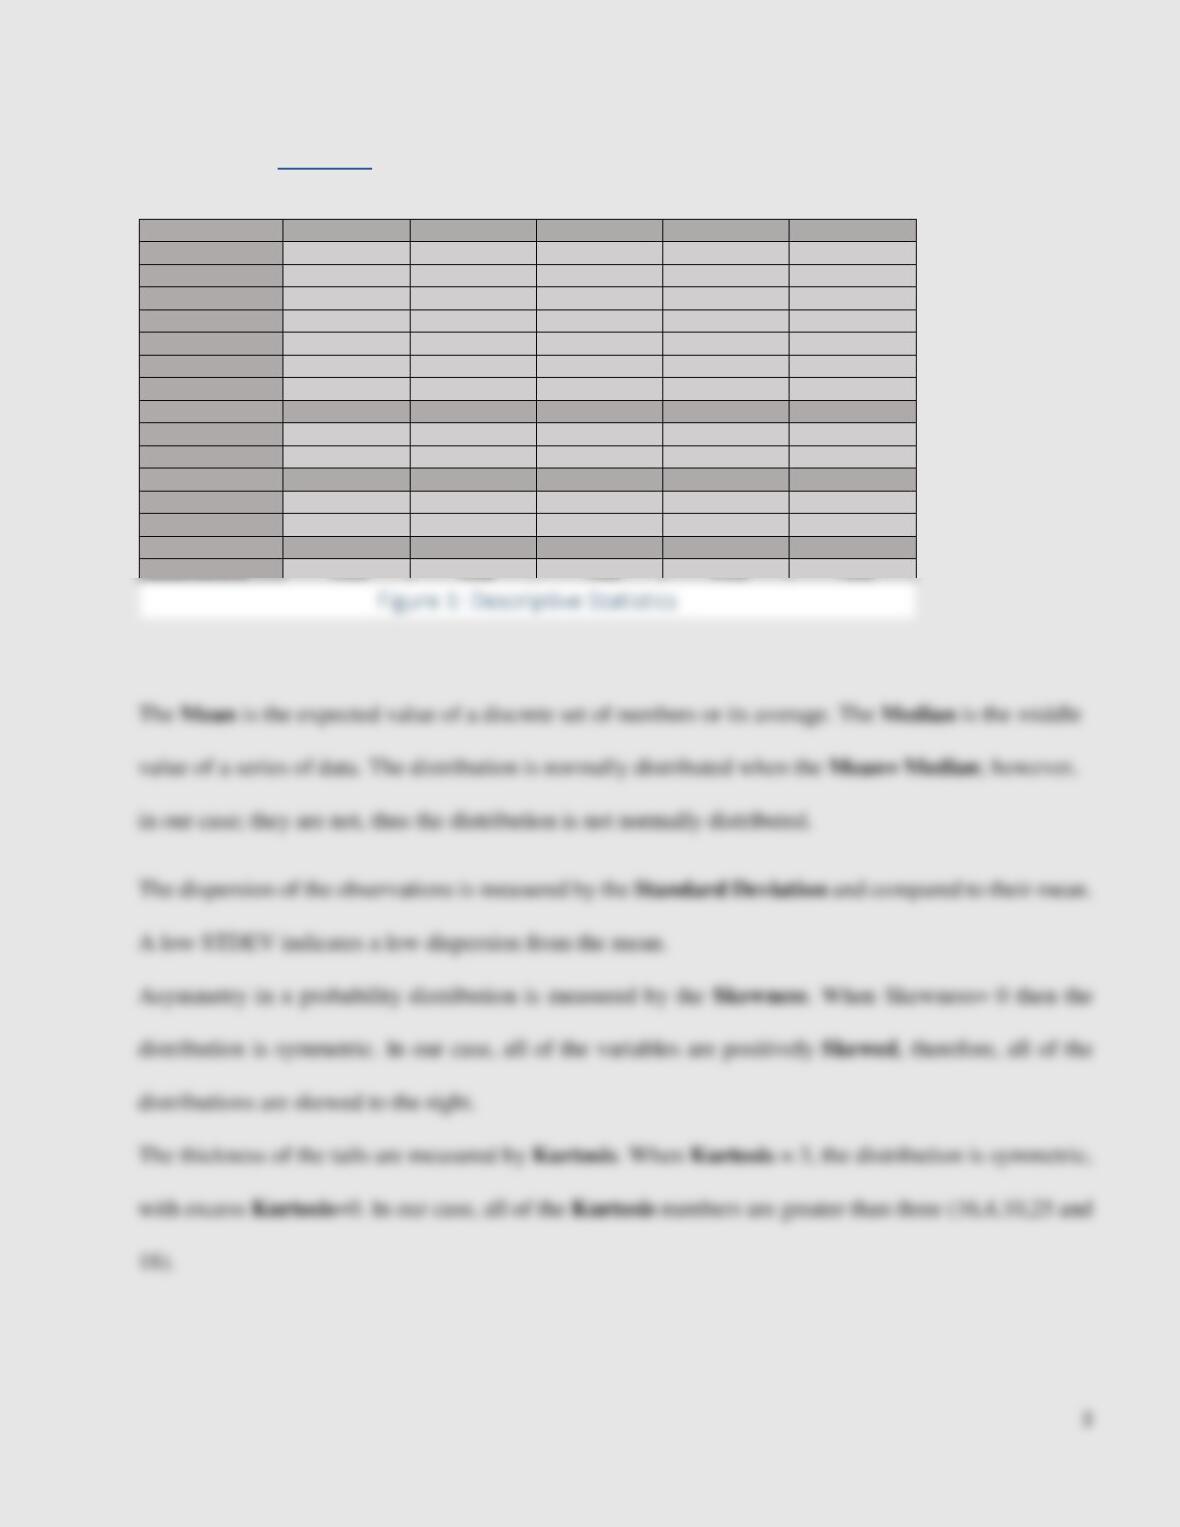
CARS
RF
MKT_RF
SMB
HML
Mean
1.119942
0.290588
0.626378
0.235780
0.386830
Median
1.035000
0.260000
1.010000
0.055000
0.220000
Maximum
80.48000
1.350000
37.77000
39.04000
35.48000
Minimum
-34.84000
-0.060000
-28.98000
-16.39000
-13.45000
Std. Dev.
7.869880
0.253452
5.423432
3.299852
3.548358
Skewness
1.094387
1.037667
0.166785
2.189939
1.840475
Kurtosis
16.18504
4.250272
10.32508
25.28960
18.74346
Jarque-Bera
7726.011
253.8860
2325.470
22317.42
11305.80
Probability
0.000000
0.000000
0.000000
0.000000
0.000000
Sum
1162.500
301.6300
650.1800
244.7400
401.5300
Sum Sq. Dev.
64226.61
66.61474
30501.92
11291.92
13056.71
Observations