Linear Regression Analysis on Net Income of an Agrochemical Company in
Bangkok,Thailand.
by
Jazmin Freeman
Gardner-Webb University
2019
Linear Regression Analysis on Net Income of an Agrochemical Company in Thailand.
1
Abstract:
The purpose of this research is to analyze the ABC Company’s data and verify whether the
regression analysis methods and models would work effectively in the ABC Company based in Bangkok,
Thailand. After the data are collected, models are created to examine the contribution of each of the
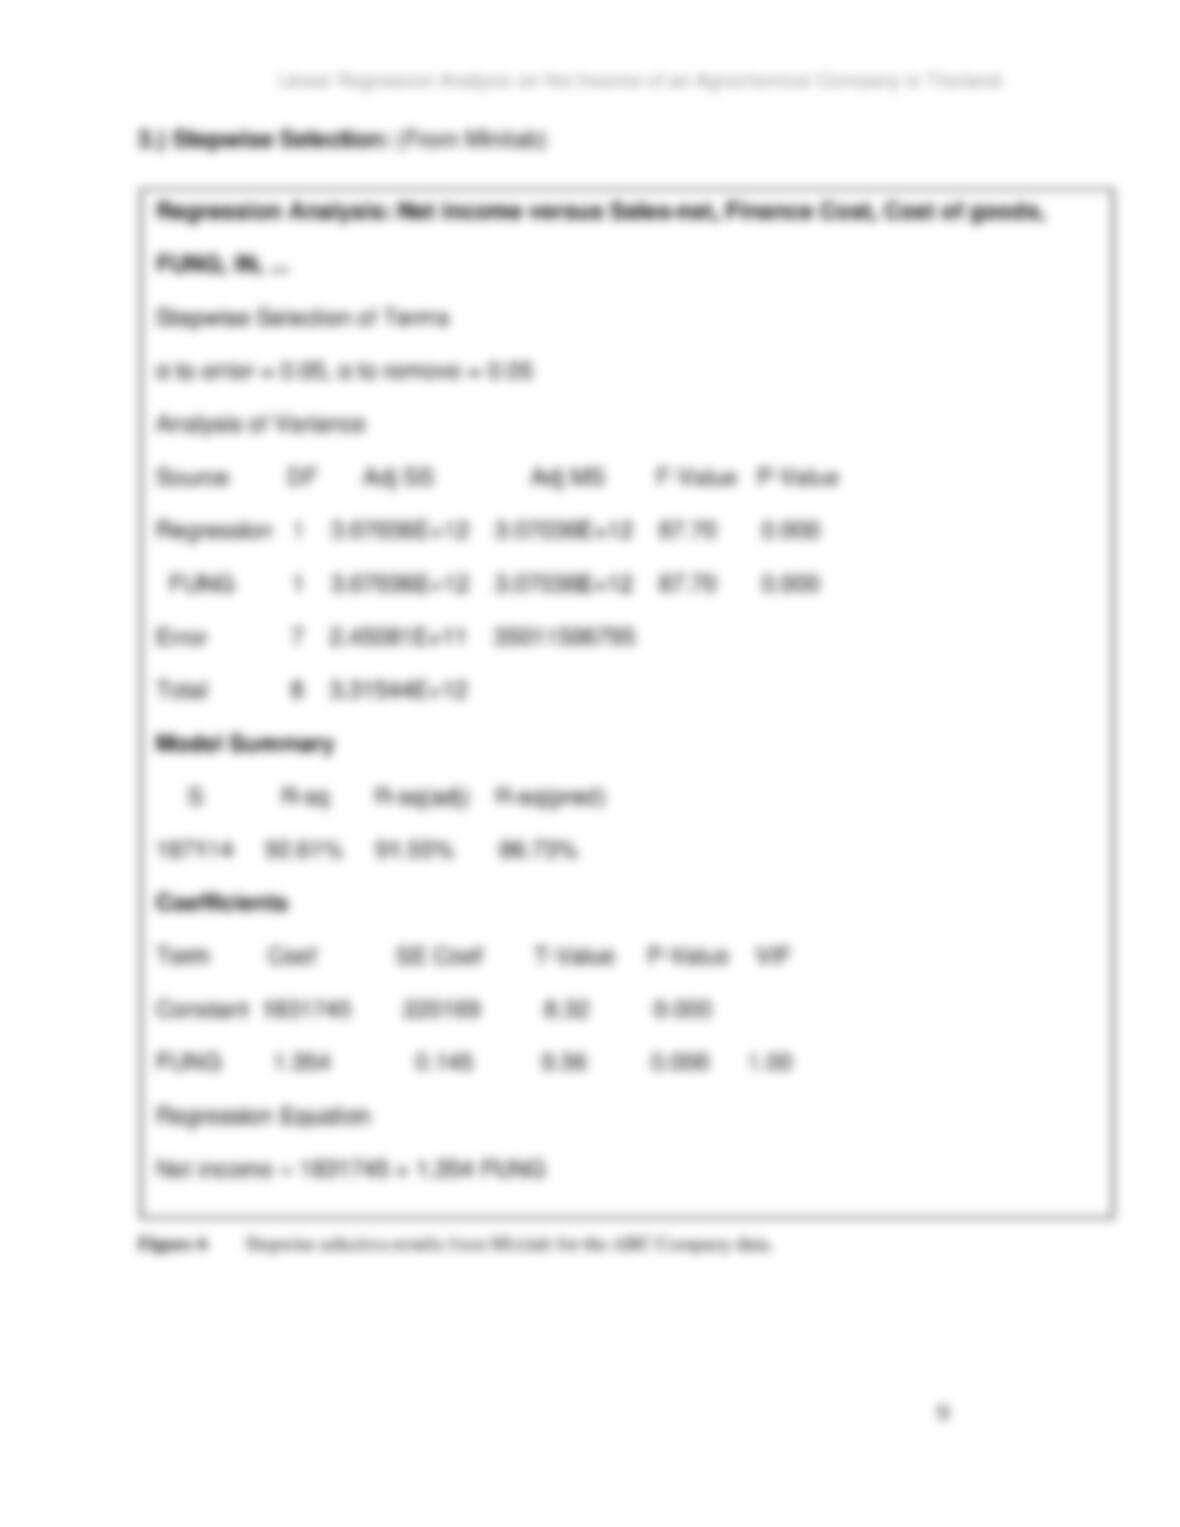
company’s financial factors to the net income of the company. The final model is selected using Stepwise
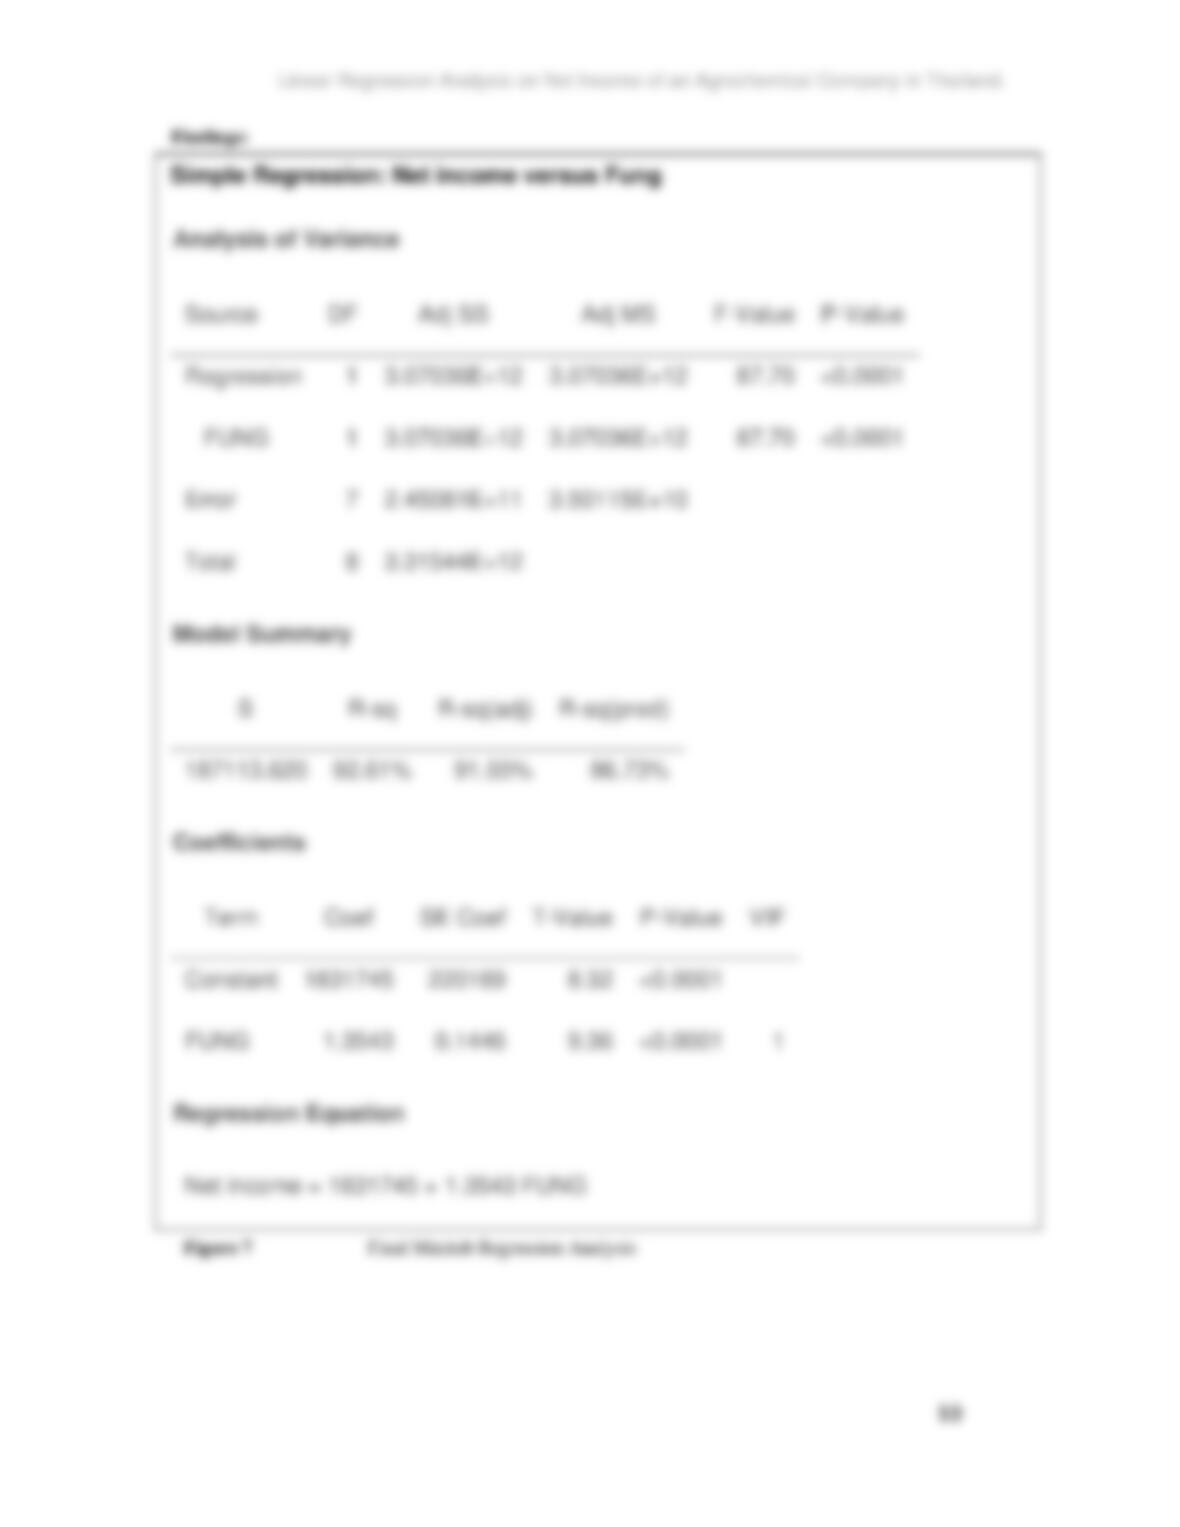
Regression Methods. A linear regression line and equation for the model are generated to help observe and
predict future trends. The model also shows which variables play the most important roles in the company’s
net income.
Linear Regression Analysis on Net Income of an Agrochemical Company in Thailand.
2
Introduction:
The purpose of this research is to analyze the ABC Company’s data of the past nine years and
verify whether the regression analysis methods and models studied and developed in the U.S. would work
effectively in ABC Company based in Bangkok, Thailand.
There are two main elements in this research that one should be familiar with. These elements
include some background information about the company and the statistically tools used in the analysis.
Agriculture has always played a major role in the economy of both
Thailand and all of Southeast Asia. Its exports are very successful internationally. As a result, many
businesses related to agriculture are booming there. Due to the fact that agricultural production is so large
there, innovations like chemical fertilizers, pesticides, and herbicides have been produced to protect the
plants as they grow and increase yields (Narakon, 2014). ABC Company is one of Thailand’s biggest
producers, importers, and distributors of pesticides and fertilizers. The company’s products can be
categorized into five main sections, which are fungicide, pesticide, herbicide, fertilizer, and others. The
company’s customers include Heinz Thailand for their tomato farm, Lay’s for their potato farm, as well as
other dealers in Thailand (Sun, 2014).
In order to understand this research, one should be familiar with the materials used in the analysis.
The following statistical tools and techniques are used in the analysis.
Regression analysis:
Regression analysis is a technique used in statistics for investigating and modeling the
relationship between variables (Douglas Montgomery, Peck, &
(Douglas Montgomery, Peck, & Vinning, 2012).
Statistical Hypothesis:
Statistical hypothesis are statements about relationships. The statistical hypothesis testing is the
use of statistics to determine the probability that a given hypothesis is true (Iyanaga& Kawada, 1980). The
null hypothesis is denoted by H0. The alternative hypothesis is the negation of the null hypothesis, denoted
by
H1 or Ha (Wyllys, 2003).

Linear Regression Analysis on Net Income of an Agrochemical Company in Thailand.
3
Testing Significance of Regression:
H0: β1 = β2 =…= βk = 0
H1 : at least one βi ≠ 0
The hypotheses are related to the significance of regression. Failing to reject H0 implies that there
is no linear relationship between x and y. On the other hand, if H0 is rejected, it implies that at least one βi
show a significant relationship to y (Douglas Montgomery, Peck, & Vinning, 2012).
F-test: An F-test is a statistical test in which the test statistic is based on the Fdistribution under the null
hypothesis. It is most often used when comparing statistical models that have been fitted to a data set, in
order to identify the model that best fits the population from which the data were sampled. In this research,
the F-test is used to test the significance of the model.
The test statistics F0 can be computed by !!““!!“# follows the Fk,n-k-1 distribution. Reject H0 , if
F0 > Fk,n-k-1. The test statistic F0 can usually be obtained from the ANOVA table (Experiment Design and
Analysis Reference, n.d.).
Test on Individual Regression Coefficients (t Test):
The t-test is used to check the significance of individual regression coefficients in the multiple
linear regression model. Adding a significant variable to a regression model makes the model more
effective, while adding an unimportant variable may make the model worse. The hypothesis statements to
test the significance of a particular regression coefficient, βj , are:
H0: βj = 0
H1 : βj ≠ 0
The test statistic for this test has the t-distribution:
T0 = !”!(!! !)
where the standard error, 𝑠𝑒(β j), is obtained. One would fail to reject the null hypothesis if the
test statistic lies in the acceptance region:
-tα/2, n-2 < T0 < tα/2, n-2
Linear Regression Analysis on Net Income of an Agrochemical Company in Thailand.
This test measures the contribution of a variable while some other variables are included in the
model (Experiment Design and Analysis Reference, n.d.).
P-value:
P-value or calculated probability is the estimated probability of rejecting the null hypothesis (H0)
of a study question when that hypothesis is true.
VIF:
VIF (the variance inflation factor) for each term in the model measures the combined effect of the
dependences among the regressors on the variance of the term. Practical experience indicates that if any of
the VIFs exceeds 5 or 10, it is an indication that the associated regression coefficients are poorly estimated
because of multicollinearity (Douglas Montgomery, Peck, & Vinning, 2012).
Model Selection:
Stepwise Regression Methods is an approach to selecting a subset of effects for a regression