CECN 603 Session 10
Topics: Aggregate Supply and Aggregate Demand
Readings: PB Ch 26
Announcement:
• Note that the topics covered for the semester stated in the course outline have been
adjusted and the updated schedule for the remaining periods as follows:
• Lecture 10: Aggregate Supply and Aggregate Demand
• Lecture 11: Inflation and Unemployment in Canada
• Lecture 12: Fiscal and Monetary Policy
After studying this topic, you will be able to:
• Explain what determines aggregate supply
• Explain what determines aggregate demand
• Explain what determines real GDP and the price level and how economic growth, inflation,
and the business cycle arise
• Describe the main schools of thought in macroeconomics today
Aggregate Supply
Quantity Supplied and Supply
• The quantity of real GDP supplied is the total quantity that firms plan to produce during a
given period.
• Aggregate supply is the relationship between the quantity of real GDP supplied and the
price level.
• We distinguish two time frames associated with different states of the labour market:
Long–run aggregate supply
Short–run aggregate supply
Long–Run Aggregate Supply
• Long–run aggregate supply is the relationship between the quantity of real GDP supplied
and the price level when real GDP equals potential GDP.
• Potential GDP is independent of the price level.
• So the long–run aggregate supply curve (LAS) is vertical at potential GDP.
Page 1 of 13
Short–Run Aggregate Supply
• Short–run aggregate supply is the relationship between the quantity of real GDP supplied
and the price level when the money wage rate, the prices of other resources, and
potential GDP remain constant.
• A rise in the price level with no change in the money wage rate and other factor prices
increases the quantity of real GDP supplied.
• The short–run aggregate supply curve (SAS) is upward sloping.
LR and SR Aggregate Supply
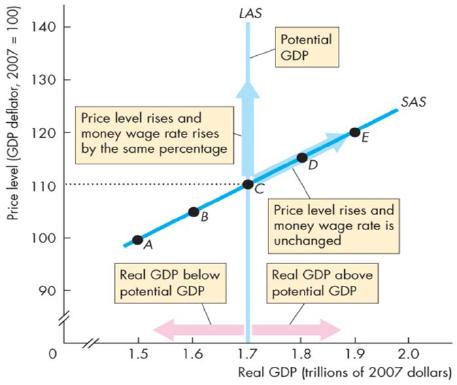
• The figure below shows the LAS curve.
• In the long run, the quantity of real GDP supplied is potential GDP.
• As the price level rises and the money wage rate changes by the same percentage, the
quantity of real GDP supplied remains at potential GDP.
• In the short run, the quantity of real GDP supplied increases if the price level rises.
• The SAS curve slopes upward.
• A rise in the price level with no change in the money wage rate induces firms to increase
production.
• With a given money wage rate, the SAS curve cuts the LAS curve at potential GDP.
• The price level is 110.
• With the given money wage rate, as the price level falls below 110 ...
• the quantity of real GDP supplied decreases along the SAS curve.
• With the given money wage rate, as the price level rises above 110 …
• the quantity of real GDP supplied increases along the SAS curve.
• Real GDP exceeds potential GDP.
Page 2 of 13
Changes in Aggregate Supply
• Aggregate supply changes if an influence on production plans other than the price level
changes.
• These influences include
Changes in potential GDP
Changes in money wage rate (and other factor prices)
Changes in Potential GDP
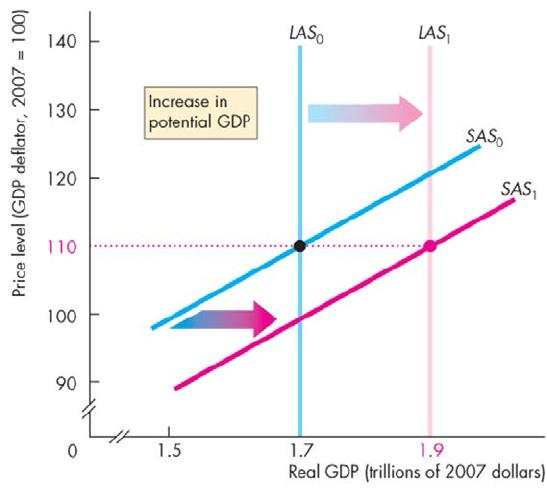
• When potential GDP increases, both the LAS and SAS curves shift rightward.
• Potential GDP increases if:
The full–employment quantity of labour increases
The quantity of capital (physical or human) increases
An advance in technology occurs
• The next figure shows the effect of an increase in potential GDP.
• The LAS curve shifts rightward and the SAS curve shifts along with the LAS curve.
Changes in the Money Wage Rate
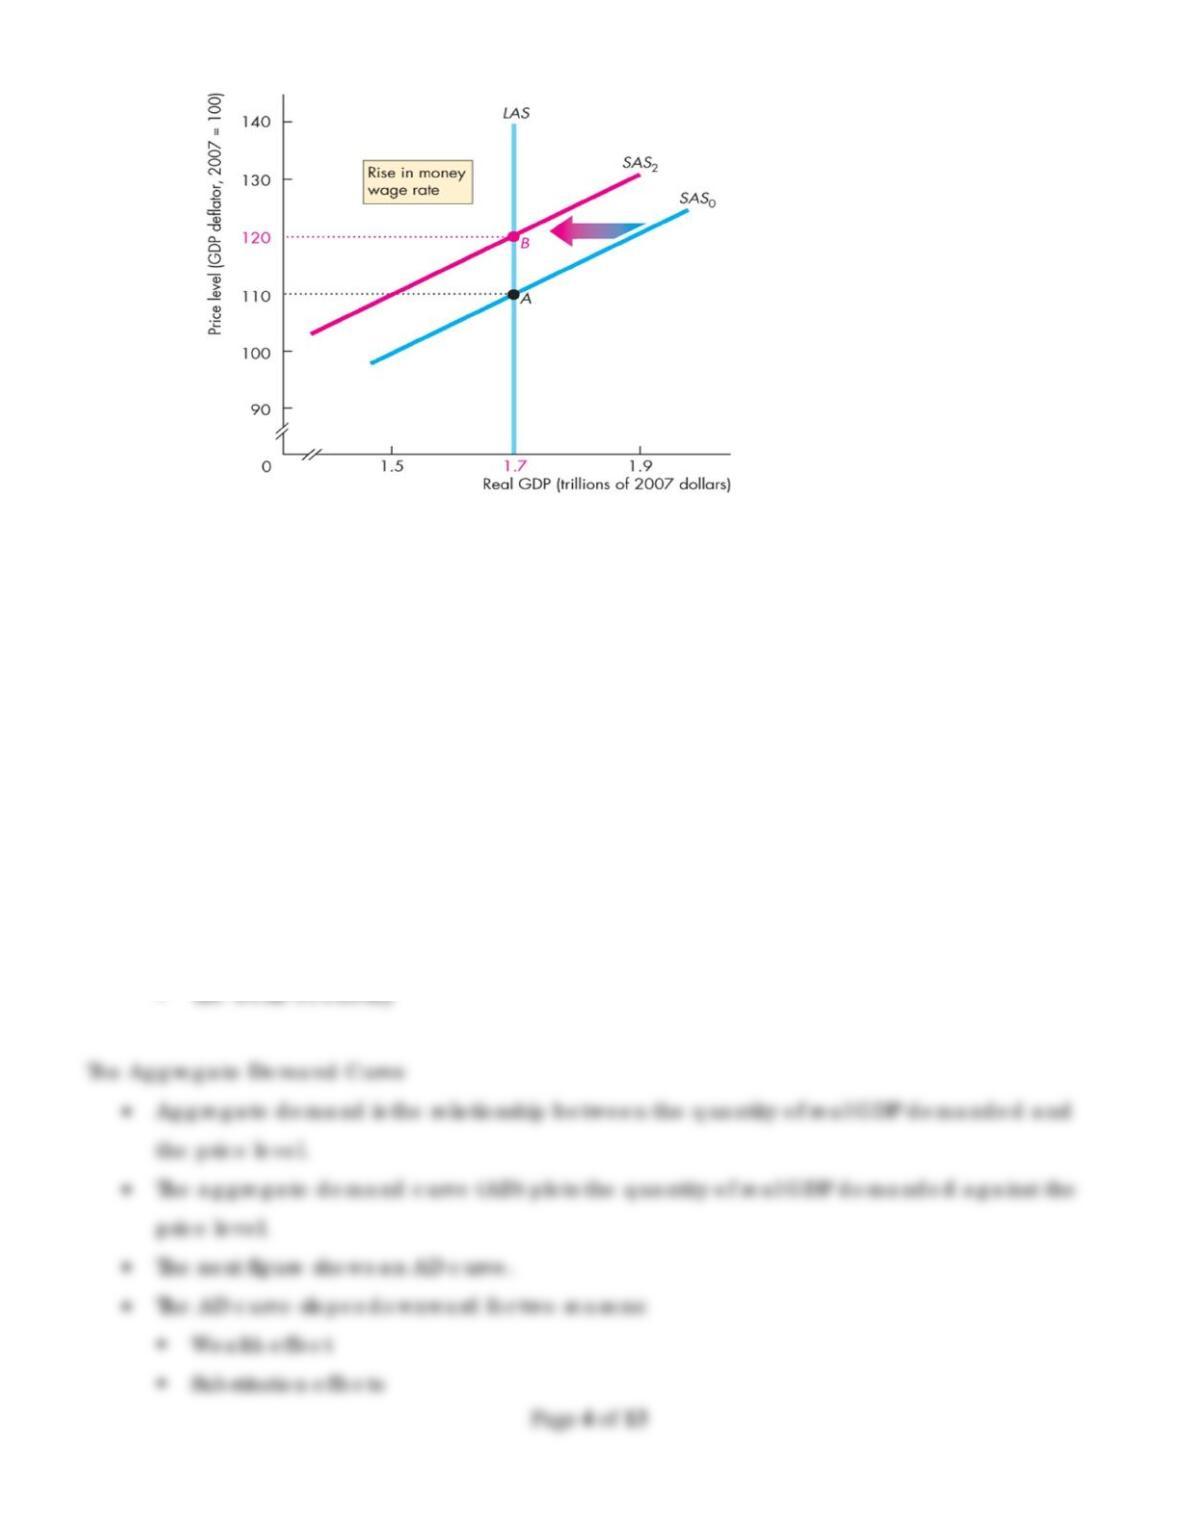
• The next figure shows the effect of a rise in the money wage rate.
• Short–run aggregate supply decreases and the SAS curve shifts leftward.
• Long–run aggregate supply does not change.
Page 3 of 13
Aggregate Demand
• The quantity of real GDP demanded, Y, is the total amount of final goods and services
produced in Canada that people, businesses, governments, and foreigners plan to buy.
• This quantity is the sum of consumption expenditures, C, investment, I, government
expenditure, G, and net exports, X – M.
• That is,
• Y = C + I + G + X – M.
• Buying plans depend on many factors and some of the main ones are
The price level
Expectations
Fiscal policy and monetary policy