CECN 603 Session 6
Topics: Income Inequality
Readings: PB Ch 19, SRG Ch 7, FFS Ch 7 & 8
After studying this topic, you will be able to:
♦ Describe the inequality in income and wealth in Canada and the trends in economic
inequality
♦ Describe the distribution of income and the trends in inequality in selected countries and
the world
♦ Explain the sources of economic inequality and its trends
♦ Describe the scale of government income redistribution in Canada
Measuring Economic Inequality
• Statistics Canada provides a measure of economic inequality based on three definitions of
income
• Market income equals wages, interest, rent, and profit earned in factor markets before
paying income taxes.
• Total income equals market income plus cash payments to households by governments.
• After–tax income equals total income minus tax payments by households to governments.
The Distribution of Income
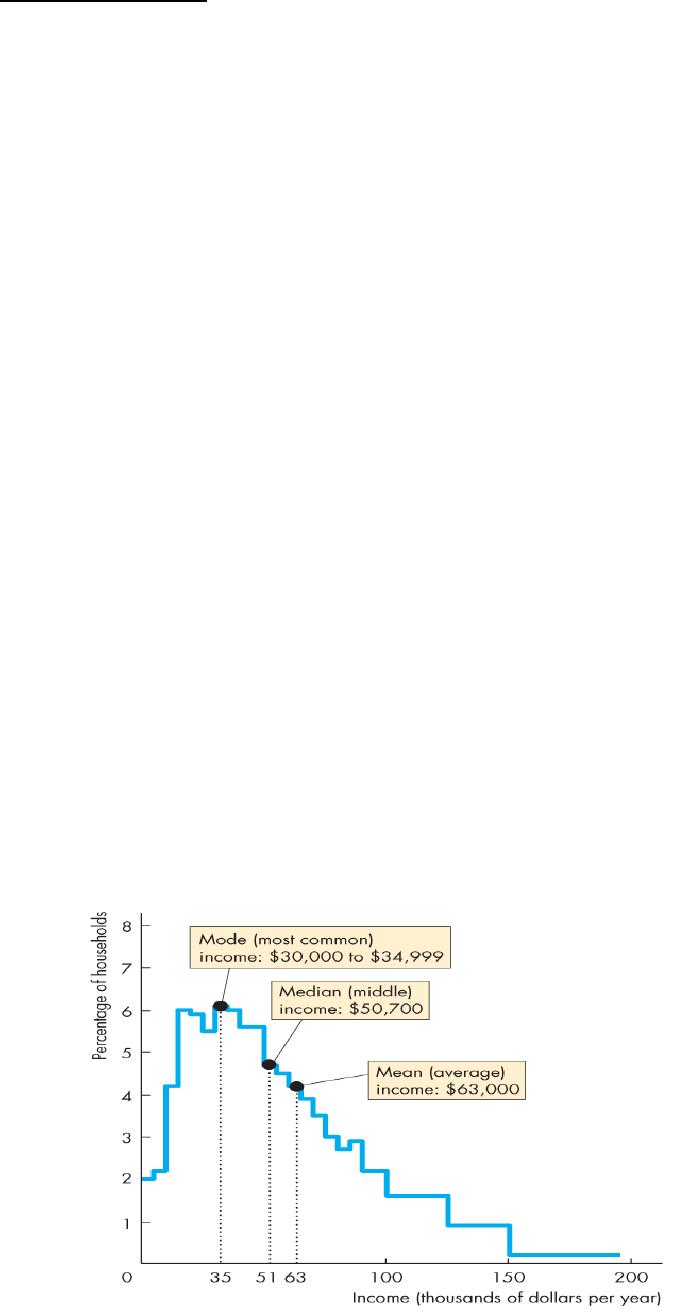
• The next figure shows the distribution of after–tax income across the 14 million households in
Canada in 2011.
Page 1 of 13
• The mode income is the most common income and was between $30,000 and $34,999.
• The median income is the middle–level of income and was $50,700.
• The mean income is the average income and was $63,000.
• A distribution in which the mean exceeds the median and the median exceeds the mode
is positively skewed, which means it has a long tail of high values.
• The distribution of income in Canada is positively skewed.
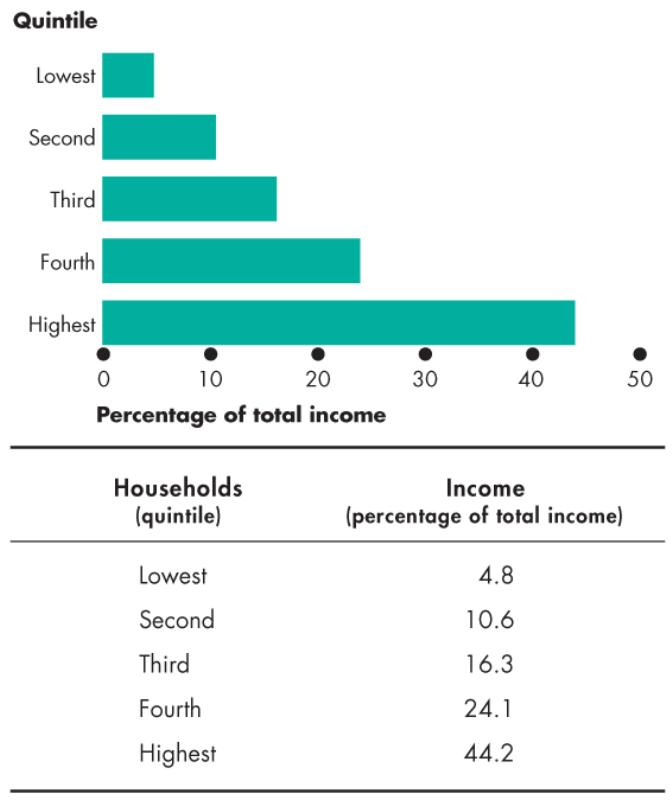
• The next figure shows the distribution of quintile shares of income for Canada in 2011.
• A quintile is 20 percent of households.
• In 2011:
• The lowest quintile received only 4.8% of the total after–tax income.
• The middle quintile received 16.3% of total after–tax income.
• The highest quintile received 44.2% of total after–tax income.
Page 2 of 13
The Income Lorenz Curve
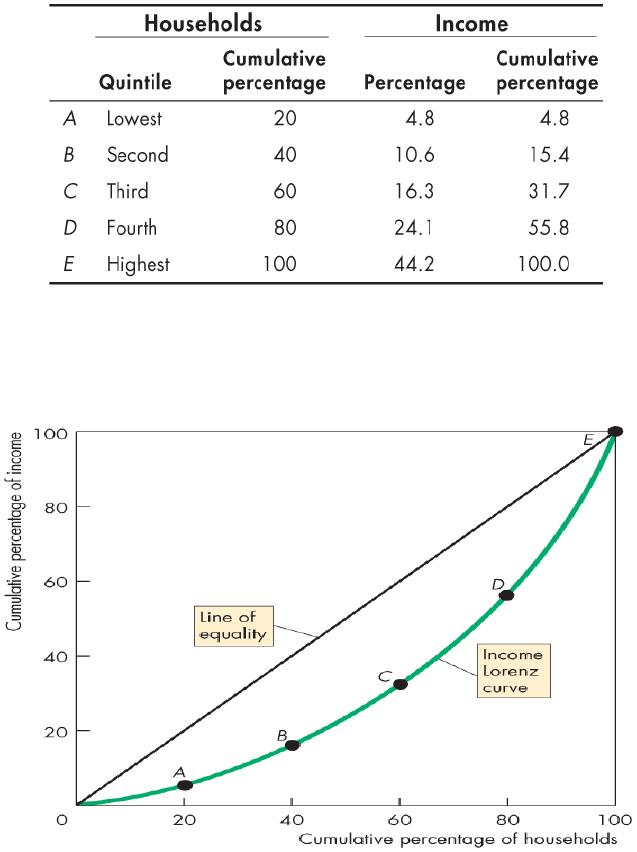
• The income Lorenz curve graphs the cumulative percentage of income earned against
the cumulative percentage of households.
• The vertical axis plots the cumulative percentage of income.
• The horizontal axis is the cumulative percentage of households.
• If everyone has the same income, …
• the income Lorenz curve is a 45 degree line from the lower left corner to the upper right
corner. This line is called the line of equality.
• The Lorenz curve shows the distribution of income.
The Distribution of Wealth
• A household’s wealth is the value of all the things that it owns at a point in time.
• The distribution of wealth is another way of examining the degree of economic inequality.
Page 3 of 13
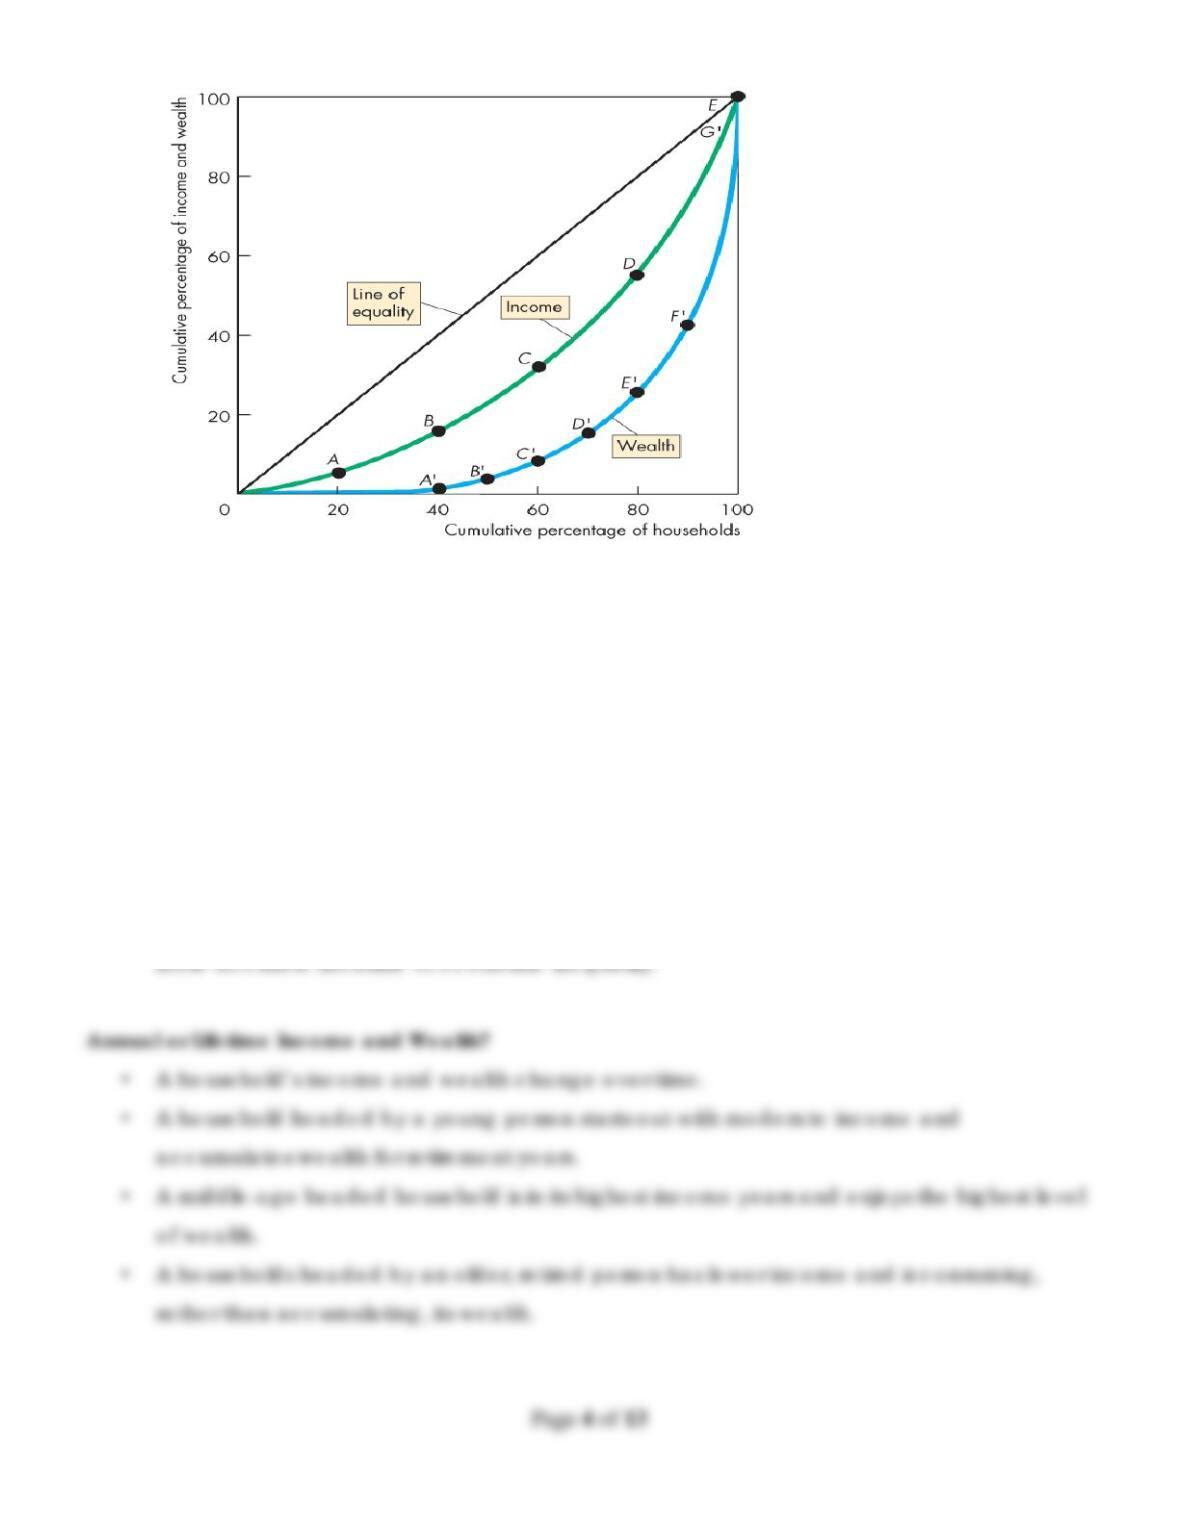
• A wealth Lorenz curve measures the distribution of wealth.
• The distribution of wealth is even more unequally distributed than income.
Wealth or Income?
• Wealth is a stock of assets and income is a flow of earnings that result from a given stock of
wealth.
• Wealth is more unequally distributed than income because wealth does not measure the
quantity of human capital.
• Income reflects the quantity of human capital.
• Because the distribution of wealth excludes human capital, the distribution of income is a