1
QUANTITATIVE METHODS FOR MGT DECISIONS
SIMPLE LINEAR REGRESSION ANALYSIS
Applications in Forecasting
Part 1
Spring 2017
SECTION A
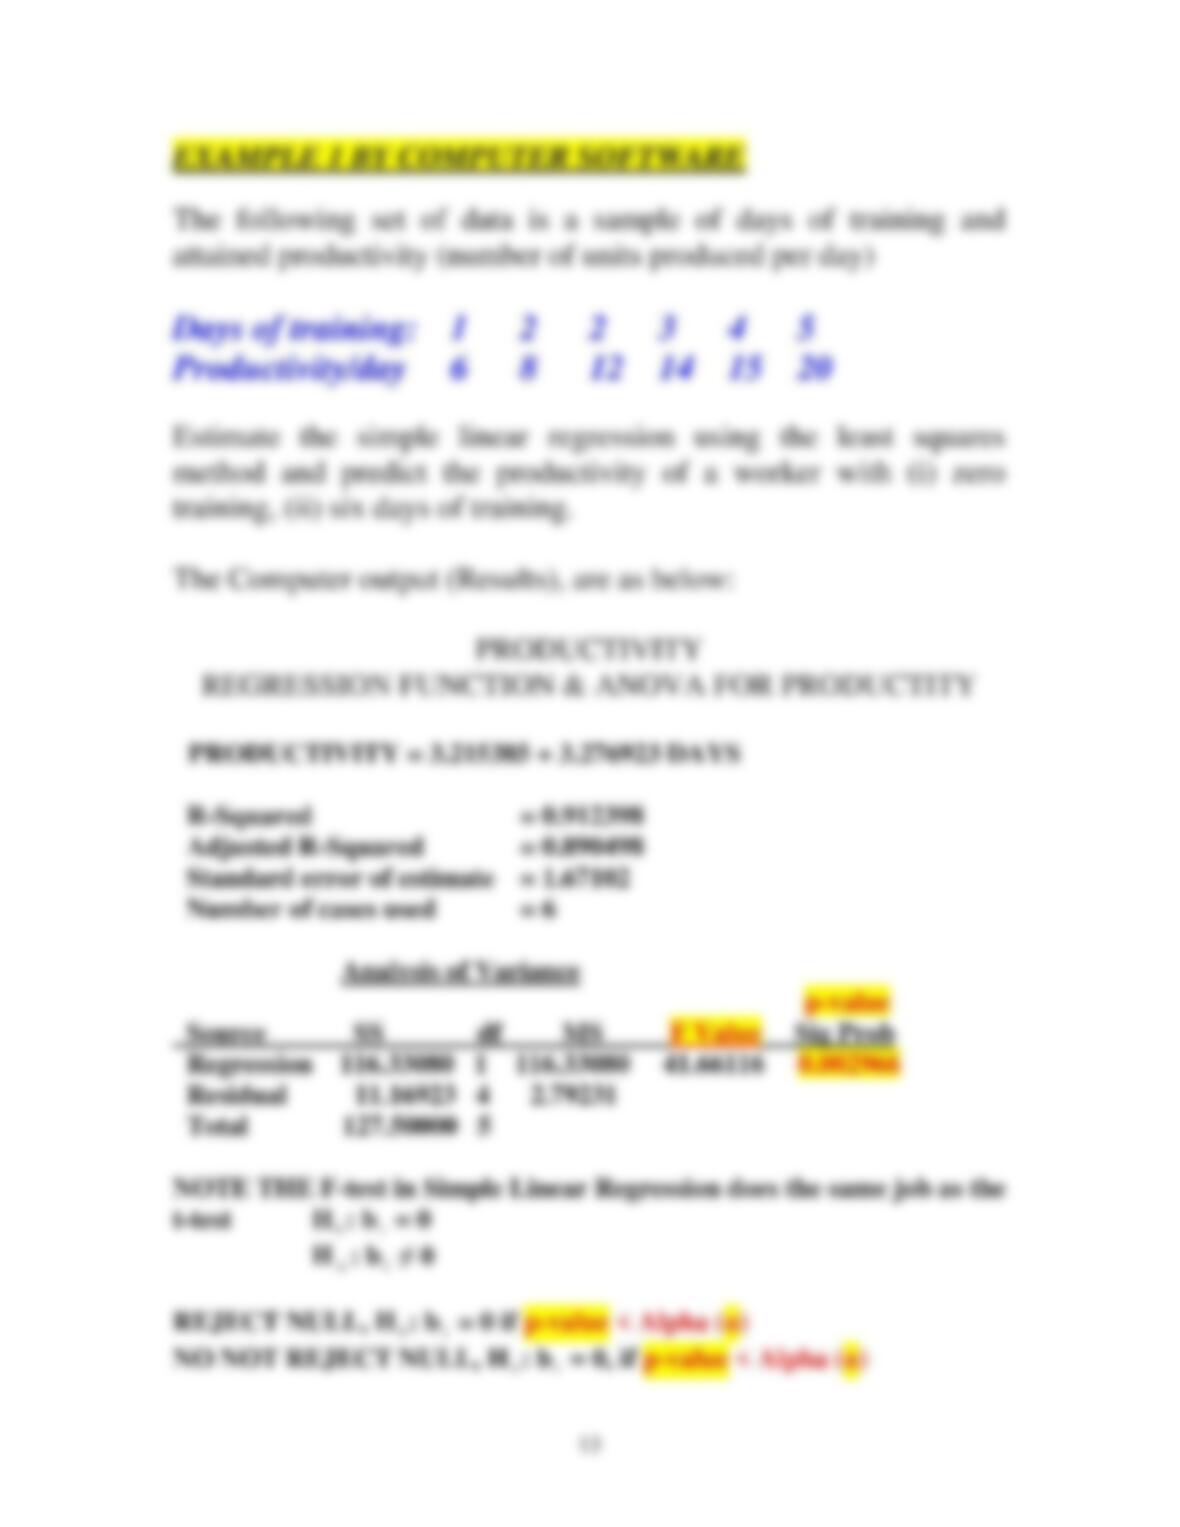
In simple linear regression analysis, we attempt to spell out a
statistical linear relationship between two variables: X and Y.
Variable X is known as the independent variable or the explaining
variable or the predicting variable or the input
Variable Y is called the dependent variable or the explained
variable or the predicted variable or the output. The idea is to use
values of variable X to predict or forecast the values of variable Y.
X-axis
Y-axis
independent
dependent
predictor
predicted
carrier
response
input
output
There can be numerous relationships between variables X and Y.
The plotting of both variables may tell us whether the relationship
is or is not linear. If the relationship is linear, the plot can tell us
whether that linear relationship is of a direct relationship or an
inverse relationship.

2
DIAGRAM 1 A scatter diagram that depicts a direct linear relationship
Variable Y
Variable X
DIAGRAM 2 A scatter diagram that depicts an inverse linear relationship
Variable Y
*
* *
* * *
* * *
* *
* * *
*
* *
* * *
Variable X
A direct relationship between X and Y exists if when X goes
up, Y also goes up, and when X goes down, Y also goes down.
As X, Y. And as X, Y
The relationship or movement is in the same
direction
*
*
*
*
* * *
* *
* * * *
* * * *
* * *
*
3
[An example is: as the height of an adult person goes up, we expect
his/her weight to go up and vice versa]
An inverse relationship between X and Y exists if When X goes
up, Y goes down, and when X goes down, Y goes up.
As X, Y, And as X, Y
The relationship or movement is in opposite
direction
[An example is: as the weight of a car goes up, the miles per
gallon one gets goes down and vice versa]
SECTION B
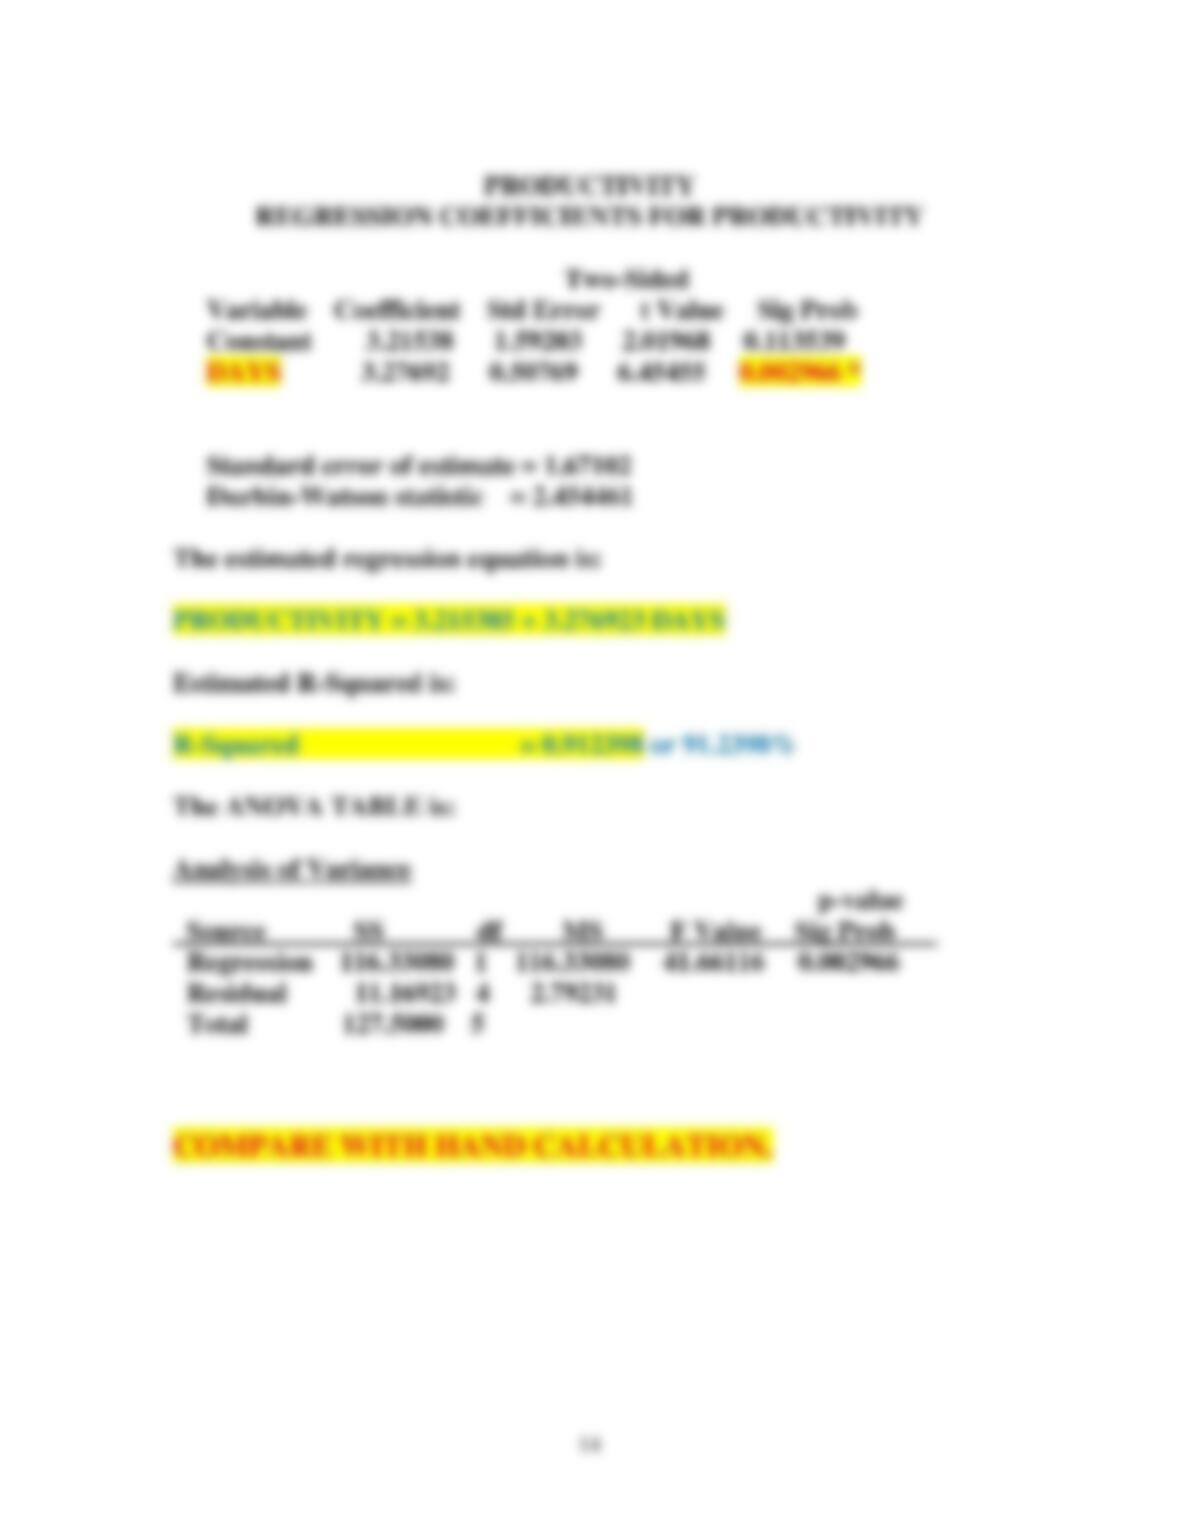
The statistical linear relationship is spelled out as:
Y = b
0
+ b
1
X + e
i
Where b
0
is a constant known as the intercept
And b
1
is the slope of the regression line
b
0
is a constant known as the intercept
And b
1
is the slope of the regression line
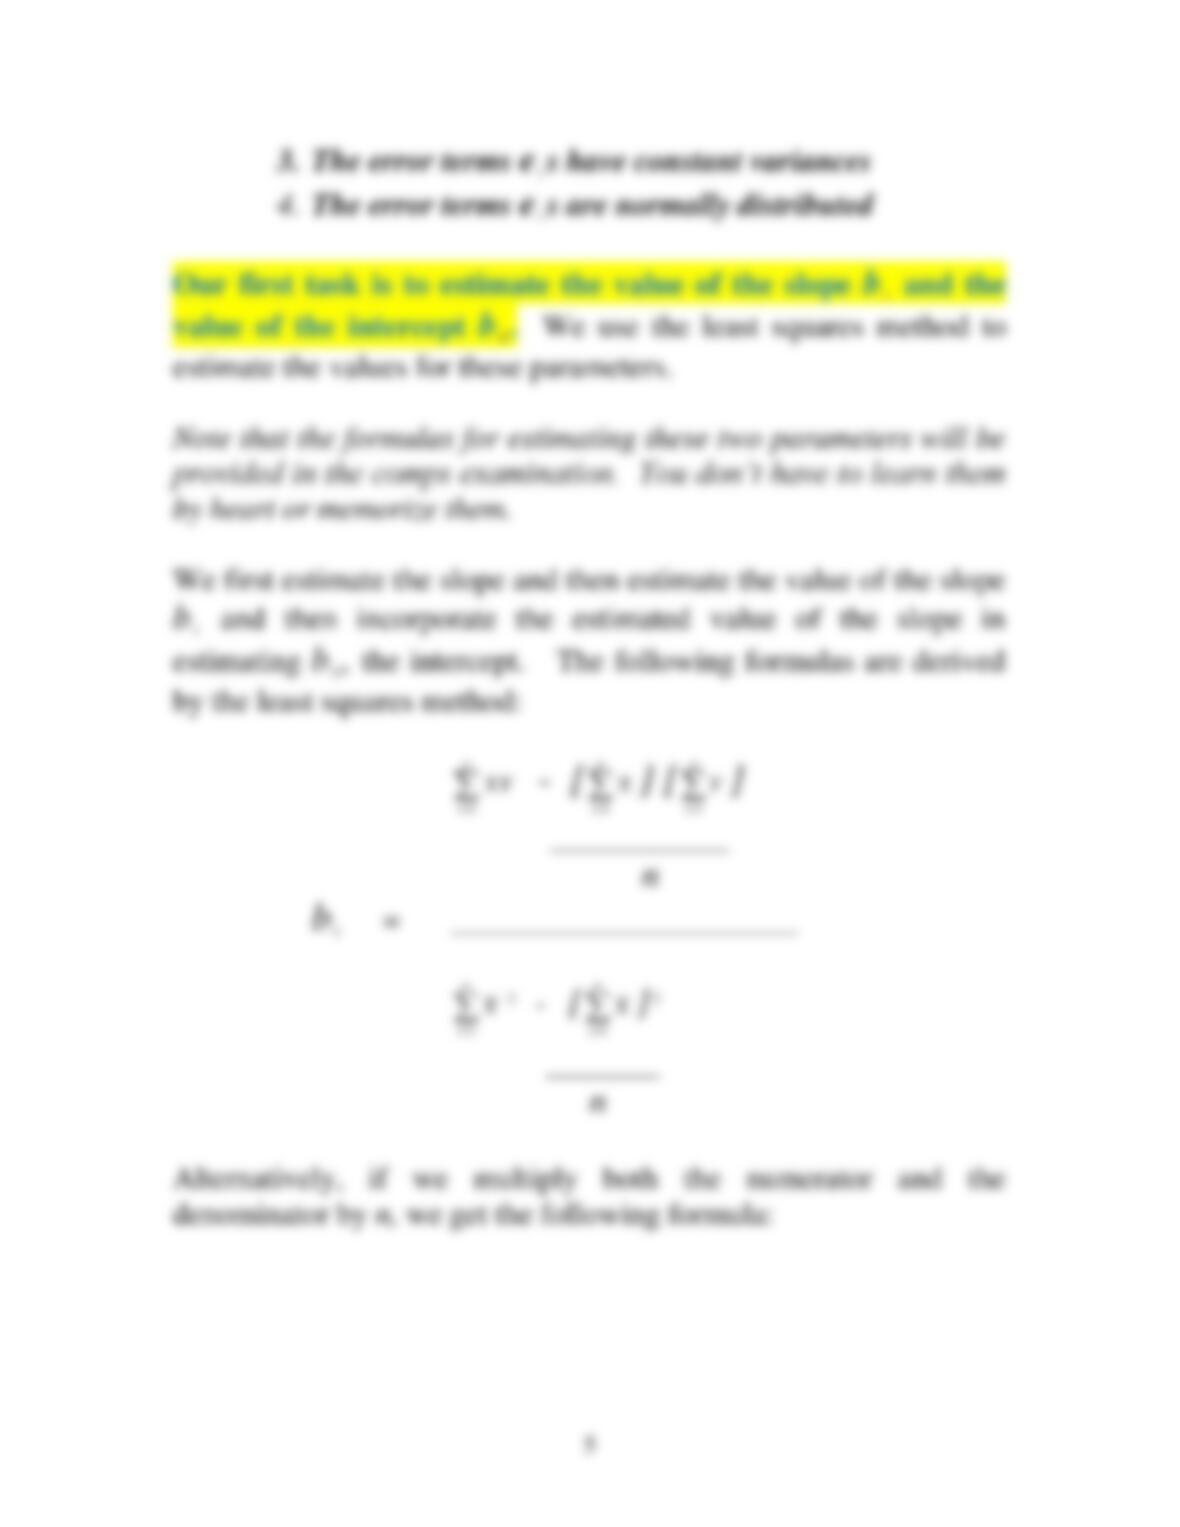
Note that if the estimated value of b
1
is positive, the
relationship between X and Y is of a direct form.
And, if the estimated value of b
is negative, the
1