1
QUANTITATIVE METHODS
EXAMINATION # 1 TAKE HOME
APRIL 17th, 2017 –EXAM DUE WEDNESDAY
(type in your answers)
NAME: Samuel Joseph
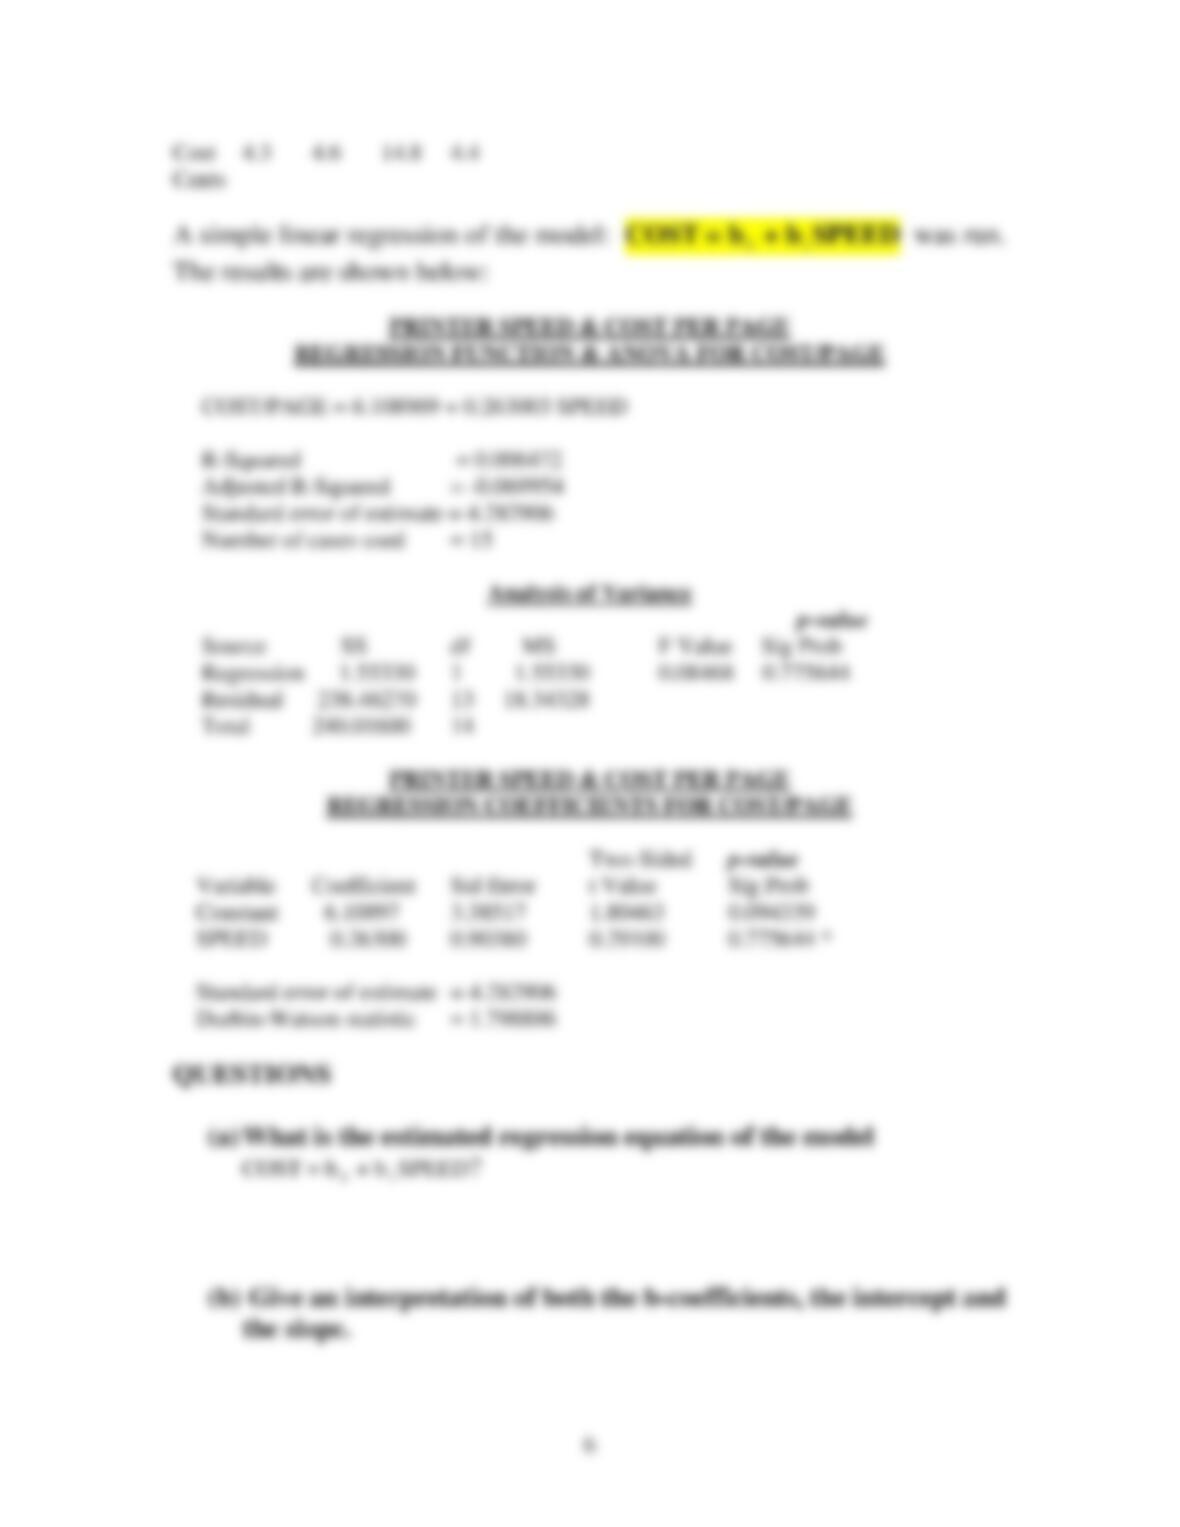
(1) REGRESSION ANALYSIS 20 points
A business person is trying to estimate the relationship between the price of
good X and the sales of good Y of certain groups of staples. Tests in similar
cities throughout the country have yielded the data below:
PRICE (X) SALES (Y)
$20 10,300
$25 9,100
$30 8,200
$35 6,500
$40 5,100
$50 2,300
A simple linear regression of a model SALES(Y) = b
0
+ b
1
PRICE(X)
Was run and the computer output is shown below:
PRICE OF X / SALES OF Y
REGRESSION FUNCTION & ANOVA FOR SALES(Y)
SALES(Y) = 15907.14 – 269.7143 PRICE(X)
R-Squared = 0.994999
Adjusted R-Squared = 0.993749
Standard error of estimate = 230.9143
Number of cases used = 6
Analysis of Variance
p-value
Source SS df MS F Value Sig Prob
Regression 4.24350E+07 1 4.24350E+07 795.83480 0.000009
Residual 213285.70000 4 53321.43000
Total 4.26483E+07 5

2
PRICE OF X / SALES OF Y
REGRESSION COEFFICIENTS FOR SALES(Y)
Two-Sided p-value
Variable Coefficient Std Error t Value Sig Prob
Constant 15907.14000 332.34250 47.86370 0.000001
PRICE(X) -269.71430 9.56076 -28.21054 0.000009 *
Standard error of estimate = 230.9143
Durbin-Watson statistic = 1.687953
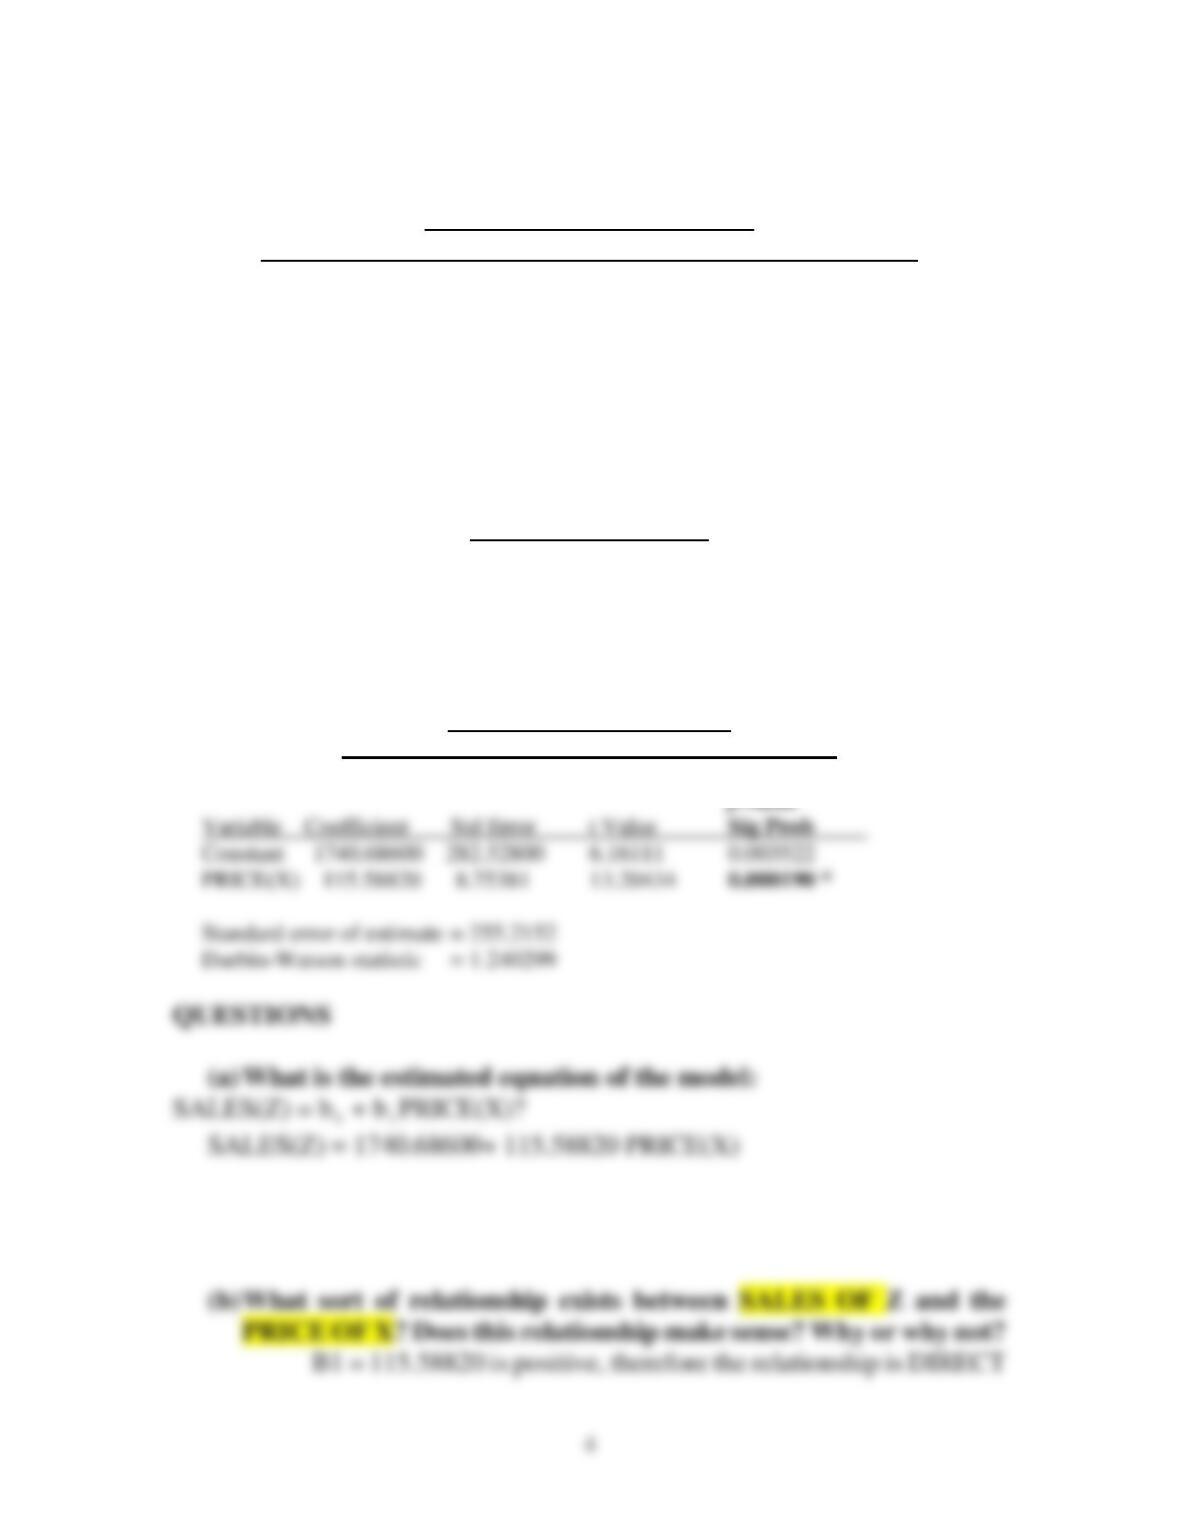
QUESTIONS
(a) What is the estimated equation of the model:
SALES(Y) = b
0
+ b
1
PRICE(X)?
SALES(Y) = 15907.14000 – 296.71430 PRICE(X)
(b) What sort of relationship exists between SALES OF Y and the
PRICE OF X? Does this relationship make sense? Why or why not?
B1 = -296.71430 is negative, therefore the relationship is indirect

3
(c) What can you say about GOOD Y and GOOD X (a good can be an
item, a commodity, etc.). Name a pair of good X and good y that
can display this kind of relationship
When Good X is priced at $20 Good Y has 10,300 sales.
(d) Is the relationship significant? Why or why not?
This relationship is significant
(2) REGRESSION ANALYSIS 20 points
A business person is trying to estimate the relationship between the price of
good X and the sales of good Z of certain groups of staples. Tests in similar
cities throughout the country have yielded the data below:
PRICE (X) SALES (Z)
$15 3300
$20 3900
$25 4750
$30 5500
$40 6550
$50 7250
A simple linear regression of a model SALES (Z) = b
0
+ b
1
PRICE(X)
Was run and the computer output is shown below:
PRICE OF X / SALES OF Z
REGRESSION FUNCTION & ANOVA FOR SALES(Y)
SALES(Z) = 1740.686 + 115.5882 PRICE(X)
R-Squared = 0.977573
Adjusted R-Squared = 0.971966
Standard error of estimate = 255.2152
Number of cases used = 6
Analysis of Variance
p-value
Source SS df MS F Value Sig Prob
Regression 1.13565E+07 1 1.13565E+07 174.35450 0.000190
Residual 260539.20000 4 65134.80000
Total 1.16171E+07 5
PRICE OF X / SALES OF Z
REGRESSION COEFFICIENTS FOR SALES(Z)