Samantha Davis
Determination of Equilibrium Constant
Abstract: The objective of this experiment was to first determine the equilibrium constant
through finding absorbance of an Iron thiocyanate by following a procedure given in a two part
dilution experiment. Creating molar concentrations, from already given data we were able to use
equilibrium constant equation to solve for an equilibrium constant for varying concentration of
the Iron Thiocyanate solution. Each beaker in part one were measured for absorbance at 486 nm
(blue wavelength) using the pasco colorimeter and sparkvue app to create a linear regression
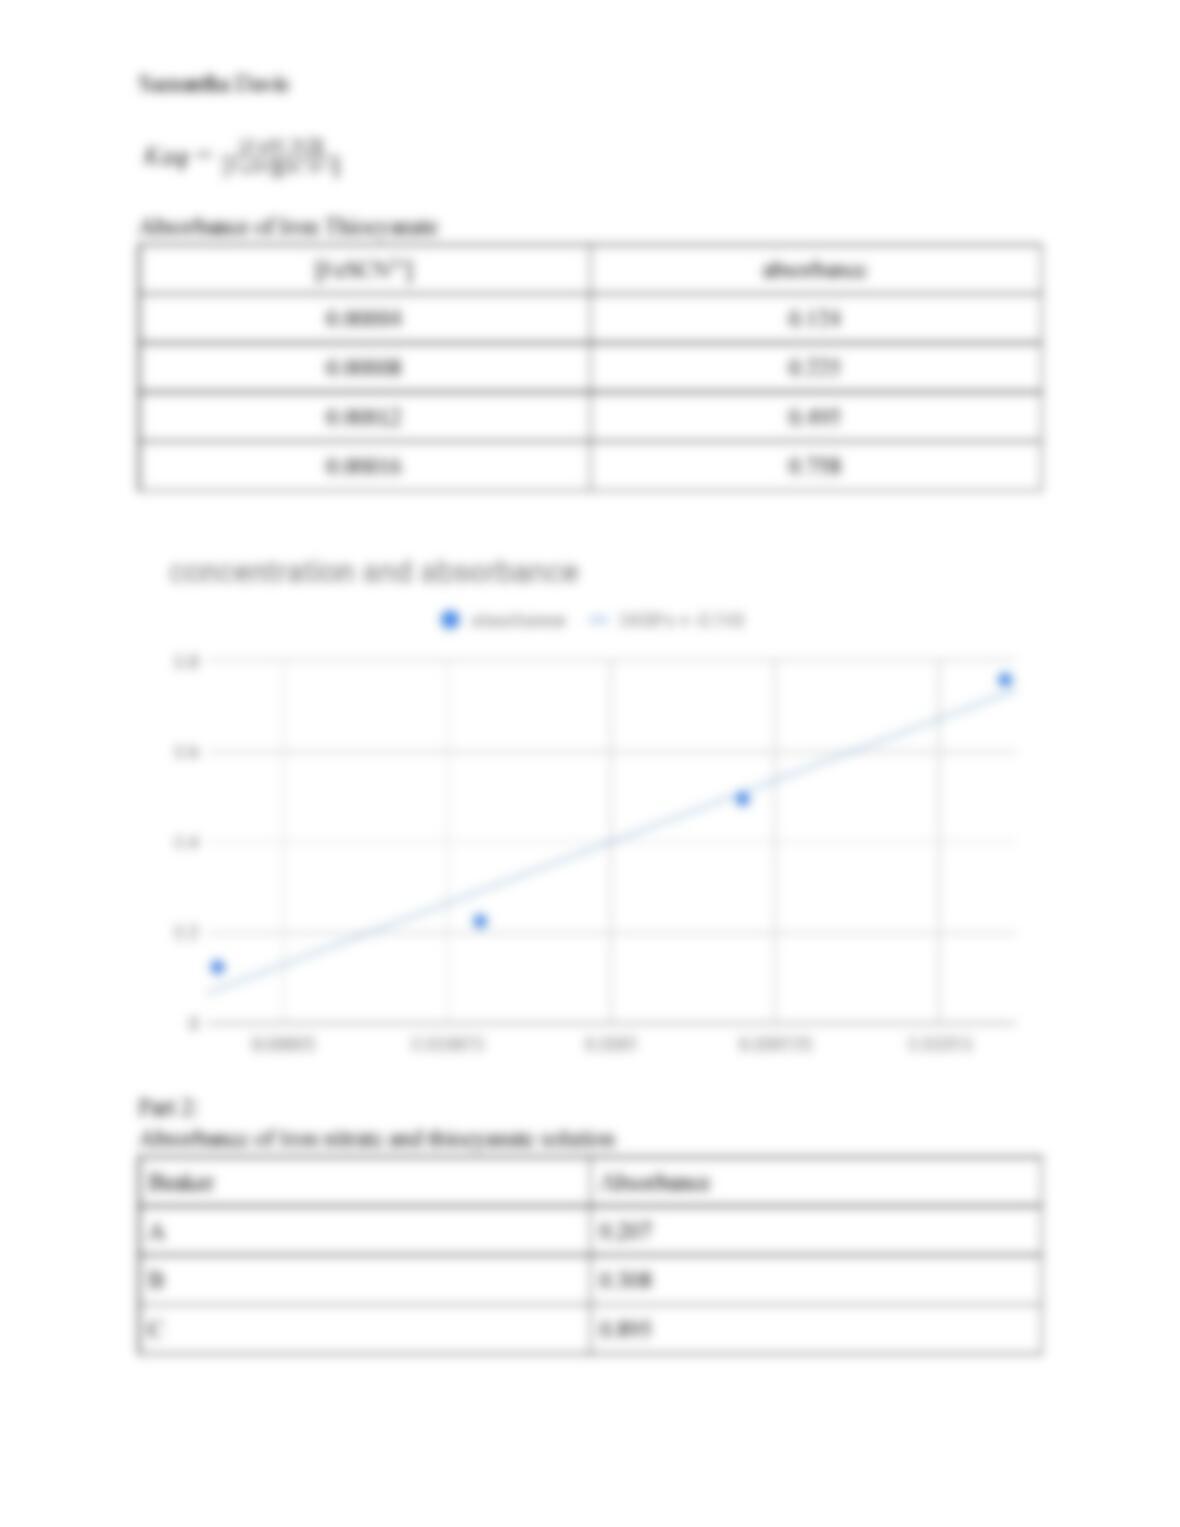
equation to use in part 2. Concentrations were solved for using the linear regression equation in
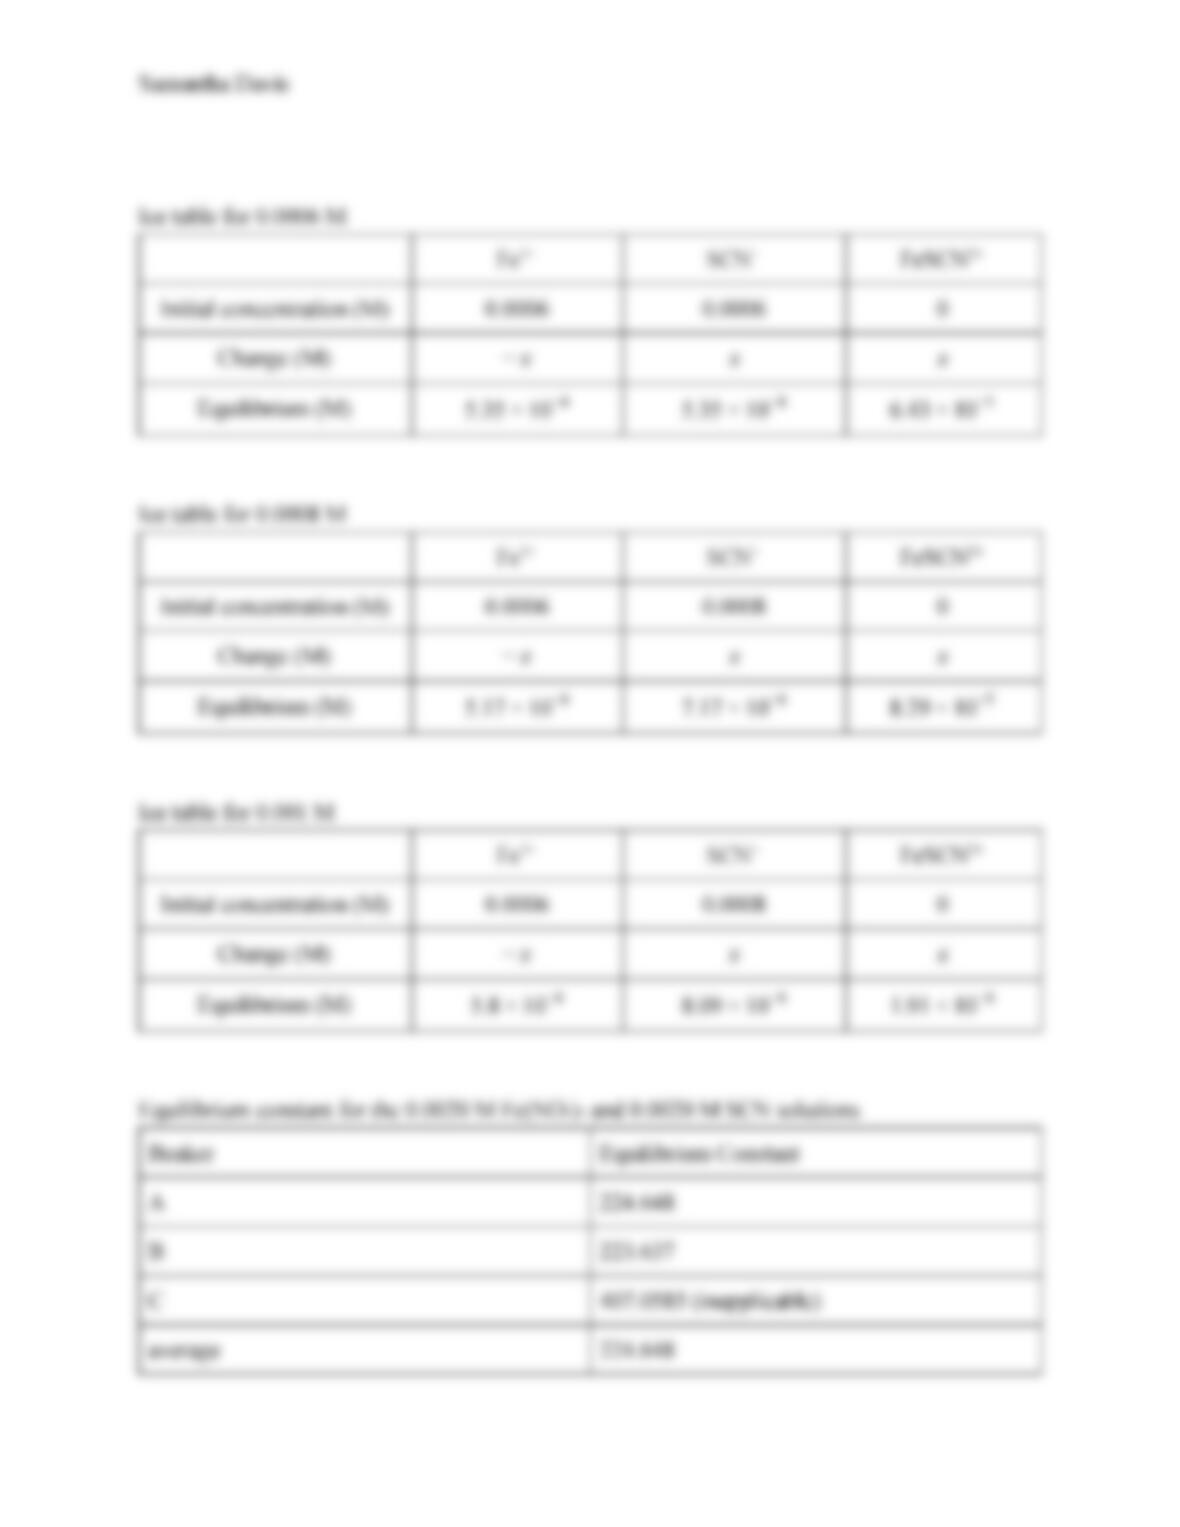
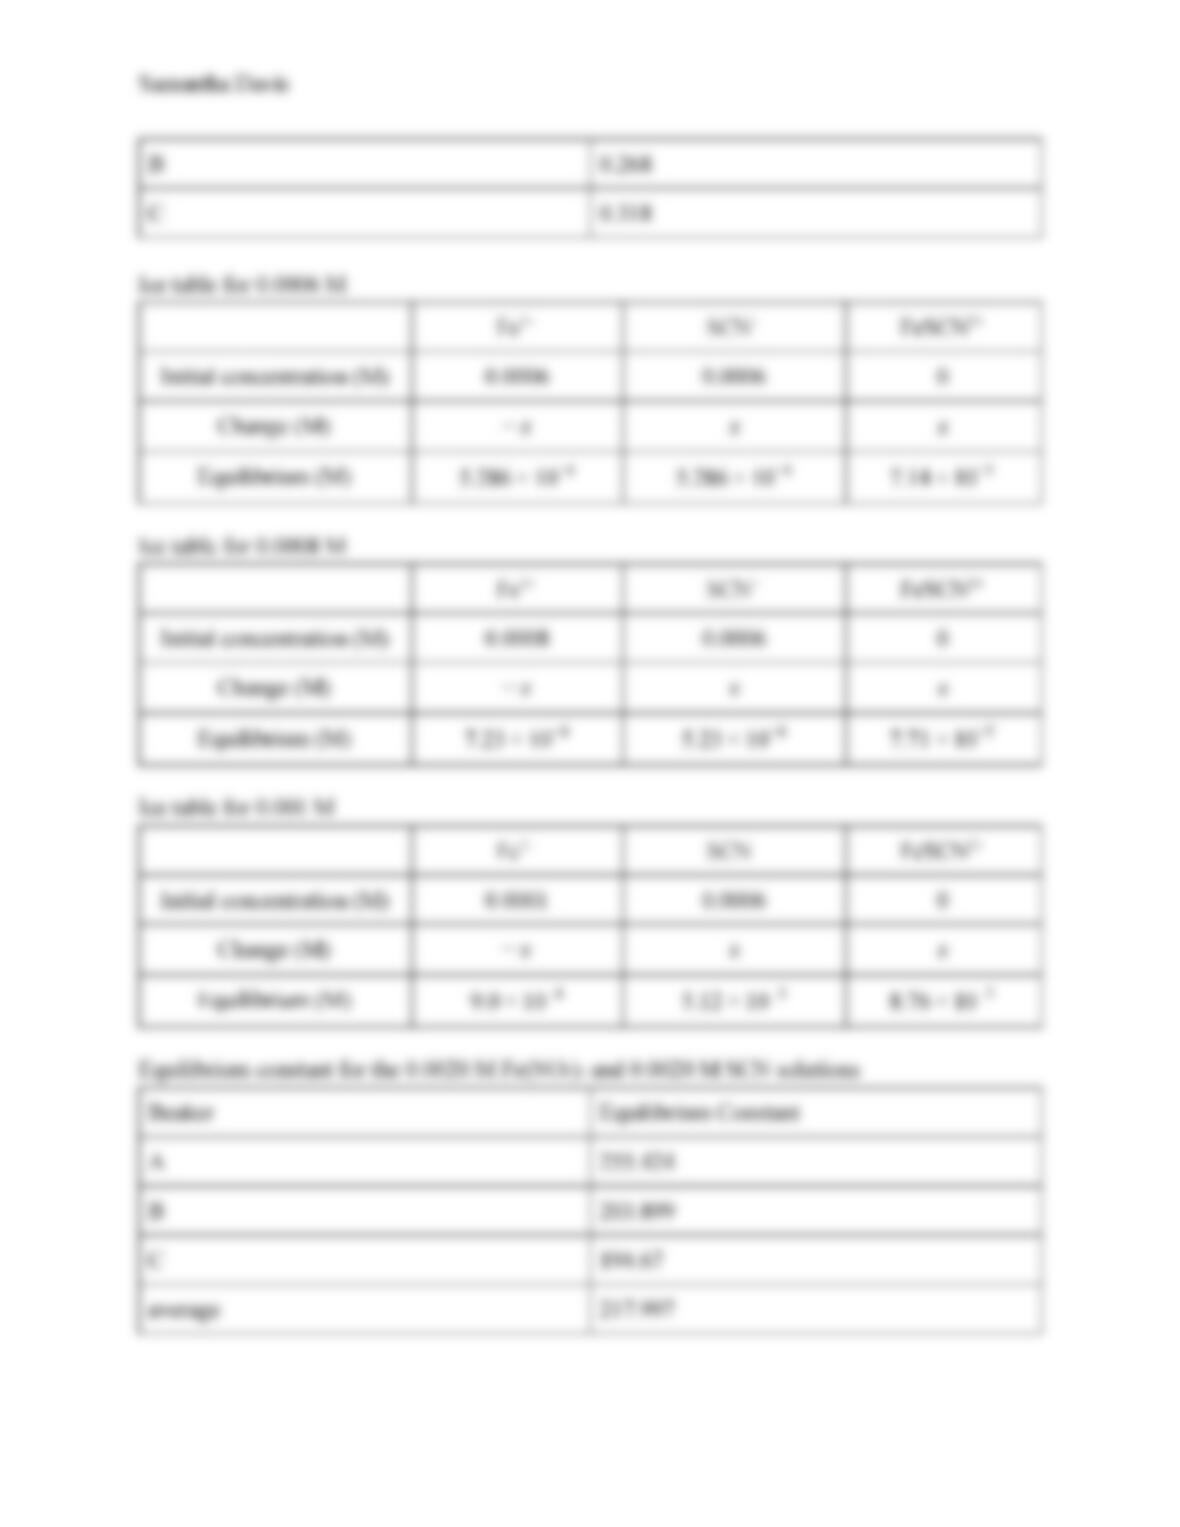
part 1 to create an ICE table to be used in a Keq equation. After doing this, we changed the
amount of Fe(NO3)3 compared to the amount of SCN-, both being reactants in the chemical
equilibrium equation. Procedures for both experiments remained the same otherwise. This did
not significantly affect the equilibrium constants whatsoever. Colorimetric determination of the
concentration of an solution, combined with equilibrium constant determination, is a useful
analytical procedure that can be continually used.
Introduction: A chemical equilibrium equation has the following form: aA + bB cC + dD.
equilibrium, is described as a state in which the rate of the forward reaction equals the rate of the
reverse reaction. In other words, there is no net change in concentrations of reactants and
products. This kind of equilibrium is also called dynamic equilibrium. The equilibrium state of a
chemical reaction can be characterized by defining its equilibrium constant, Keq, which
expresses the relationship between products and reactants at a specific temperature. To determine
an equilibrium constant absorbance values must be determined through colorimetric
determination, then substituted into the linear regression equation. The amount of light that
travels through solution, or absorbance, is proportional to its concentration. At equilibrium, the
molar concentrations of products and reactants will be fixed in a given ratio. This ratio is the
equilibrium constant , which is determined by substituting molar concentrations ateqK =[A] [B]
a b
[C] [D]
c d
equilibrium into the equilibrium constant equation. Concentration values are determined by an
ICE table in which initial concentrations are recorded, change in concentration, and equilibrium
concentrations which will be used to determine the equilibrium constant.
Procedure:
Week 1
Part 1: Small volumes of 0.200 M Fe(NO3)3, 0.0020 M SCN– and distilled water were obtained.
Graduated cylinders were used to measure the solutions. The temperature of one of the solutions
as the temperature for the equilibrium constant, Keq were measured and recorded. A solution of
Samantha Davis
5.0 mL 0.200 M Fe(NO3)3, 4.0 mL of 0.0020 M SCN– and 41 mL of water for a total volume of
50.0 mL was prepared. These steps were repeated 3 more times, each time preparing a solution
with one less mL 0.0020 M SCN– and adding 1 mL to the amount of water for a total of 50 mL
of solution. 4 beakers in total were prepared with decreasing concentrations of 0.0020 M SCN–
by a factor of 1 mL starting at the original 4 mL. A blank in a cuvette was prepared with distilled
water to zero out the colorimeter reading on the Sparkvue app. Each solution from beaker was
placed in a cuvette with a transfer pipette to measure the absorbance at a 486 nm (green)
wavelength. These values were recorded on a data table to use for linear regression for part two
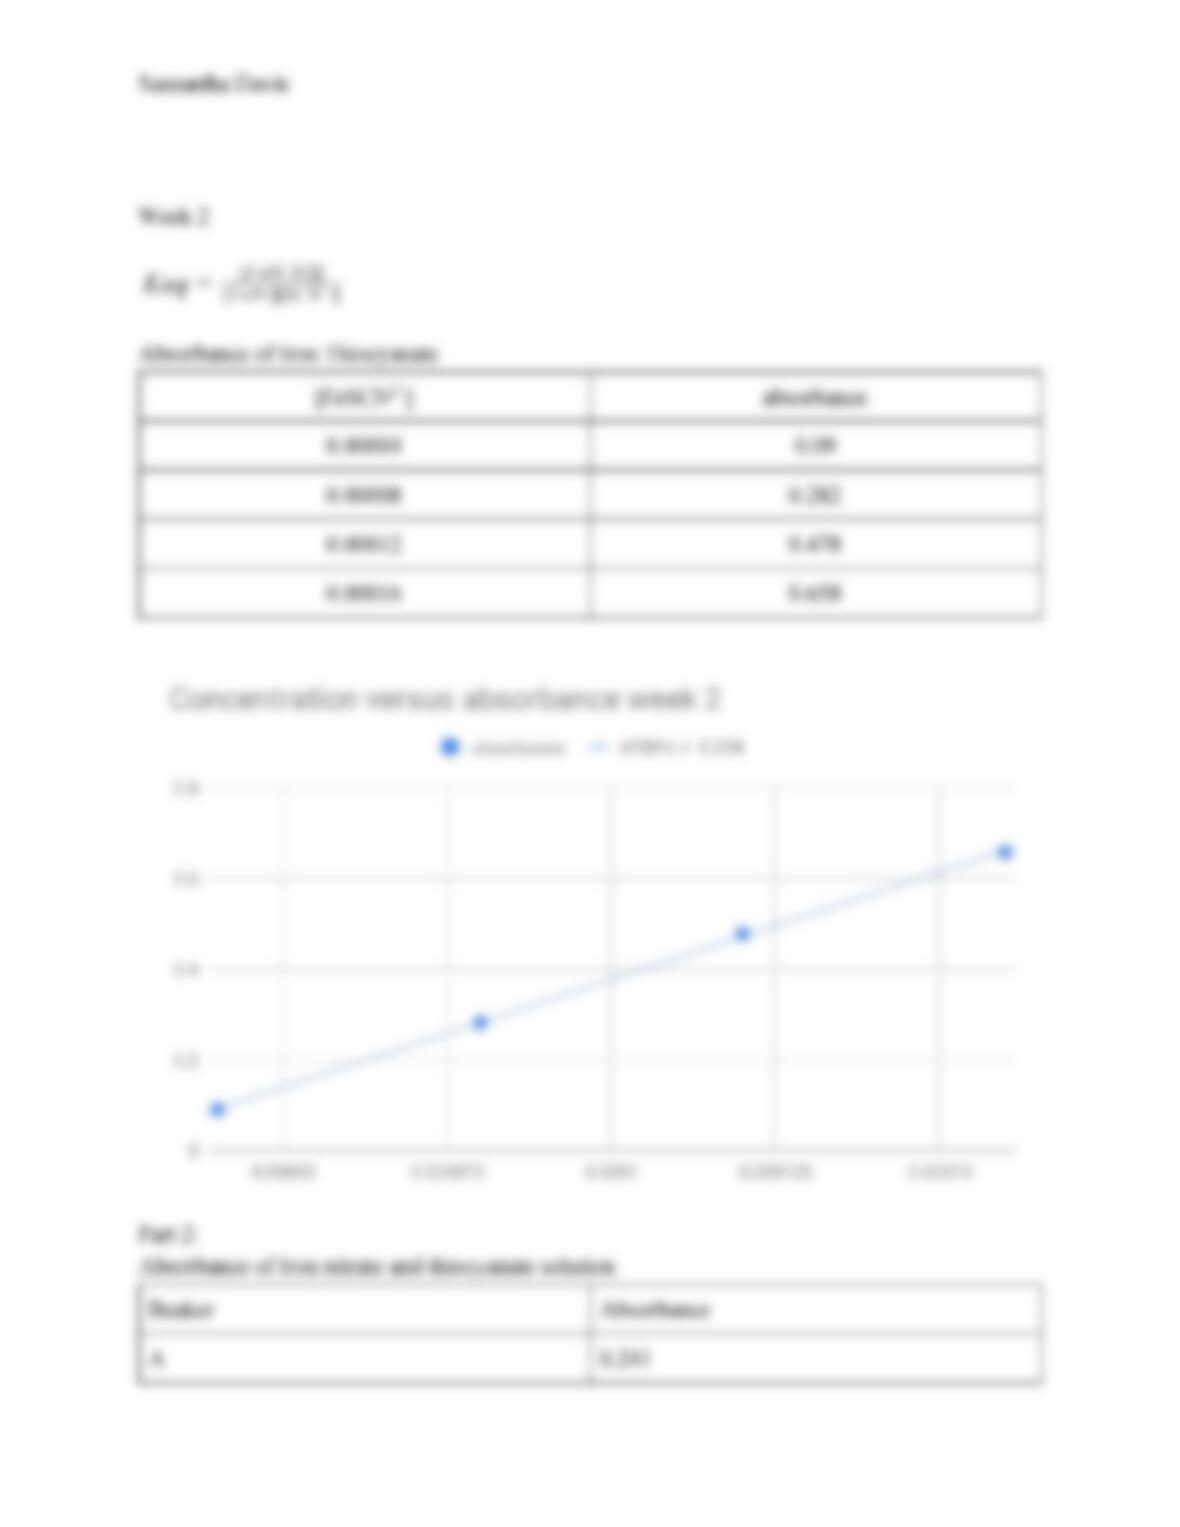
in which [FeSCN2+] is labeled on the x axis and absorbance (486 nm) on the y-axis. The linear
regression line were used to find concentration values in part 2.
Part 2: Three new small beakers were labeled A-C. 3.0 mL of 0.0020 M Fe(NO3)3 were
transferred into each beaker. In beaker A using a pipette, 3.00 mL of 0.0020 M SCN– was
transferred, in beaker B 4.00 mL of 0.0020 M SCN– and in beaker C, 5.00 mL of 0.0020 M
SCN–. To beaker A 4.00 mL of water was added, 3.00 mL to beaker B, and 2.00 mL to beaker C
to create a 10 mL total volume. Each solution was transferred into a cuvette to measure
absorbance of each solution. Each absorbance was recorded in a data table. These absorbance