Chapter 6: Designing Global Supply Chain Networks
Exercise Solutions
1.
Answer:
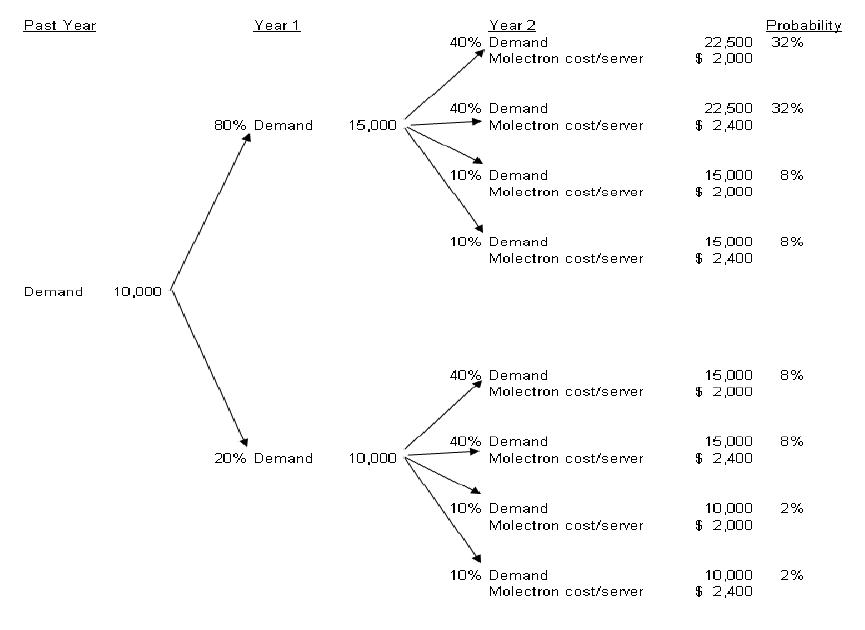
Using a decision tree to analyze this decision reveals a dominant answer. Not only does
outsourcing to Molectron result in a higher expected incremental profit, but also in every possible
outcome, the Molectron option results in a higher profit. Therefore, according to the financial
analysis, no matter what the risk tolerance of the management at Moon, they should choose to
outsource rather than to increase their own facility.
There are other factors that could play into this decision, however, which are harder to quantify.
Two are particularly important: the performance of Molectron and the strategic decision
regarding where Moon should focus its efforts. It’s possible that Molectron’s quality and delivery
performance would be worse than if Moon made the machines themselves. If this is the case, it
could counter the financial advantage Molectron presents. Secondly, building the additional plant
may increase Moon’s manufacturing competence and this may be a key to their success down the
road. Conversely, the new plant could distract Moon from other aspects of their business making
outsourcing more attractive. All these factors should be considered when making the decision.
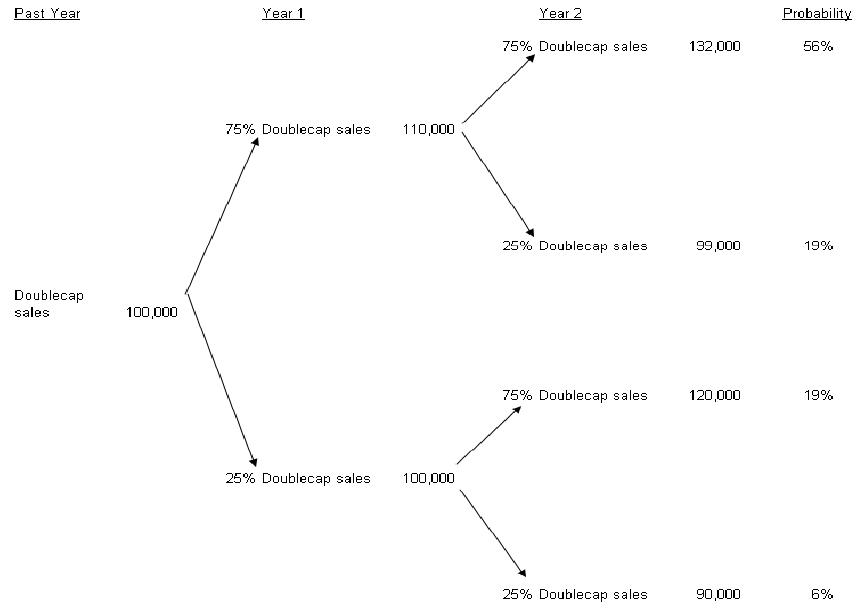
Solution using Decision Tree:
Input:
Current demand: D0 =10,000
Probability of demand goes up in next year: Pup = 80%
Probability of demand remains the same: Psame = 20%
Demand increasing rate: ud=150%
Increased capacity: M = 10,000
Annual fixed cost of new capacity: Cfix = $10,000,000
Labor cost per server of new capacity: C labor = $500
Raw material cost per server: Craw = $ 8,000
Labor cost per server by Molectron: CMolectron = $2,000
Price per server: P = $15,000
Probability of Molectron’s price goes up in the second year: 50%
Probability of Molectron’s price remains the same in the second year: 50%
Molectron’s cost increasing rate: uc = 120%
Output:
To draw the decision tree and analyze this problem, we need to calculate for each
scenario the total demand and cost per server for both 1st and 2nd years.
1st yr. demand if it goes up: Du = D0 * 150% = 15,000
1st yr. demand if it remains the same: Dd = 10,000
There are four scenarios of 2nd demand: Duu, Dud, Ddd, Ddu. The subscripts mean the
demand changes. For example, Duu means demand has been going up for two years, and
Dud means the demand went up and went down or remained the same.
Duu = D0 * ud * ud = 10,000 * 150% * 150% = 22,500
Dud = D0 * ud = 10,000 * 150% = 15,000
Ddd = D0 = 10,000
Ddu = D0 * ud = 10,000 * 150% = 15,000
Please note that Duu = 22,500 exceeds the capacity of 20,000, hence Moon Micro can
only set 20,000 demand in this scenario. And we should calculate revenue of this scenario
accordingly.
Independent of demand changes, cost per server by Molectron in the 2nd yr. also has two
scenarios. It can remain the same at CMolectron = $2,000, or goes up to CMolectron * uc =
$2,000 * 120% = $2,400. Together with the four possible variations due to demand
changes, there are eight scenarios in the second year. For each scenario, we need to
evaluate its probability, incremental revenue, and profit.
We present here how to compute these critical quantifications for one scenario. Analyses
for other scenarios are summarized in the table following this analysis. In this scenario,
the demand has been going up and up for two years and Molectron raised the cost per
server in the second year. This scenario is represented in the decision tree as the upper
right-hand node.
1. The total probability of Duu and cost per server by Molectron going up is:
80% * 80% * 50% = 32%.
2. The incremental revenue of this scenario should we take first option is:
{ min(capacity, Du ) + min(capacity, Duu) – D0 } * P = $225,000,000
3. The incremental revenue of this scenario should we take second option is:
( Du + Duu – D0 ) * P = $262,500,000
Please note that under the first option, Moon Micro has only 20,000 capacities hence
exceeding demand can not be satisfied. However under the second option, Molectron has
capacities to handle extra demands.
4. The incremental cost of this scenario should we take option one is:
Cfix * 2 + { min(capacity, Du ) + min(capacity, Duu) – D0 } * (C labor + Craw) =
$147,500,000
5. The incremental cost of this scenario should we take option two is:
( Du – D0 ) * ( CMolectron + Craw) + (Duu – D0) * (CMolectron * uc + Craw ) = $180,000,000
6. Hence for the scenario of Duu and cost per server by Molectron also going up, the
incremental profit of option one is $225,000,000 – $147,500,000 = $77,500,000; while
the incremental profit of option two is $262,500,000 – $180,000,000 = $82,500,000.
Similarly we can calculate the profits of option one and option two for each one of the
eight scenarios. The details are shown in the following table. The expected incremental
profit is calculated by the sum of products of incremental profits and associated
probabilities.
Table: Incremental Profits for all scenarios
scenarios
Option 1
Option 2
1
Demand
22500
Revenue
$225,000,000
$262,500,000
Molectron cost
$2,000
Cost
$147,500,000
$175,000,000
Probability
32%
Profit
$77,500,000
$87,500,000
2
Demand
22,500
Revenue
$225,000,000
$262,500,000
Molectron cost
$2,400
Cost
$147,500,000
$180,000,000
Probability
32%
Profit
$77,500,000
$82,500,000
3
Demand
15,000
Revenue
$150,000,000
$150,000,000
Molectron cost
$2,000
Cost
$105,000,000
$100,000,000
Probability
8%
Profit
$45,000,000
$50,000,000
4
Demand
15,000
Revenue
$150,000,000
$150,000,000
Molectron cost
$2,400
Cost
$105,000,000
$102,000,000
Probability
8%
Profit
$45,000,000
$48,000,000
5
Demand
15000
Revenue
75,000,000
75,000,000
Molectron cost
$2,000
Cost
62,500,000
50,000,000
Probability
8%
Profit
12,500,000
25,000,000
6
Demand
15,000
Revenue
75,000,000
75,000,000
Molectron cost
$2,400
Cost
62,500,000
52,000,000
Probability
8%
Profit
12,500,000
23,000,000
7
Demand
10,000
Revenue
0
0
Molectron cost
$2,000
Cost
20,000,000
0
Probability
2%
Profit
-20,000,000
0
8
Demand
10,000
Revenue
0
0
Molectron cost
$2,400
Cost
20,000,000
0
Probability
2%
Profit
-20,000,000
0
Solution using Excel Spreadsheet:
CELL
INPUT
SYMBOL
FORMULAS
QUANTIFIC
ATION
C3
Current demand
D0
10,000
D18
Probability of demand goes up in
next year
Pup
80%
D20
Probability of demand remains the
same
Psame
20%
F5
Annual fixed cost of new capacity
Cfix
$10,000,000
F6
Labor cost per server of new
capacity
C labor
$500
C5
Raw material cost per server
Craw
$ 8,000
F9
Labor cost per server by Molectron
CMolectron
$2,000
C4
Price per server
P
$15,000
F18
1st yr. demand (up)
Du
D0 * 150%
15,000
F38
1st yr. demand (down)
Dd
D0
10,000
I17
2nd yr. demand (up and up)
Duu
D0 * ud * ud
22,500
I21
2nd yr. demand (up and down)
Dud
D0 * ud
15,000
I41
2nd yr. demand (down and down)
Ddd
D0
10,000
I33
2nd yr. demand (down and up)
Ddu
D0 * ud
15,000
K17
total probability of Duu and cost per
server by Molectron going up
Puu
80% * 80% *
50%
32%
G17
incremental revenue of this scenario
(second option)
Ruu_2
$262,500,000
N19
incremental profit of this scenario
(first option)
Fuu_1
Ruu_1 – Cuu_1
$77,500,000
O19
incremental profit of this scenario
(second option)
Fuu_2
Ruu_2 – Cuu_2
$82,500,000