Project 1
Method
In this experiment, we took a detailed look at Edward Bloom Big Fish. In particular, we
sampled 10 pages of the book, and from each of those pages, examined the number of lines
starting with various types of words, and types of letters as well. In order to randomly
select 10 pages from the book, we used the Vasser Stats randomizer to generate 10 random
page numbers. We then went through each of the 10 randomly selected pages and recorded
the number of lines that started with a noun, a verb, an adjective, a vowel, and a consonant.
When recording the number of lines starting with nouns and verbs, we also made sure to
divide the results into those that began with vowels and those began with consonants. The
data was entered into a spreadsheet in Excel and then transferred to JMP IN. In dealing
with the data, we treated each of the ten pages as an individual and so we had 10 values for
the number of lines starting with each of our different word and letter types. Once the data
was entered into JMP IN, we constructed 5 histograms to show the frequency distribution
for the number of lines starting with each of our word and letter types. Once our
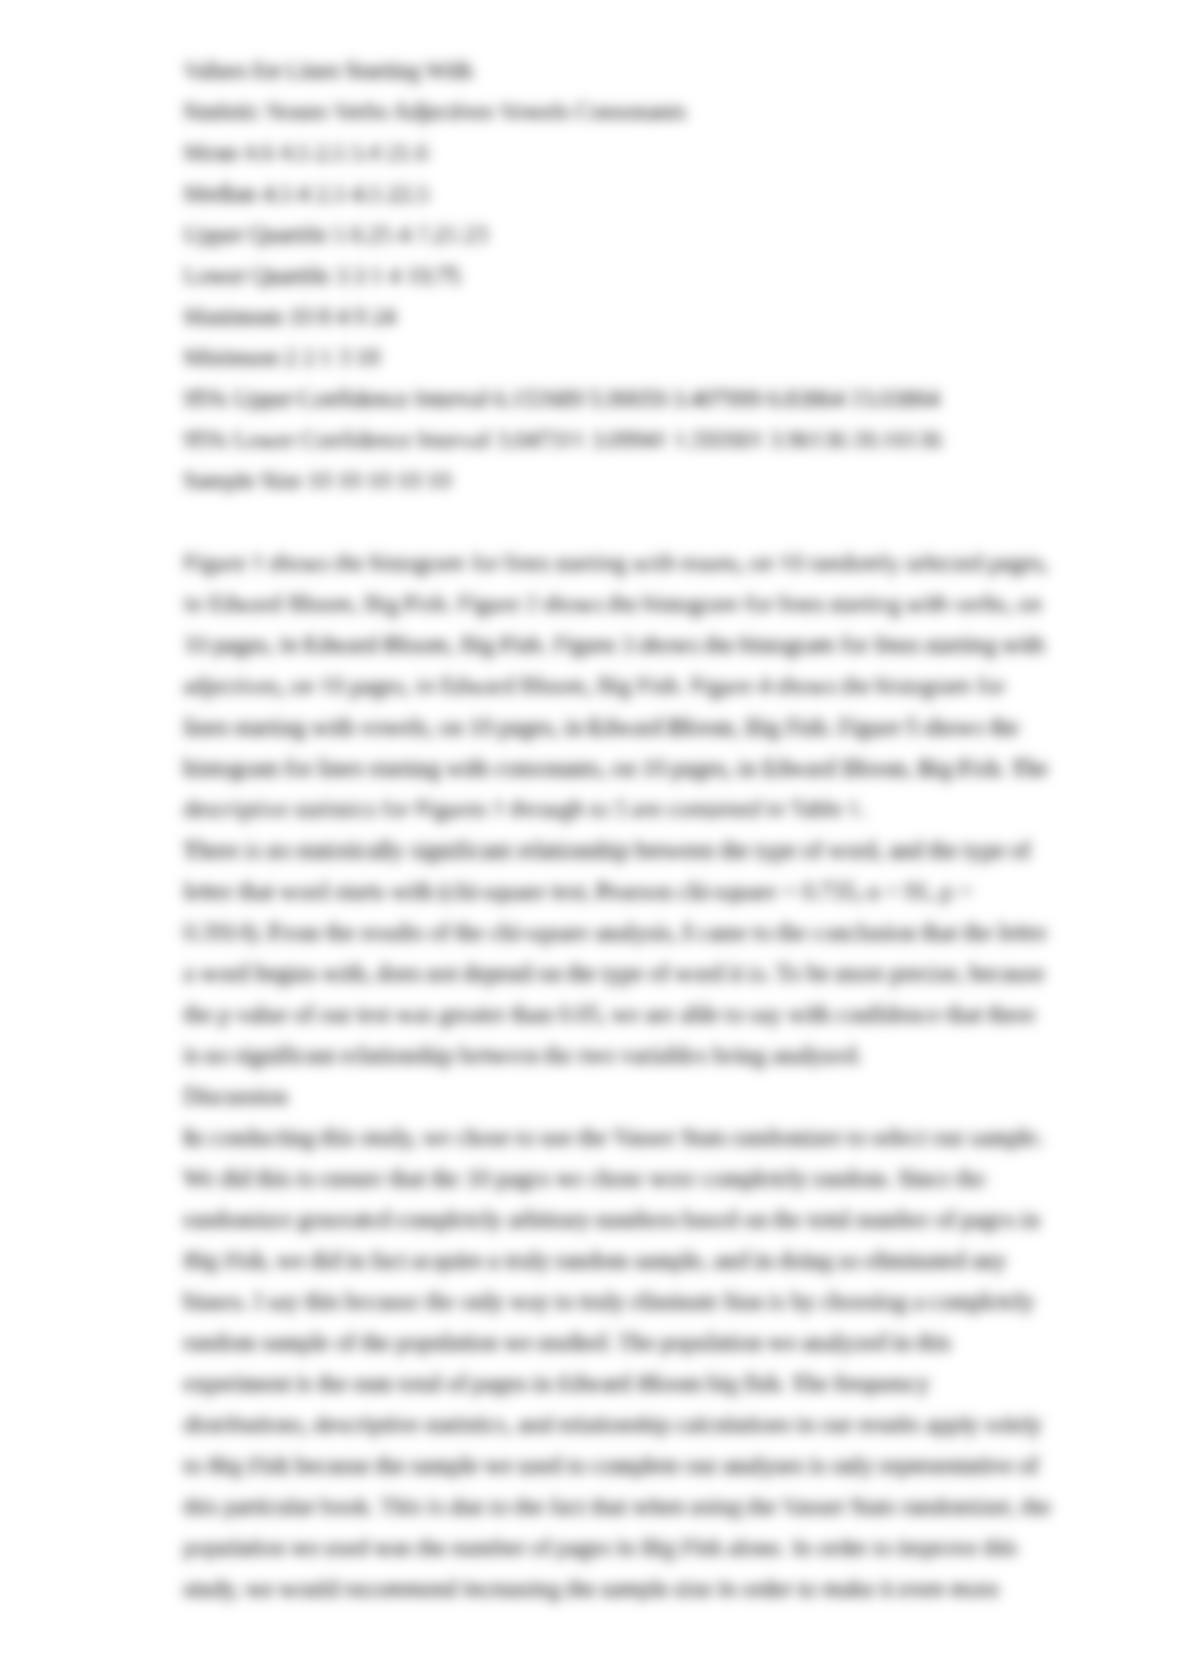
histograms were created, we took a look at the descriptive statistics for each of our
histograms and summarily grouped the 5 sets of data in a table. The descriptive statistics
we chose to include were; the mean, median, maximum, minimum, upper quartile, lower