2/19/2015
Data Analysis Methods
Mid-Term Project
Govind Ramchander
Vinay Gupta
Utkarsh Srivastava
MS–IS

1
Report:
Goal: The goal of the report is to study the factors and how they would impact the landing
distance of a commercial flight so that the risk of landing overrun is reduced.
Approach: We have landing data of 800 commercial flights to help us analyse and model
the equation to find out the distance based on the other parameters in the data supplied.
We will be following the below steps to achieve the final model.
1. Import data from the csv file.
2. Clean data based on the below requirements
a. Duration should be always greater than 40mins.
b. Ground speed should be between 30mph and 140mph.
c. Air speed should be between 30mph and 140mph.
d. Height should be at least 6m.
e. Distance should be less than 6000 feet.
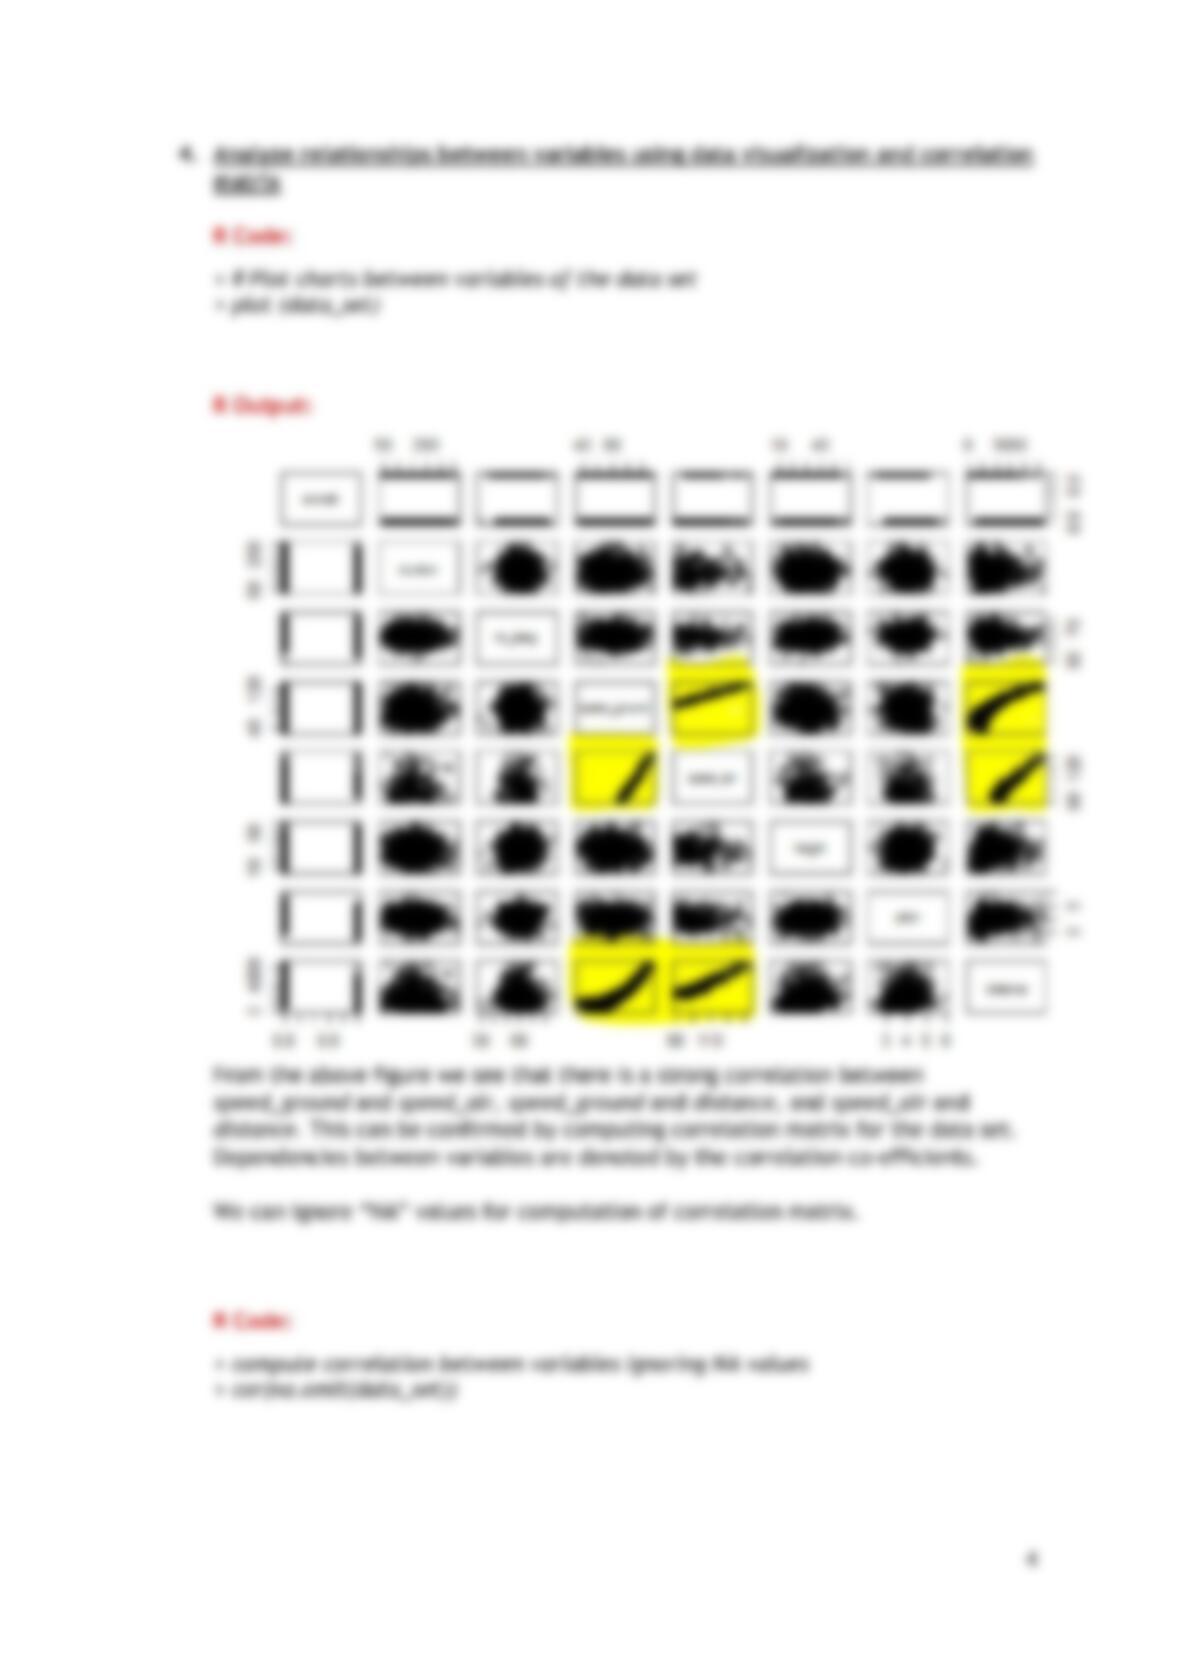
3. Examine correlations between different variables in the data set.
4. Perform fitting into multiple linear regression model.
5. Re-explore and re-model data to find the most important parameters that impact
the landing distance.
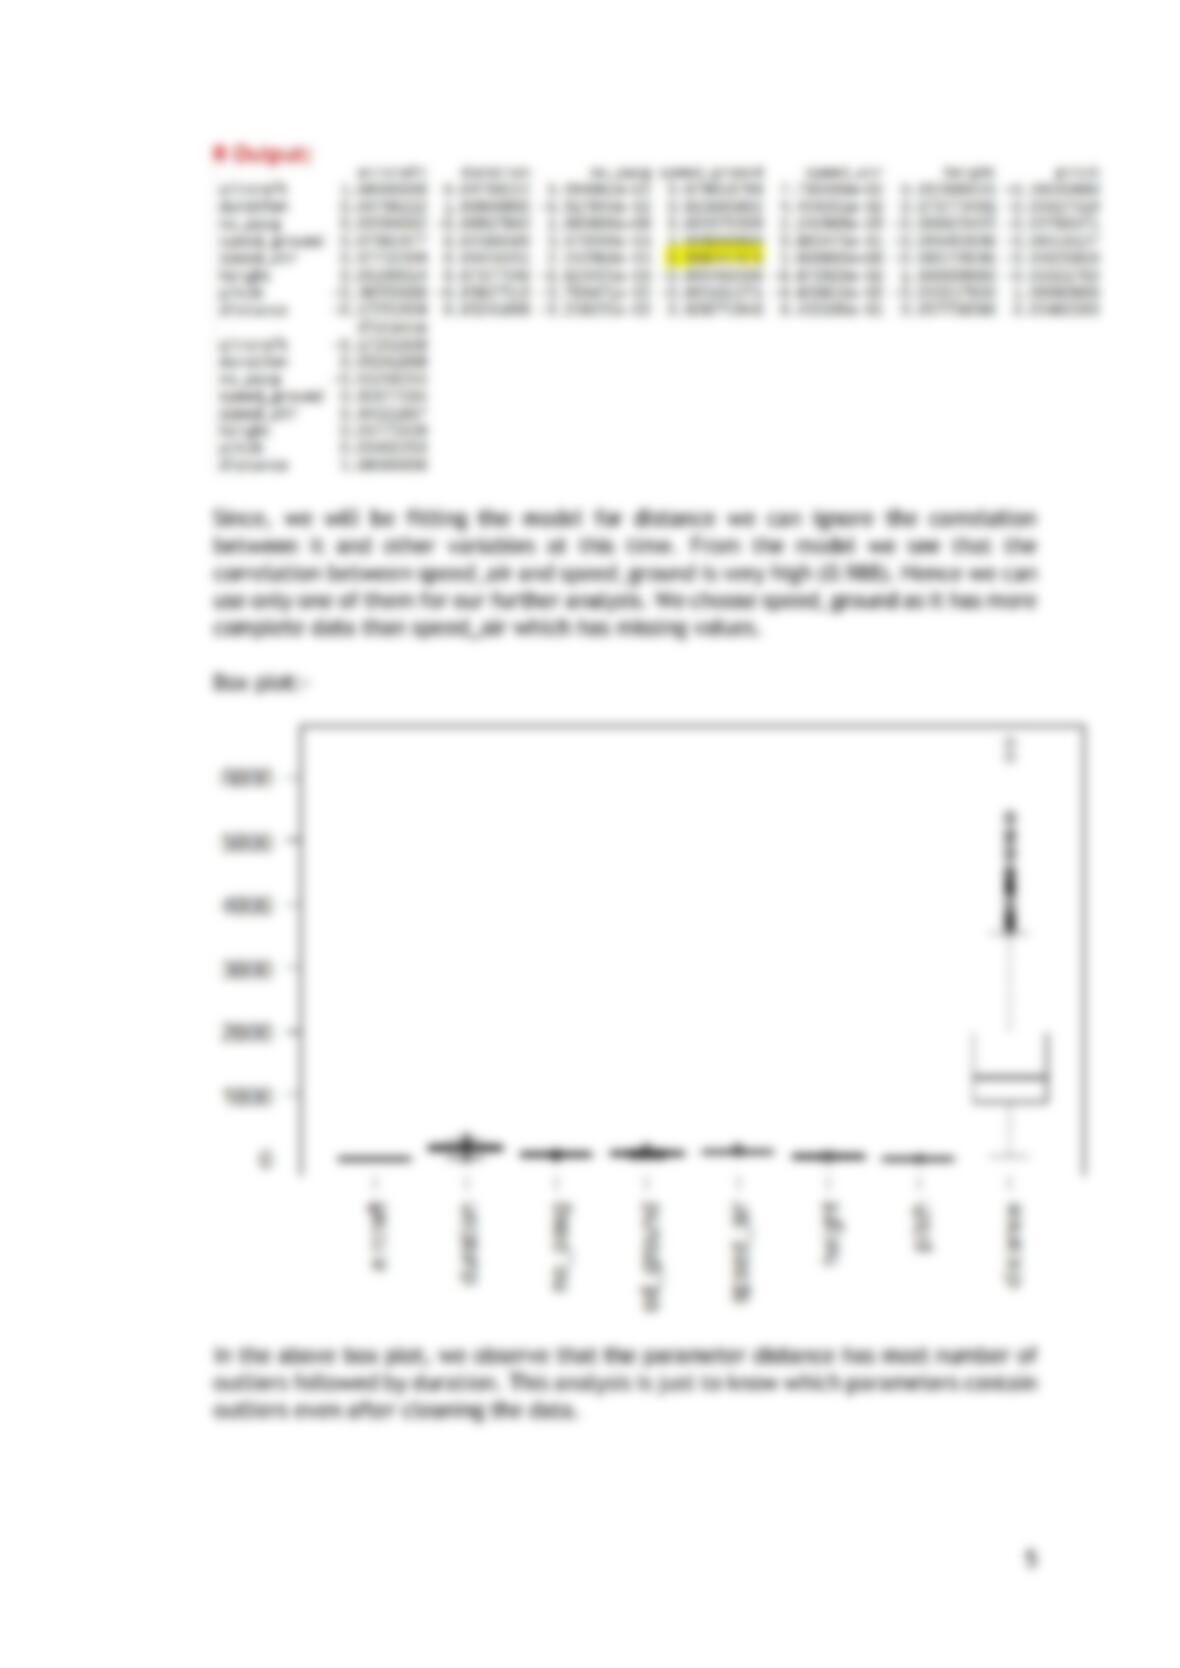
Result: We found that speed_ground and speed_air have a strong correlation. Hence we
chose to retain only speed_ground in our model as it was complete (i.e. no missing values)
and also to prevent multi-collinearity. A Multiple Linear Regression model fit was then
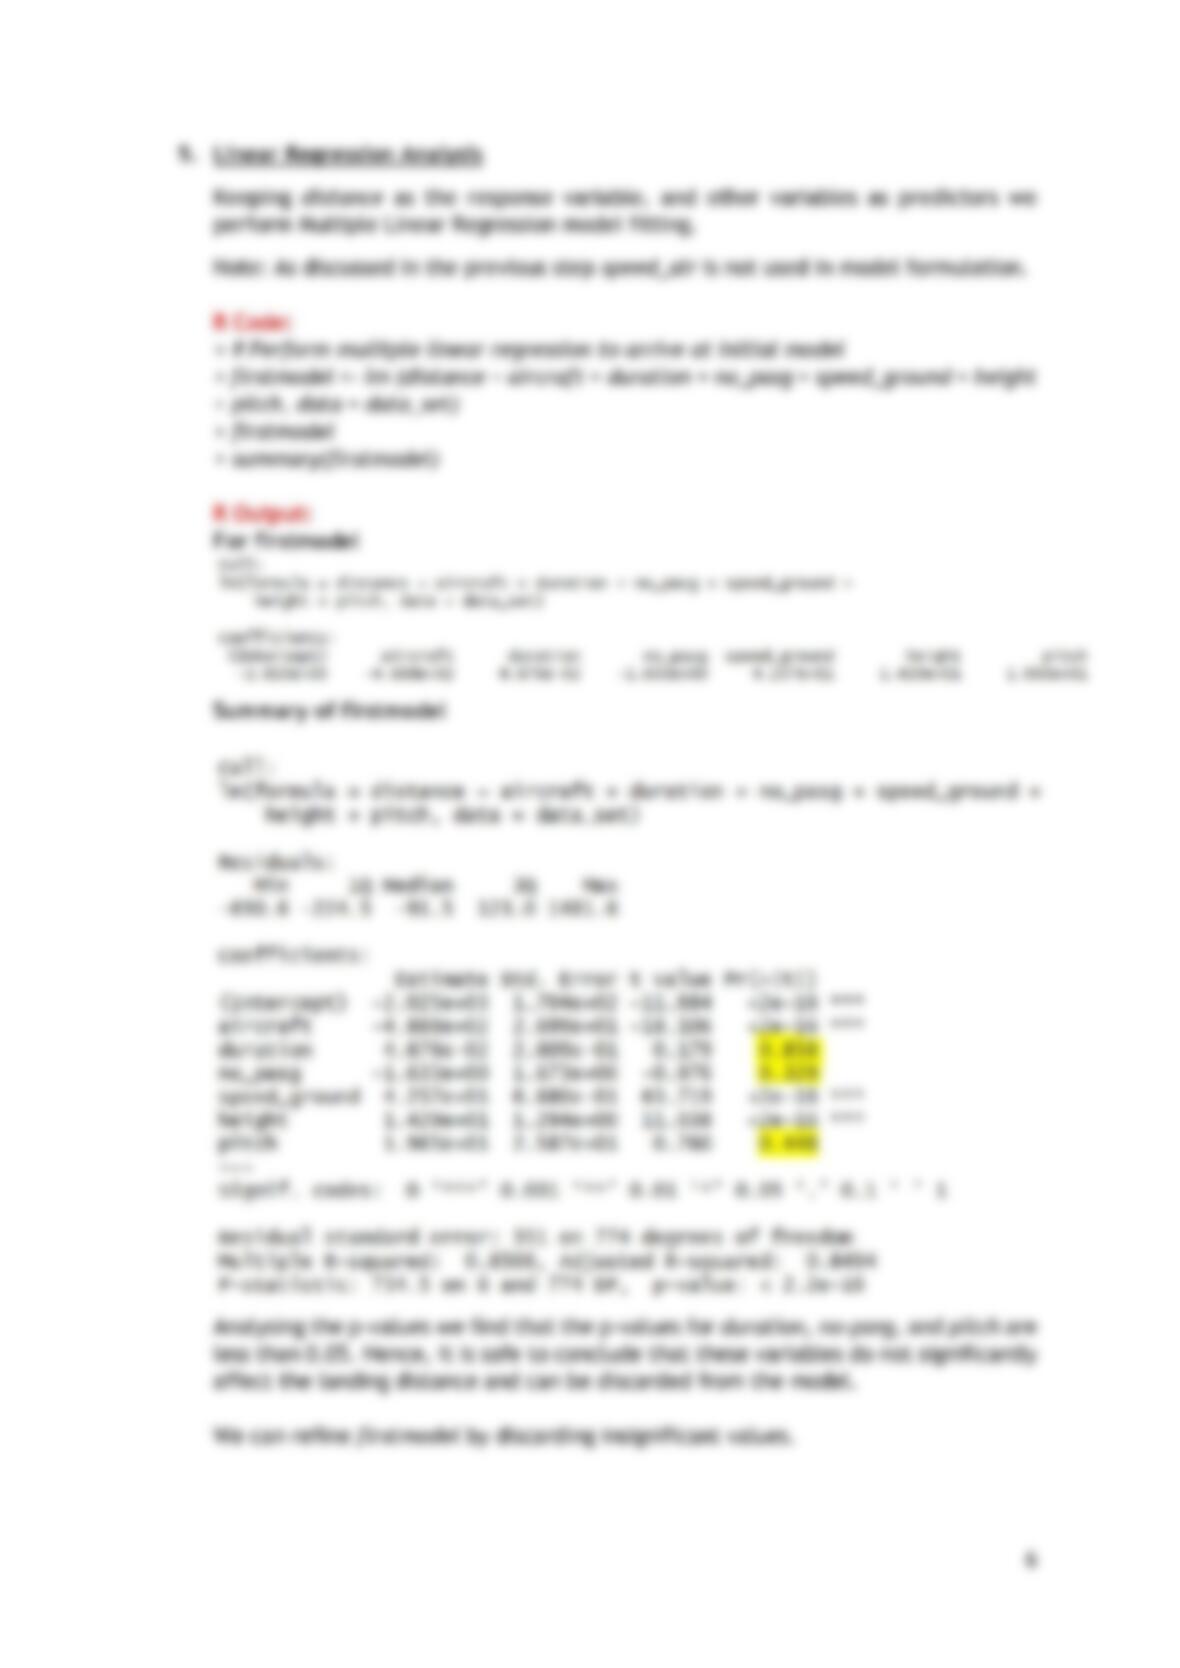
done, assuming that distance is affected by all other variables of the dataset. In our first
iteration, firstmodel, we eliminated 3 factors viz. duration, no_pasg, and pitch from our
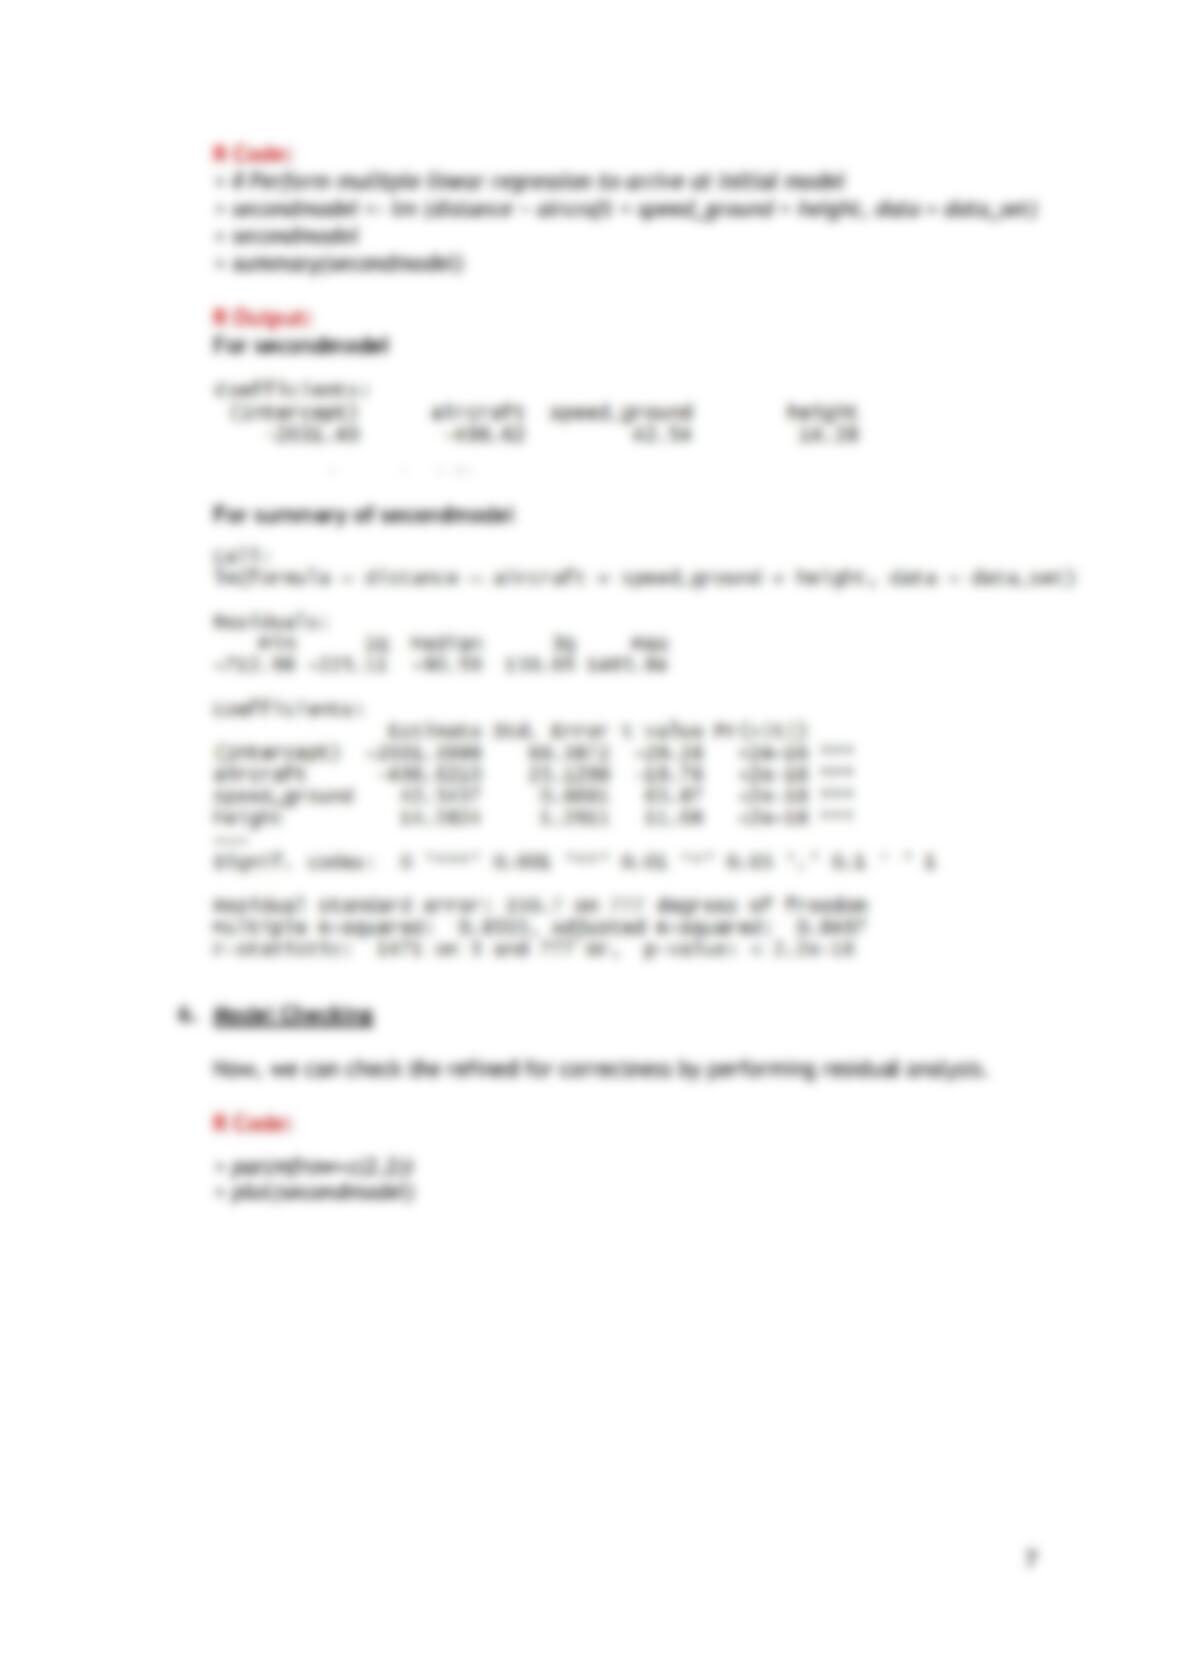
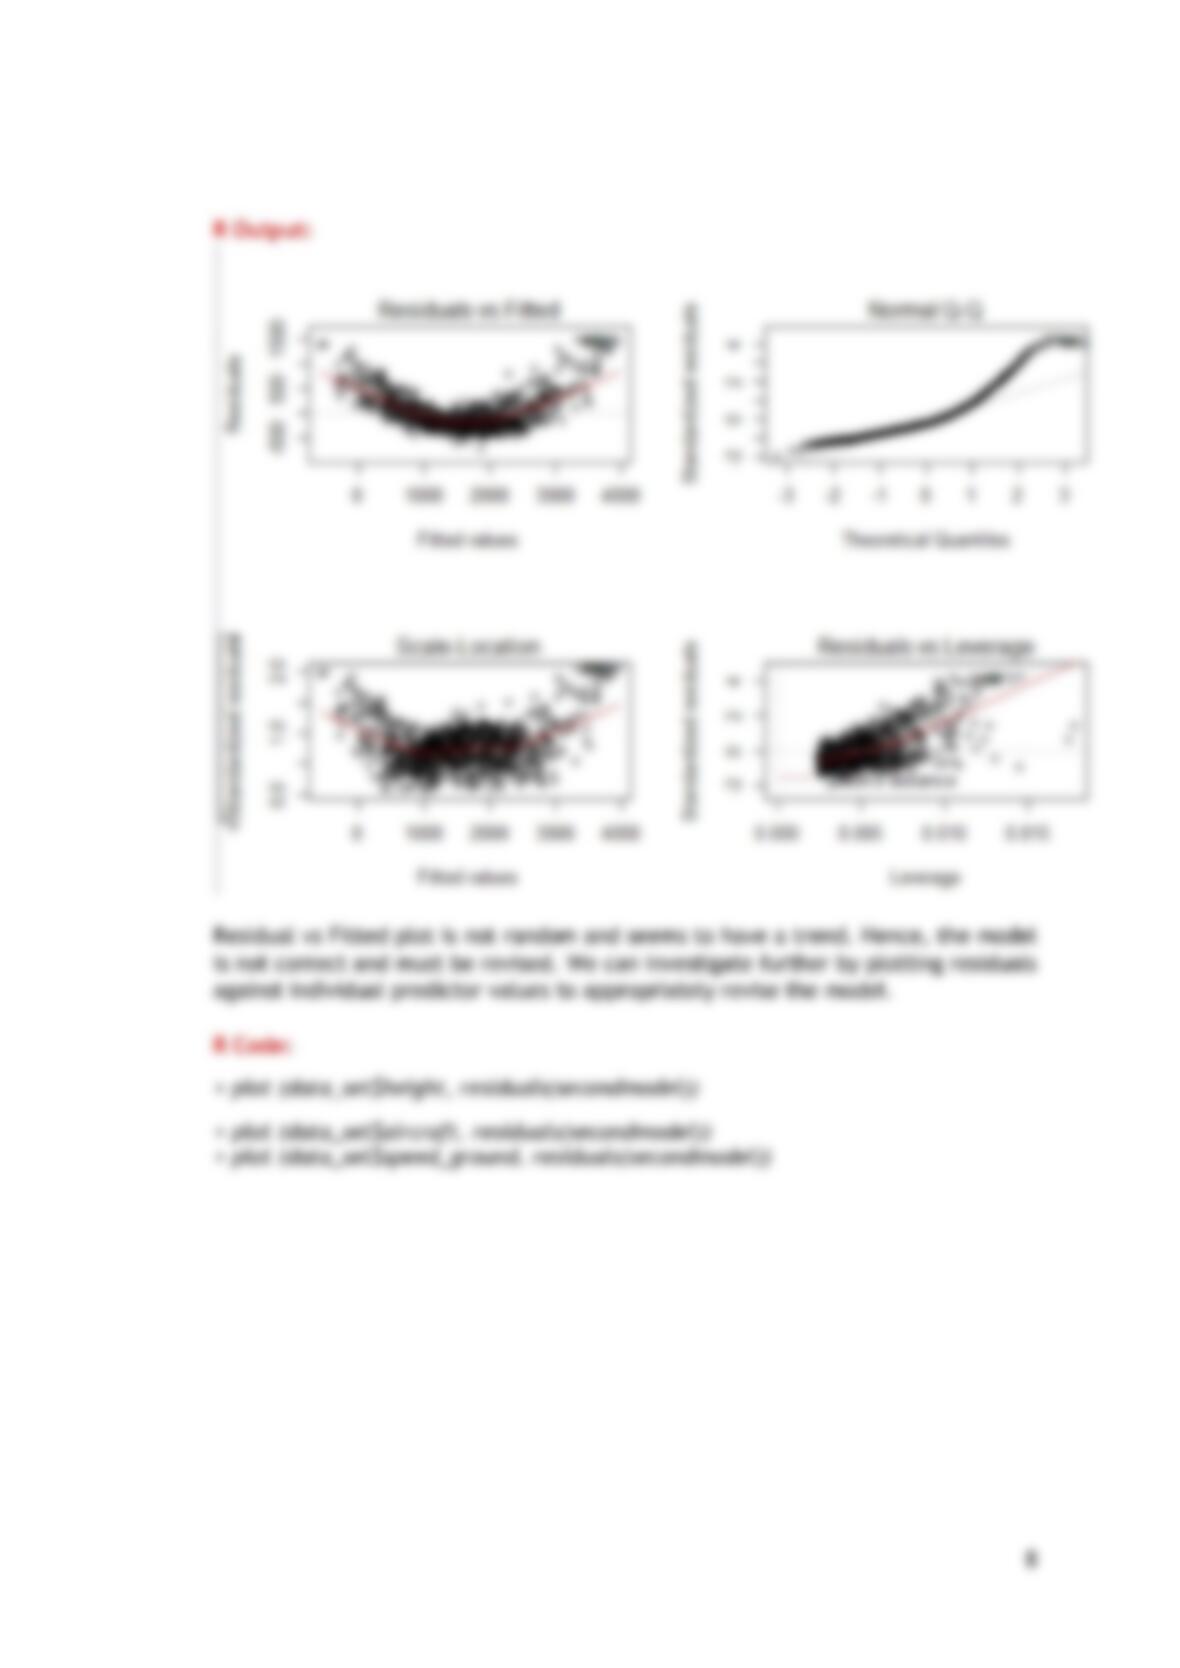
model since it did not significantly affect our response. In the next model we left these
variables out and went on to perform residual analysis on it check its correctness. We
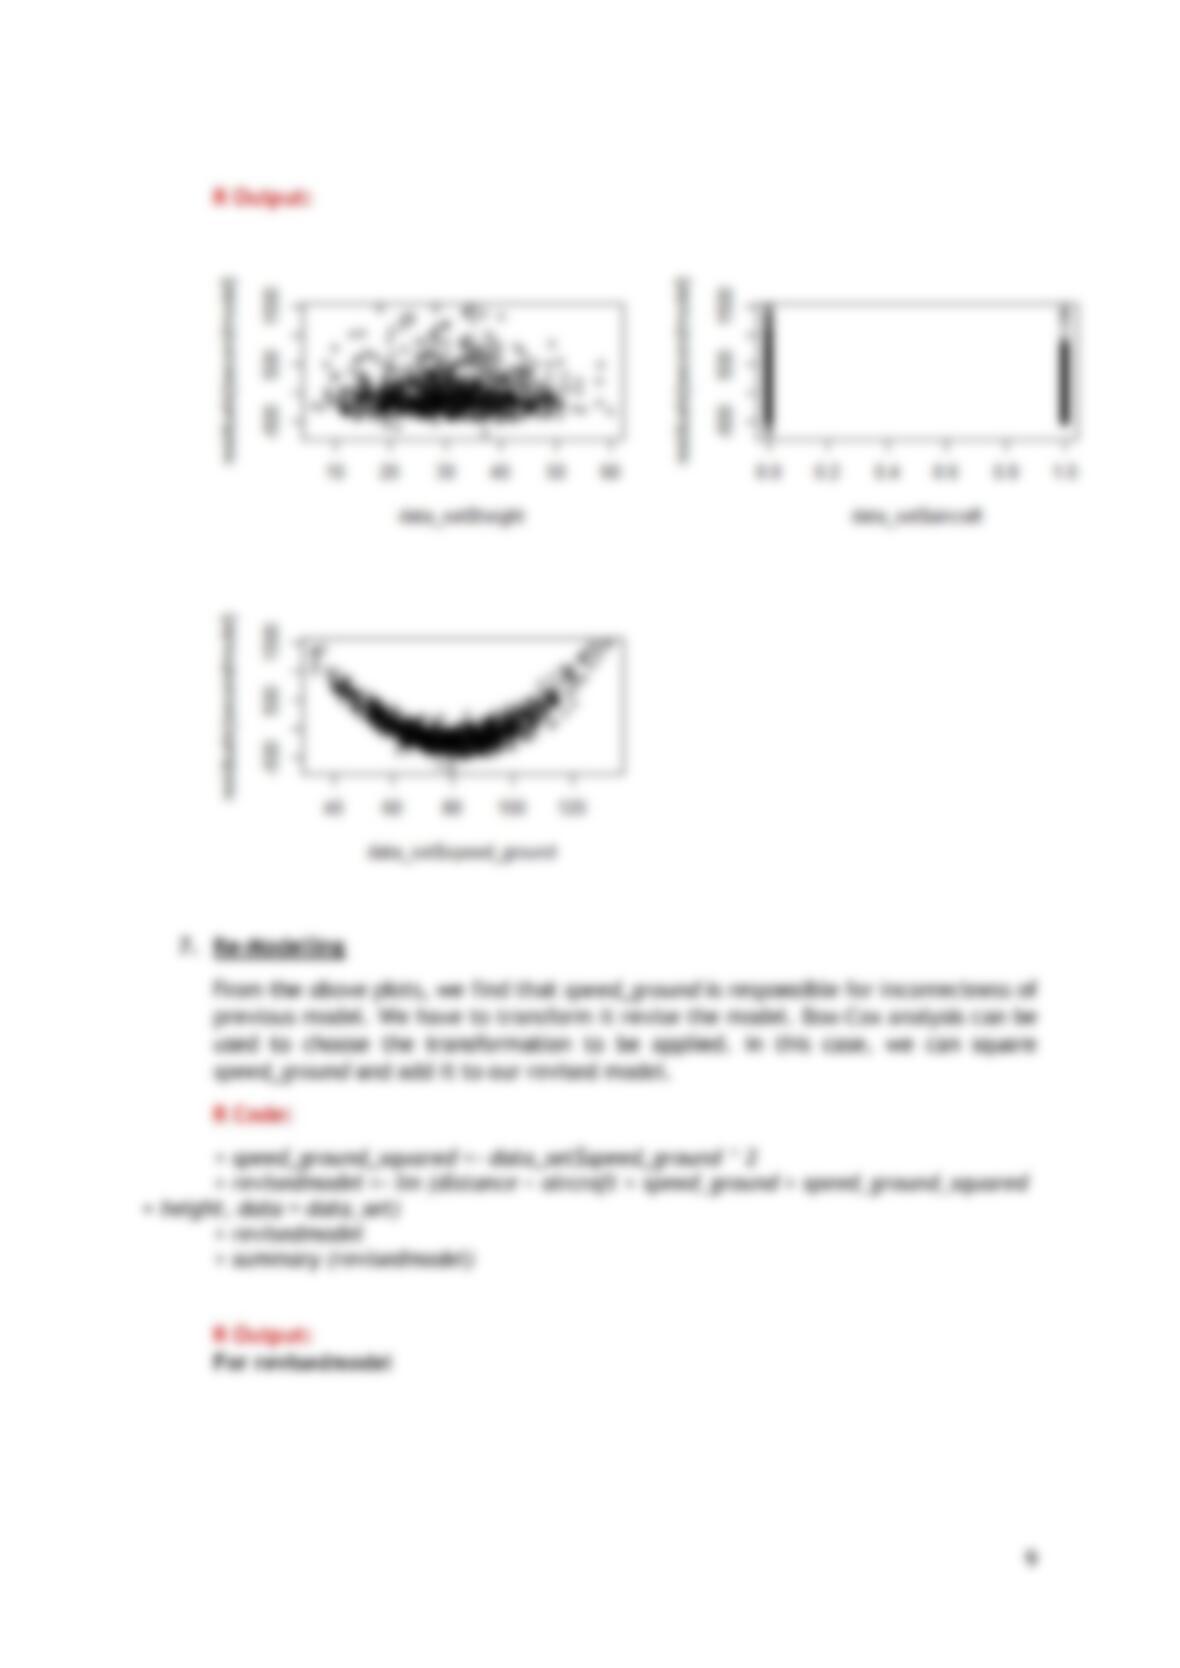
found that residuals followed a trend with respect to the speed_ground variable and hence
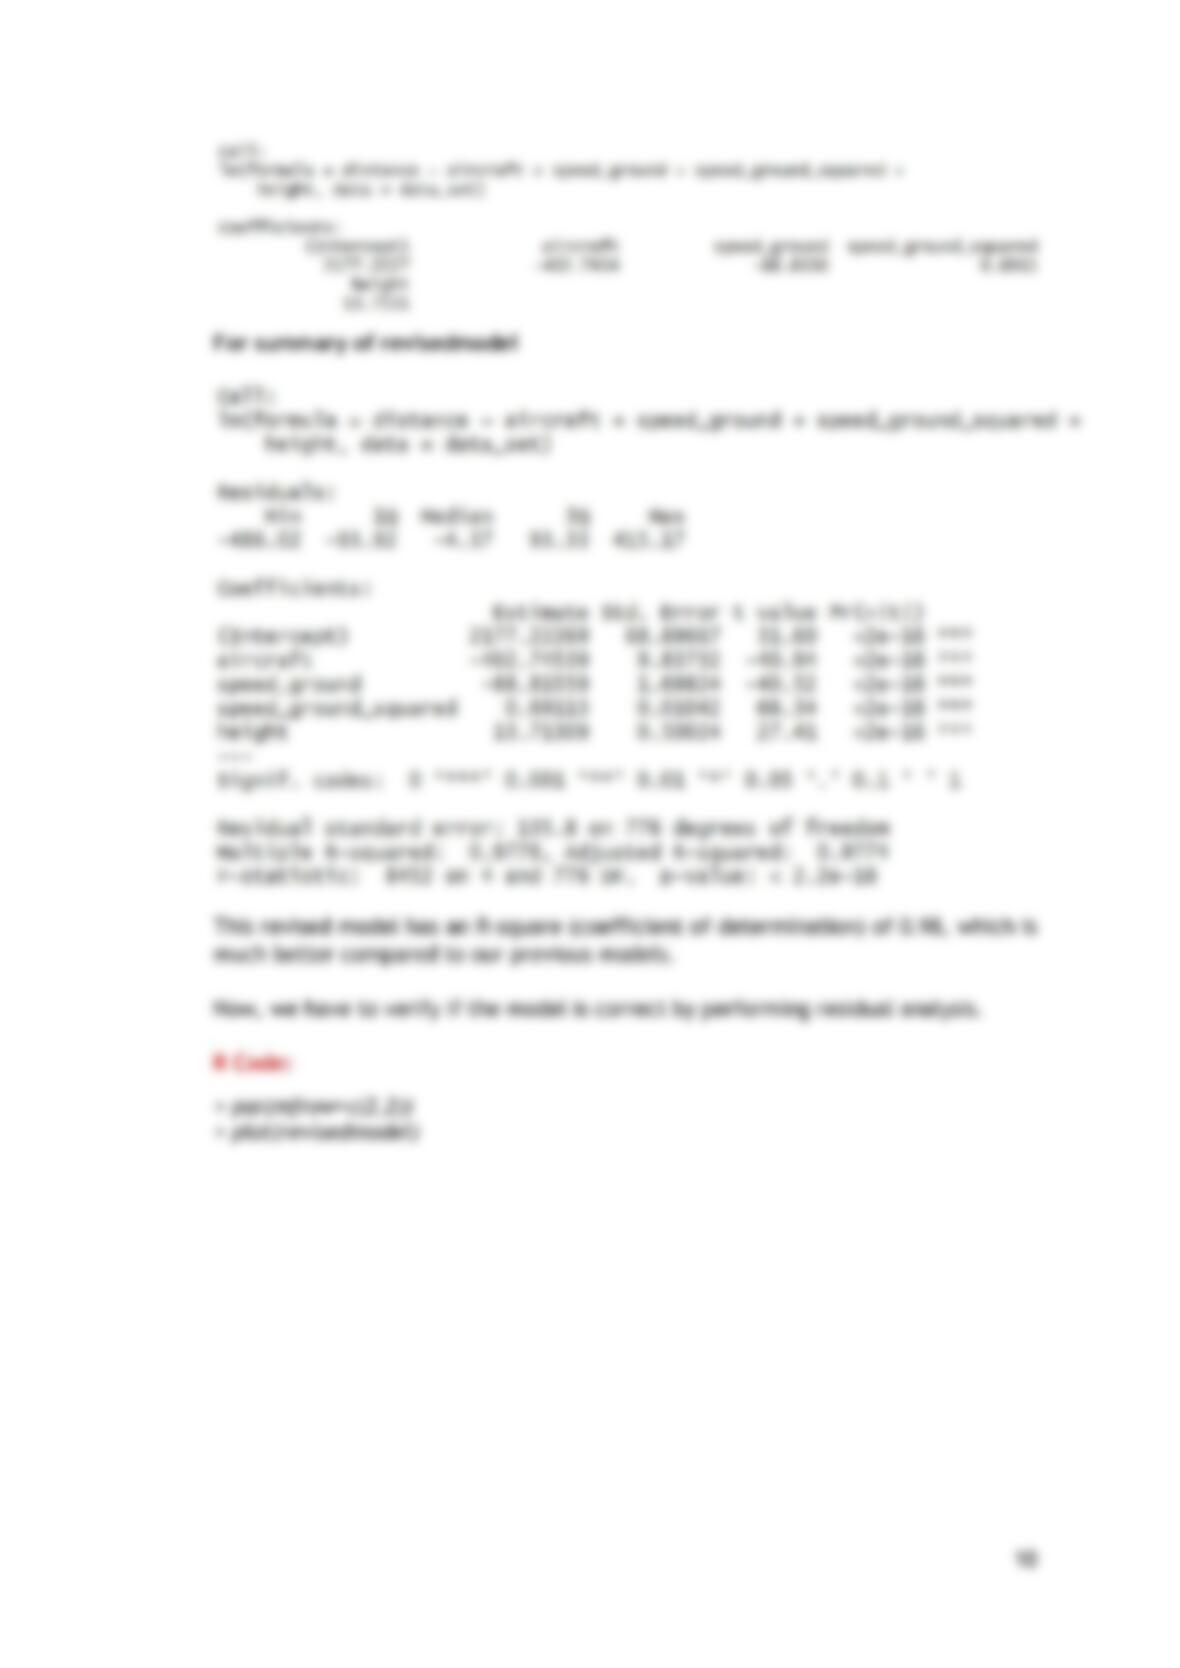
we revised our model to include the squared value of speed_ground. Our final model,
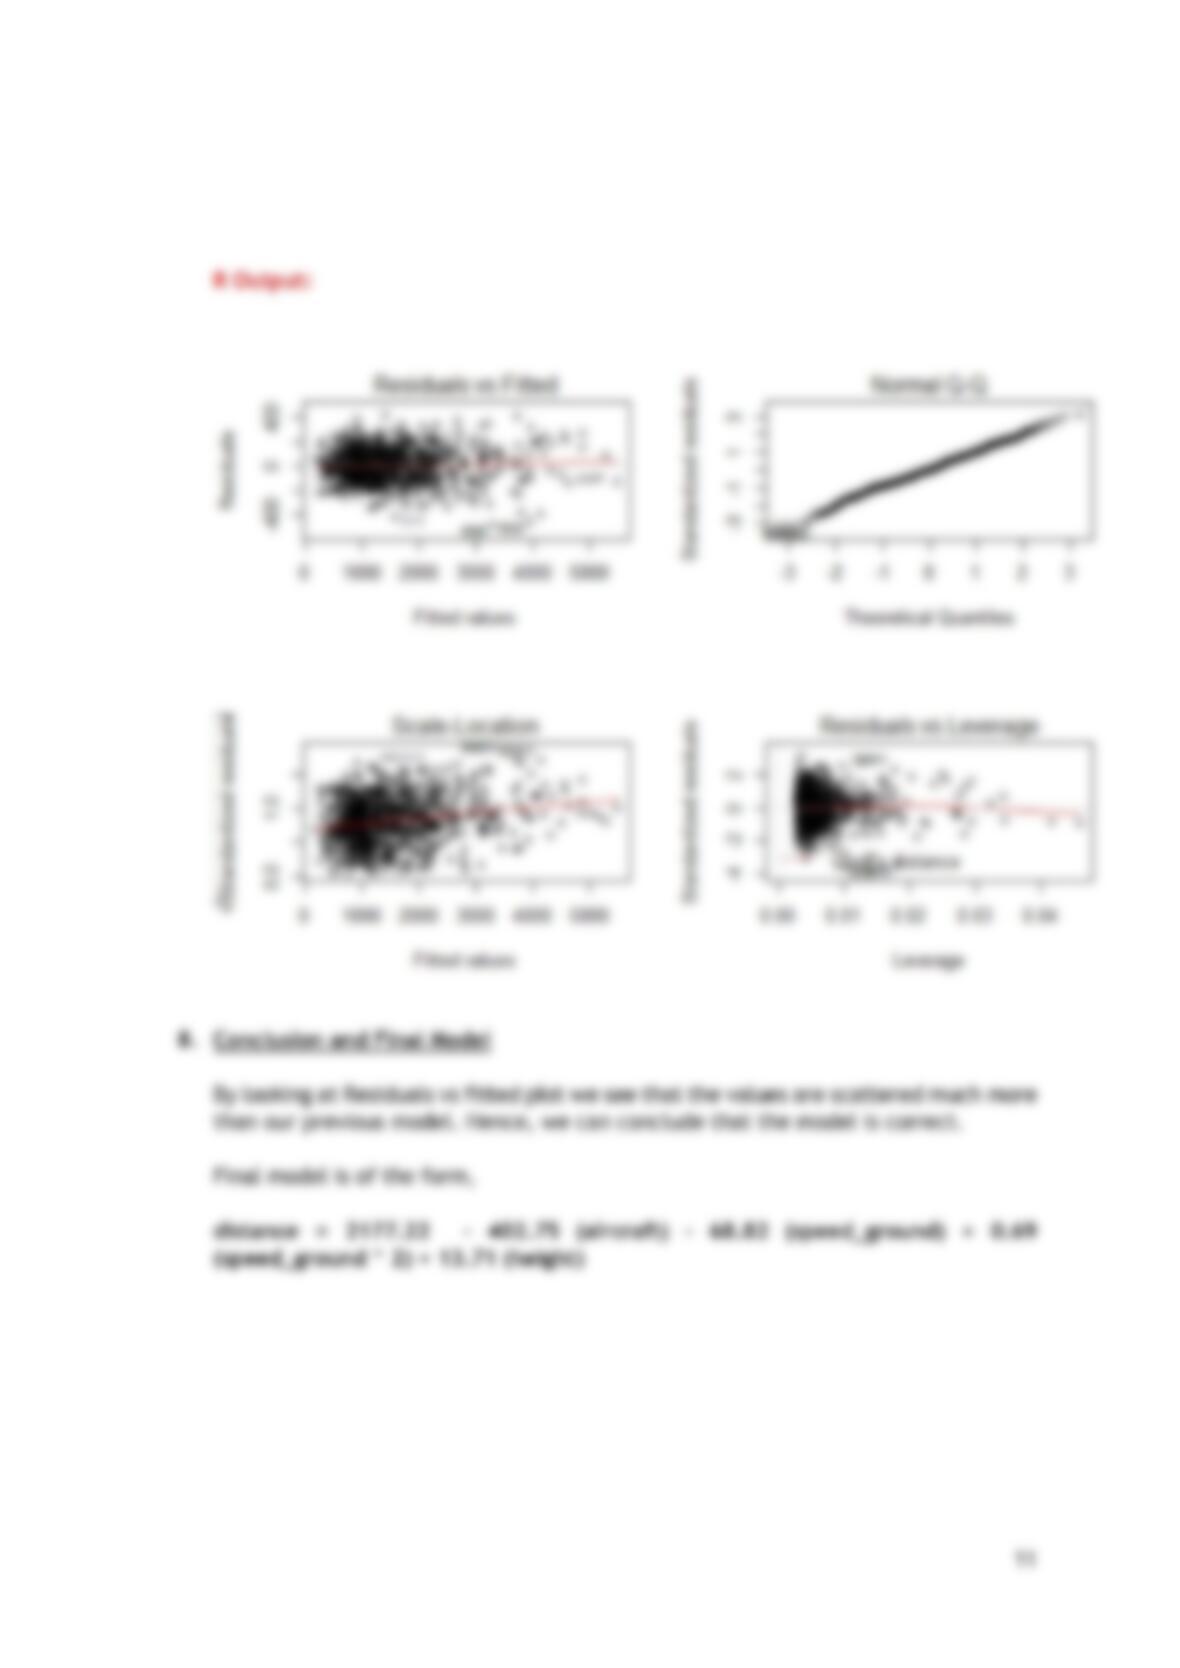
revisedmodel, showed randomness for variation of residual values and also had an r-square
value of nearly 98% so we retained it. Our final model is of the form
distance = 2177.22 – 402.75 (aircraft) – 68.82 (speed_ground) + 0.69
(speed_ground ^ 2) + 13.71 (height)
Steps:
1. Importing data from Landing.csv file into R and analyse summary statistics
R Code:
> # Set working directory to the location containing CSV file
> setwd (“C:/Users/hp/Desktop/R”)
> # read the csv file into data_set
> data_set <- read.csv (file=”Landing.csv”, header = TRUE, sep = “,”, quote = “\””,
dec = “.”)
> summary(data_set)

2
R Output:
Parameter
Minimum
1st
Quartile
Median
Mean
3rd
Quartile
Maximu
m
Duration
14.76
119.49
153.95
154.01
188.91
305.62
No. of Passengers
29.00
55.00
60.00
60.13
65.00
87.00
Ground Speed
27.74
65.87
79.64
79.54
92.33
141.22
Air Speed
90.00
96.16
100.99
103.83
109.48
141.72
Height
-3.55
23.39
30.15
30.12
36.98
59.95
Pitch
2.284
3.66
4.02
4.01
4.39
5.93
Distance
34.08
900.95
1267.44
1544.52
1960.44
6533.05
Table 1: Summary statistics of numeric variables
At this stage the data has been imported into R and assigned to data_set data
frame.
From the summary statistics in Table 1, we can observe that distance’s median is
less than its mean so it is positively skewed. Same is the case with air speed. For
the rest of the parameters the data seems to be normally distributed, since the
value of mean and median is almost the same.
2. Cleaning the data
R Code:
> # Delete observations for flight having duration less than 40 minutes
> temp <- which(with(data_set, data_set$duration < 40))
> data_set <- data_set[-temp,]
> # Delete observation for flight having ground speed less than 30 MPH or greater
than 140 MPH
> temp <- which(with(data_set, data_set$speed_ground < 30 |
data_set$speed_ground > 140 ))
> data_set <- data_set[-temp,]
> # Delete observation for flight having height less than 6 meters
> temp <- which(with(data_set, data_set$height < 6))
> data_set <- data_set[-temp,]
> # Delete observation for flight having landing distances greater than 6000 ft
> temp <- which(with(data_set, data_set$distance > 6000))
> data_set <- data_set[-temp,]
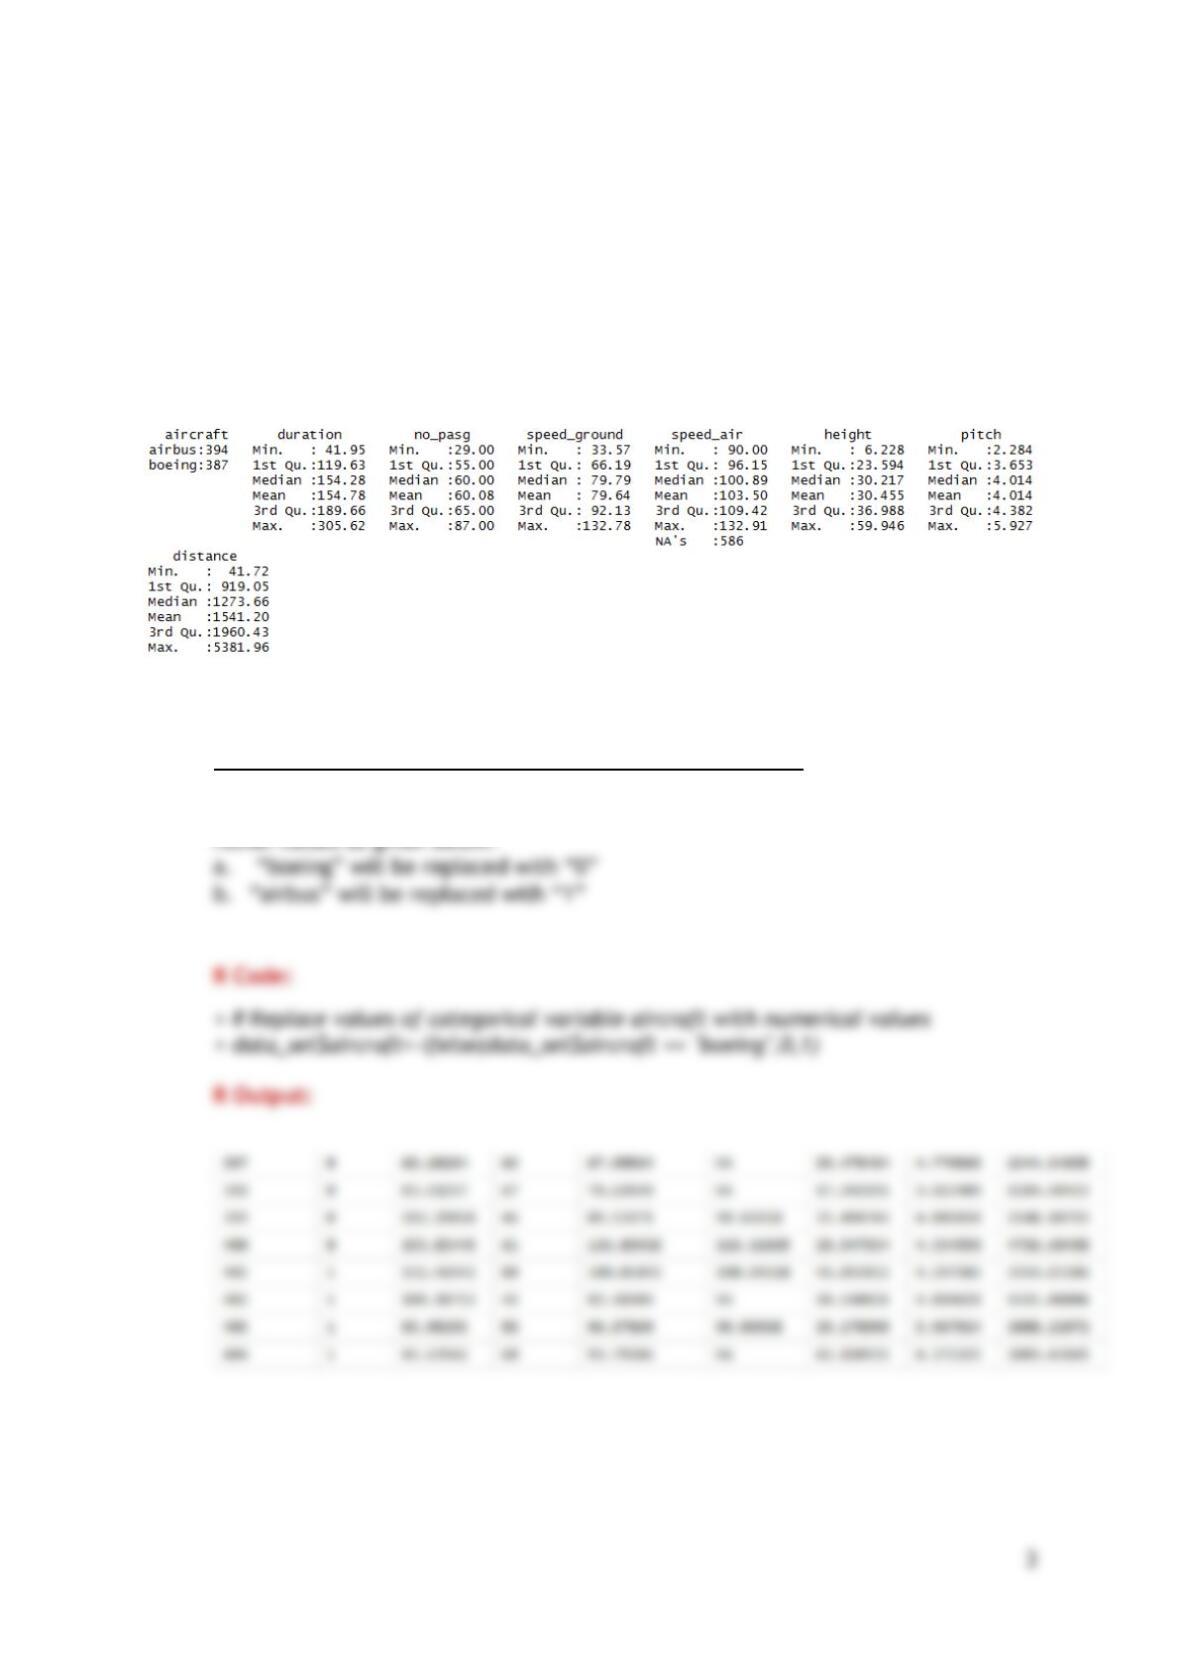
>summary(data_set)
Note: deletions need not be applied for speed_air variable since it is taken care by other
deletion conditions.
R Output:
Looking at the summary above, we can say that our data frame (data_set) is in sync with
the requirements.
3. Replace categorical variable values with numerical values
We cannot use categorical values for analysis, and hence we convert them into