Question-1. In this question pre and post-privatization of CTC’s situation is evaluated in
terms of operational and financial indicators. Pre-privatization and post-privatization periods
are 1988 and 1989, respectively. Firstly,
Operational effectiveness is assessed via
• Fixed asset turnover
• Total asset turnover and
• Equity Turnover
Financial effectiveness is assessed via
• return on sales,
• return on equity, and
• return on assets
Then, operational indicators (Exhibit-6) and dividend performance (Exhibit-9) are used.
According to the calculation, return on sales was lower than that of post-privatization period
so that one can assert that CTC performed better in generating profit per dollar sales.
Likewise, return on equity and return on asset ratios are better in 1989.
Return on equity was 12% in 1988 and it was close to 20% in 1989 meaning that for every
dollar of shareholders’ equity, CTC earns 12 and 20 and cents in profit in 1988 and 1989,
respectively.
To interpret, 1-dollar purchase of asset translates into a 8 cent gain for the company in 1988
and this turns out to be 12 cent in 199 indicating that CTC has done better inmanaging its
assets to generate earnings in the post-privatization period.

In the Exhibit-9, CTC’s cash dividend history is provided which shed light on the dividend
payout of the company. Before proceeding, it is worth providing the definition of the interim
and final dividend. An interim dividend is a dividend payment made before a
company’s final financial statements. Final dividends are announced and paid out on an
annual basis along with earnings. Interim dividend payment was 35.93 CP in 1986 and it
increased to 46.02 in 1989. On the contrary, final cash dividend was 25.56 CP in 1987 and
it became 9.06 in post-privatization period. In total, dividend payment increased from 35.93
in 1986 to 55.08 in 1989. Therefore, these figure tells us that CTC, even after privatization,
did not decreased the cash dividend payment to generate additional source of fund to invest.
Pre-privatization
return on sales
return on equity
return on assets
1988
0,3862
0,1236
0,0845
Post-privatization
return on sales
return on equity
return on assets
1989
0,4171
0,2082
0,1213
As for the operational performance, CTC has better operational ratios in post-privatization
period as well. First of all, fixed asset turnover was around 14,5% in 1988 and it became
14,6%. It is a slight improvement indicating that CTC can generate 14,5 cent per 1 dollar
fixed asset in 1988 and this turned out to be 14,6 in 1989.
Asset turnover show the extent to which CTC can generate sales’ revenue based on the value
of its assets. Accordingly, it increased from 1988 to 1989. Differently, CTC performed better
in the post-privatization period. Total asset turnover was around 10% in 1988 and became
11% in 1989 showing increased ability to generate revenue from assets.
In the same vein, equity turnover shows the ability to generate revenue per equity. This ratio
increased from 15% in 1988 to 19% in 1989. Therefore, I can conclude that ability of CTC
to generate revenue per equity has improved remarkable.
Pre-privatization
Fixed asset
turnover
Total asset
turnover
Equity turnover
1988
0,1458
0,1068
0,1562
Pre-privatization
Fixed asset
turnover
Total asset
turnover
Equity turnover
1989
0,1462
0,1124
0,1934
Together with these, I also use Exhibit-6 to assess the operational effectiveness of the CTC.
Accordingly, number of telephones has raised tremendously from 820,260 to 894,825
meaning that CTC has more customers and in turn generated more revenue in the post-
privatization period. Other indicators such as telephones per 100 inhabitants, number of lines
installed, lines in service were all improved compared to the pre-privatization period (1986,
1987, and 1988)
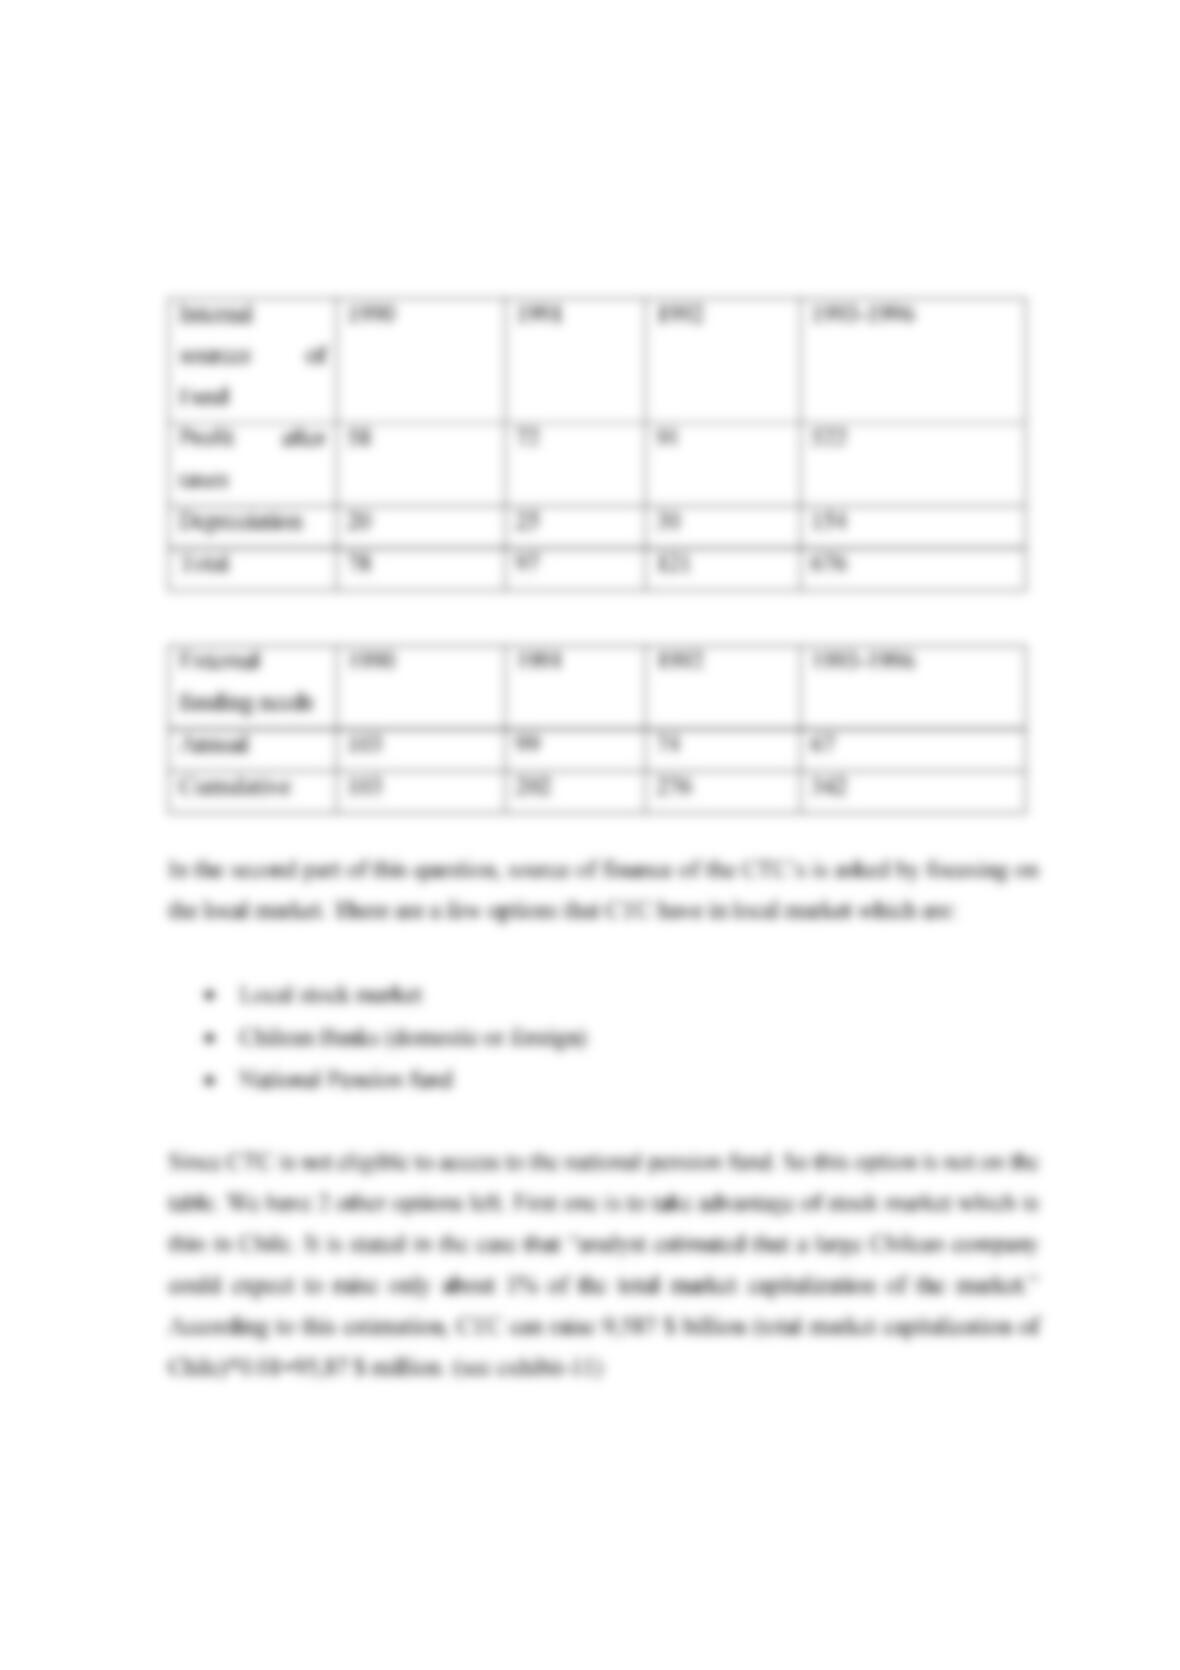
Uses of Fund
1990
1991
1992
1993-1996
Capital
expenditures
121
115
89
270
Changes in the
net WC
14
23
34
55
Dividends
46
58
72
418