CORPORATE PROFILE
PETRONET LNG LIMITED,
January 2020

DISCLAIMER
Any information contained in this presentation should not be
taken as being a representation about facts and projection or
promise of performance, whether financial, operational or
otherwise. Nothing contained in this presentation should be
considered an invitation to transact in our securities or an offer
of our securities. This presentation is made specifically for
purposes of the meeting in which this is being presented and
not for any other purpose. You may determine that such
information may be regarded as forward-looking but we
make no assurance about any projection, extrapolation or
interpretation of the same that you may make. The
information contained herein should be treated with utmost
confidentiality and not used for any purpose. You are advised
to obtain legal advice on the nature and character of the
information and on implications of being in possession of the
same.

OVERVIEW
Global & India’s Primary Energy Consumption Scenario
India’s Gas Scenario, Infrastructure
Role of LNG in India
About Petronet’s
Dahej & Kochi Terminals
New Initiatives
Performance
3

PRIMARY ENERGY CONSUMPTION (mtoe) –WORLD
Source : BP Statistical Review-June 2019 4
Fuel 2008 %2018 %
Oil 4143 35% 4662 34%
Coal 3503 30% 3772 27%
Gas 2578 22% 3309 24%
Nuclear 620 5% 611 4%
Hydro 737 6% 949 7%
Renewables 124 1% 561 4%
Total 11705 100% 809 100%

PRIMARY ENERGY CONSUMPTION (mtoe) –INDIA
Source : BP Statistical Review-June 2019 5
Fuel 2008 %2018 %
Oil 149 31% 239 30%
Coal 259 54% 452 56%
Gas 34 7% 50 6%
Nuclear 31% 91%
Hydro 26 5% 32 4%
Renewables 51% 27 3%
Total 478 100% 809 100%
INDIA –A MAJOR GAS/LNG CONSUMER
14th largest gas consumer –58 bcm (~158 mmscmd)
4th largest LNG importer –31 bcm (~82 mmscmd)
Economy growing at CAGR of about 6-7% with similar growth in Energy Consumption
Government aims to significantly increase share of Natural Gas in Indian Energy basket to in
coming years
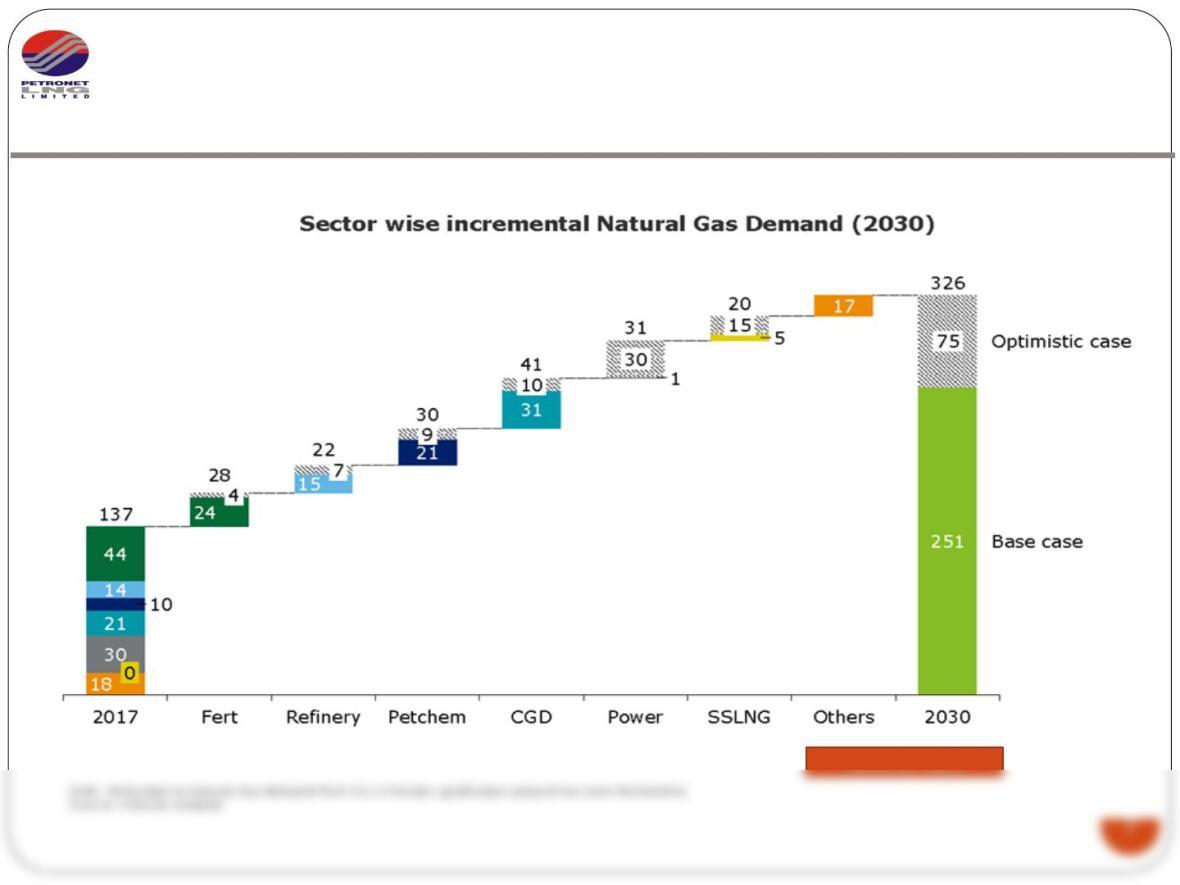
Despite increase in domestic gas production- dependency on imported gas to increase
substantially
Pipeline network– developing into a national grid- needs to grow faster, connecting new
markets
Source : PPAC, BP Statistical Review June 2019 & Vision 2030, Natural Gas Infrastructure in India
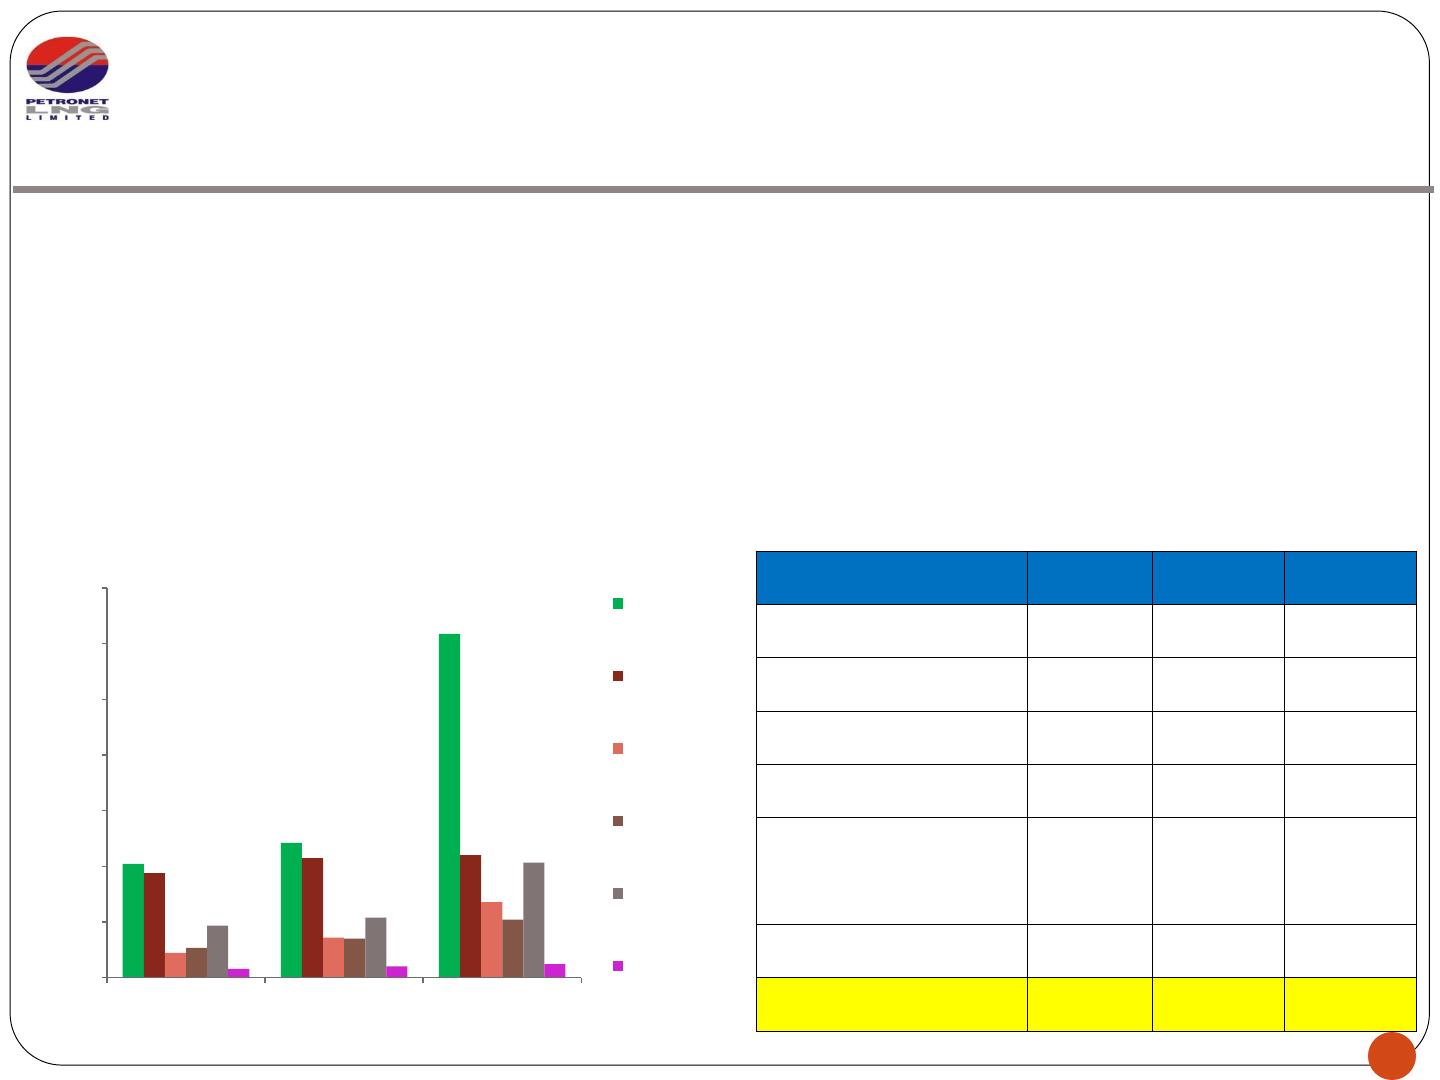
SECTOR WISE PROJECTED GAS DEMAND (mmscmd) Sector
2016
–
17
2019–20 2026–27
Power 157 202 309
Fertilizer 97 106 110
City Gas 22 36 68
Industrial 27 35 52
Petchem/ Refineries /
Internal Cons. 47 54 103
Sponge/ Iron/ Steel 810 12
Total Realistic Demand
358 443 654
6
0.00
50.00
100.00
150.00
200.00
250.00
300.00
350.00
2016-17 2019-20 2026-27
Power
Fertilizer
City Gas
Industrial
Petchem/
Refineries /
Interal Cons.
Sponge/
Iron/ Steel
GAS DEMAND IN INDIA