Journal of Hunger & Environmental Nutrition, 9:498–511, 2014
Copyright © Taylor & Francis Group, LLC
ISSN: 1932-0248 print/1932-0256 online
DOI: 10.1080/19320248.2014.962768
Individual and Neighborhood Predictors of
Participation in the Supplemental Nutrition
Assistance Program (SNAP) in Los Angeles
County
M. PIA CHAPARRO,1∗GAIL G. HARRISON,1and ANNE R. PEBLEY1,2,3
1Department of Community Health Sciences, Fielding School of Public Health,
University of California Los Angeles, Los Angeles, California, USA
2California Center for Population Research, University of California Los Angeles,
Los Angeles, California, USA
3Department of Sociology, University of California Los Angeles, Los Angeles,
California, USA
Using data from the Los Angeles Family and Neighborhood Survey,
we investigated individual and neighborhood-level predictors of
participation in the Supplemental Nutrition Assistance Program
(SNAP) among eligible households in Los Angeles County. Among
eligible groups, those with lower participation rates included older
people, married couples, Hispanics, and those living in higher
income neighborhoods. Reporting poor physical and/or mental
health was associated with higher odds of SNAP participation.
Future studies should focus on disentangling the relationship
between poor health and SNAP participation, as well as on studying
the pathway by which neighborhood resources may impact SNAP
participation.
KEYWORDS SNAP, Los Angeles County, neighborhoods
∗M. Pia Chaparro is currently affiliated with the Centre for Health Equity Studies (CHESS),
Stockholm University and Karolinska Institutet.
Address correspondence to M. Pia Chaparro, MS, PhD, Centre for Health Equity
Studies (CHESS), Stockholm Universitet & Karolinska Institutet, Sveavägen 160, floor 5, 10691
Stockholm, Sweden. E-mail: pia.chaparro@chess.su.se
498
Participation in SNAP 499
INTRODUCTION
The Supplemental Nutrition Assistance Program (SNAP) is a federal pro-
gram designed to alleviate hunger by providing financial assistance for food
purchases to low-income households in the United States.1In 2011, SNAP,
formerly known as the Food Stamp Program, served approximately 45 mil-
lion people per month or 14% of Americans.1Even though SNAP is an
entitlement program, participation is voluntary; eligible households have
been shown to apply if the perceived benefits are greater than the per-
ceived participation costs.2,3There are 2 main costs associated with applying
to SNAP: stigma and transaction costs; that is, the costs incurred for child care
and transportation and the amount of time needed to get to the SNAP office,
the time spent there, as well as the time spent working on the application.2
In 2009, SNAP reached 72% of those eligible to participate, which was
an all-time high; in 2001–2002, before the recession, only 54% of those
eligible to participate in SNAP chose to do so.1SNAP participation varies
widely by state, with California having the lowest participation rates (53%
in 2009).1SNAP not only benefits those who participate in the program but
also boosts economic activity; it has been found that during economic down-
turns, every dollar invested on SNAP increases economic activity by $1.79.4
A high nonparticipation rate, therefore, may damage not only families that
benefit directly from the financial assistance but also local economies, which
benefit from families’ boost in purchasing power, as well as state economies
which, would benefit from sales tax collection produced by the increase in
consumption.5
Overall, households with children,6,7female-headed households,8those
with lower education,8those with an unemployed or disabled member,6,9
and those with residential instability10 are more likely to participate in SNAP,
whereas households that are food secure,6,7married couples,6,11 those with
higher incomes,7and those who work full-time12 are less likely to participate.
In addition, SNAP participation has been linked to poor mental and physical
health9,10 and worse psychosocial factors (ie, feeling overwhelmed, sad).9
A handful of studies have investigated the contextual determinants of
SNAP participation, including neighborhood-,13 county-,14 and state-level
factors.10 De Marco and De Marco13 analyzed individual- and neighborhood-
level factors associated with the number of social services utilized (a total of
7, including SNAP) in Boston, San Antonio, and Chicago. They found that,
in addition to age, employment status, education, and marital status, per-
ceived neighborhood disorder was positively associated with social service
utilization, whereas informal social control and perceived trust and cohe-
sion were not associated with service utilization. Slack and Myers14 looked
at aggregated county-level SNAP participation in 33 US states (excluding
the Northeast and Northwest) and found that county-level characteristics
(ie, poverty, unemployment, percentage of people with less than a high
500 M. P. Chaparro, G. G. Harrison, and A. R. Pebley
school degree, percentage of female-headed households, percentage Latino)
were positively associated with SNAP participation; however, individual-level
factors were not included in the analysis. Finally, Purtell et al.10 evaluated
SNAP participation in a multilevel model including individual- and state-level
factors like state-level SNAP coverage (proportion of low-income families
receiving benefits) and generosity (average size of benefits), finding that
only individual-level factors predicted SNAP participation.
Although understudied, neighborhood-level characteristics could influ-
ence the decision to participate in SNAP. Households with family or friends
in their neighborhood may use these relationships in times of need15−18 and,
therefore, may be less likely to apply to SNAP. Previous research has shown
that greater social capital is associated with decreased risk for food inse-
curity.15,19 A common coping mechanism of food insecure families is to
borrow food or money from friends/family/neighbors or to rely on them
for child care, to carpool with neighbors to more affordable grocery stores,
and to obtain food from churches or food pantries.15,17,20,21 People with
increased access to these coping mechanisms through stronger neighbor-
hood ties could be in less need for SNAP, especially after considering the
costs associated with SNAP application. Closeness to one’s neighbors could
also translate into greater access to information related to SNAP (ie, how to
apply, eligibility requirements, etc) and, therefore, increased likelihood of
participation.
The objective of this study is to determine what individual and
neighborhood-level factors predict SNAP participation among eligible house-
holds in Los Angeles County (LAC). Studying the factors that predict SNAP
participation could provide valuable information for outreach programs
attempting to improve participation rates.
METHODOLOGY
Data Source
This study uses data from all adult respondents of the Los Angeles Family
and Neighborhood Survey (L.A.FANS), wave 1. L.A.FANS is a longitudinal
study designed to investigate the effects of families and neighborhoods on
children’s development and well-being; the effects of welfare reform at the
neighborhood level; and the process of residential mobility and neighbor-
hood change.22,23 L.A.FANS is based on a stratified probability sample of
65 census tracts in LAC; the strata were very poor (top 10% of the poverty
distribution), poor (60th–89th percentiles), and not poor (bottom 60%) based
on the percentage of people living in poverty in each tract.22,23 Census tracts
were selected within each stratum with probability proportional to popu-
lation size, 20 from the very poor and the poor strata and 25 from the
not poor stratum. About 50 households were interviewed in each tract and
Participation in SNAP 501
households with children were oversampled.23,24 Within each household,
one adult (18+) was selected at random and, in households with children,
one child (<18) was also selected randomly.23 Data collection for wave
1 of L.A.FANS took place between April 2000 and January 2002, collect-
ing information on 3085 households.23 L.A.FANS interviews were conducted
with computer-assisted personal interview in both English and Spanish.23
This study uses data from the L.A.FANS adult and household modules.23
Data Management
SNAP participation is our dependent variable. Survey respondents were
asked whether their family participated in SNAP in the year prior to the
survey. In order to identify eligible non-SNAP participants, we used data
on income, assets, and vehicle ownership and immigration status. Based on
California rules for SNAP participation,25,26 SNAP-eligible households must
pass both the gross and net income determination tests.25 Gross income is
defined as all income from any source including all earned and all unearned
income; the maximum gross income allowed is 130% of the federal poverty
level (FPL).25 The household’s net income must be less than 100% of the FPL
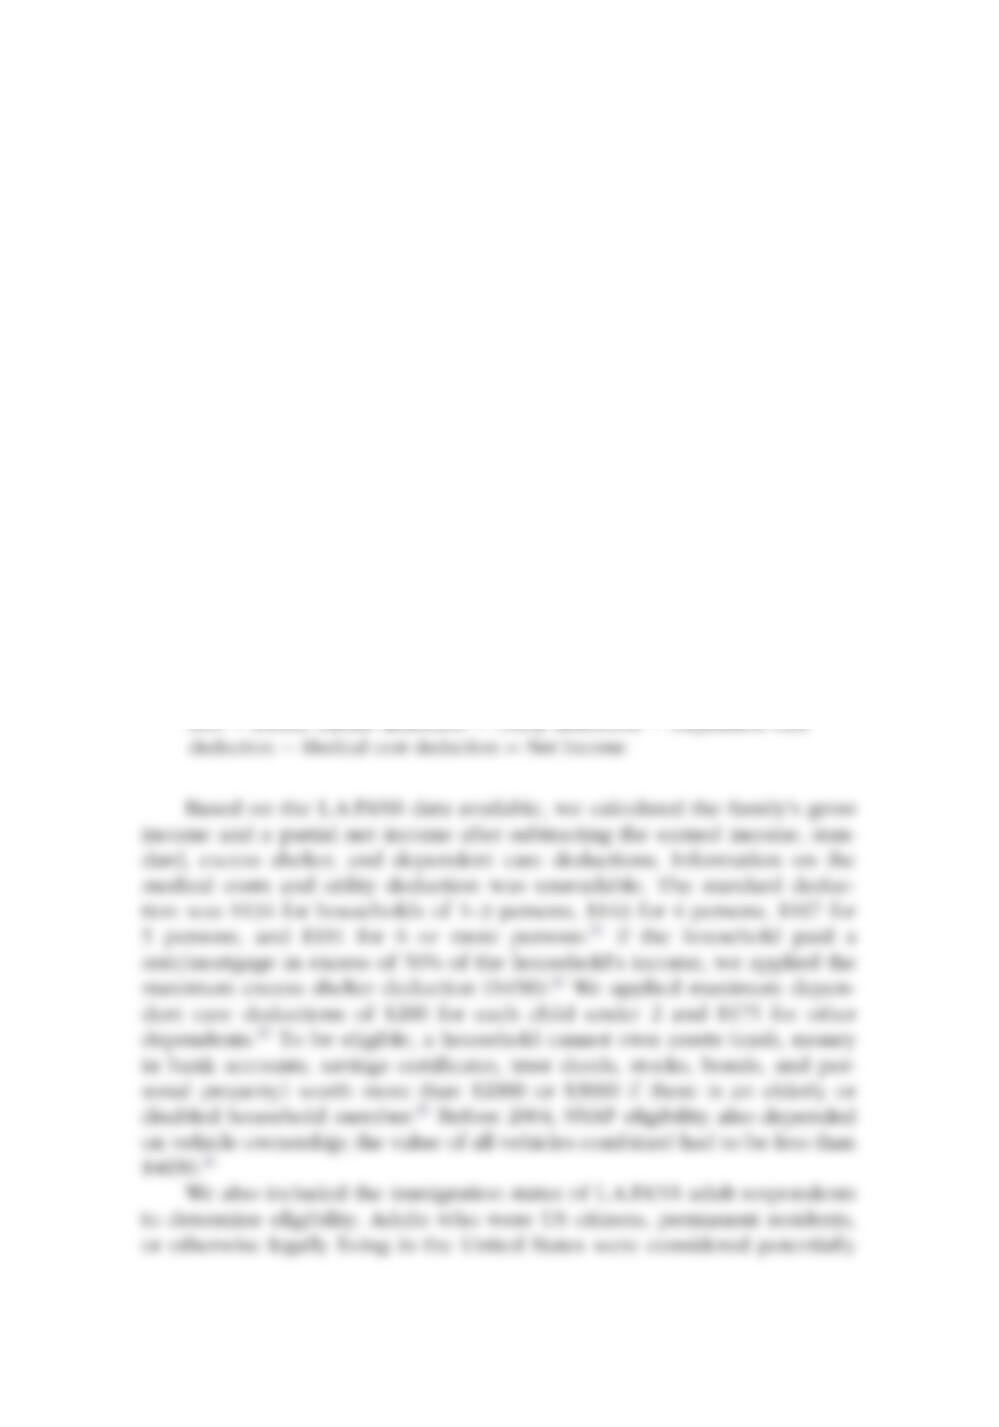
and is calculated as follows25,27:
Gross income −20% Earned income deduction −Standard deduc-