ECON 1005 Principles of Economics I: Microeconomics Semester 1, 2019/20
1
Consumer Choice
1. Individual Consumer Choice
• In this topic, we focus on the demand side and explore the behavior of individual consumers
in detail. To understand any economic choice individuals make, we must know what their
objectives are and the constraints they face in order to achieve them.
• For individual consumers, their objective is to maximize their overall satisfaction from
consuming and they are facing the constraint of spending power.
• How an individual make his consumption choice?
o Among all the affordable choices, he chooses the one that he prefers most.
2. Preferences
• Basic assumptions of consumers’ rational preferences:
o Completeness (People have preferences)
▪ If A and B are any two consumption baskets, the consumer can always rank them so
that one of the following three possibilities is true:
• A is preferred to B, B is preferred to A or A and B are indifferent.
o Transitivity (Logically consistent)
▪ If A is preferred to B and B is preferred to C, then A is preferred to C.
o Non-satiation (More is better)
▪ More of a good is preferred to less of it.
3. Utility Functions
• Utility: a set of numbers that is arbitrarily assigned to reflect the preference ordering of
consumption baskets.
o If a consumer prefers A to B, we would say the utility obtained from A is higher than the
utility obtained from B.
o Hence, it is also commonly interpreted as the measure of overall satisfaction obtained
from consumption.
o It is not possible to compare utilities between different consumers.
• Utility function: shows the relationship between utility measures and quantity of goods
consumed.
𝑈 = 𝑈(𝑞1, 𝑞2, ⋯ , 𝑞𝑛)
where qi is the quantity of good i consumed.
• In a single-good case, the utility function is:
𝑈 = 𝑈(𝑞1)
ECON 1005 Principles of Economics I: Microeconomics Semester 1, 2019/20
2
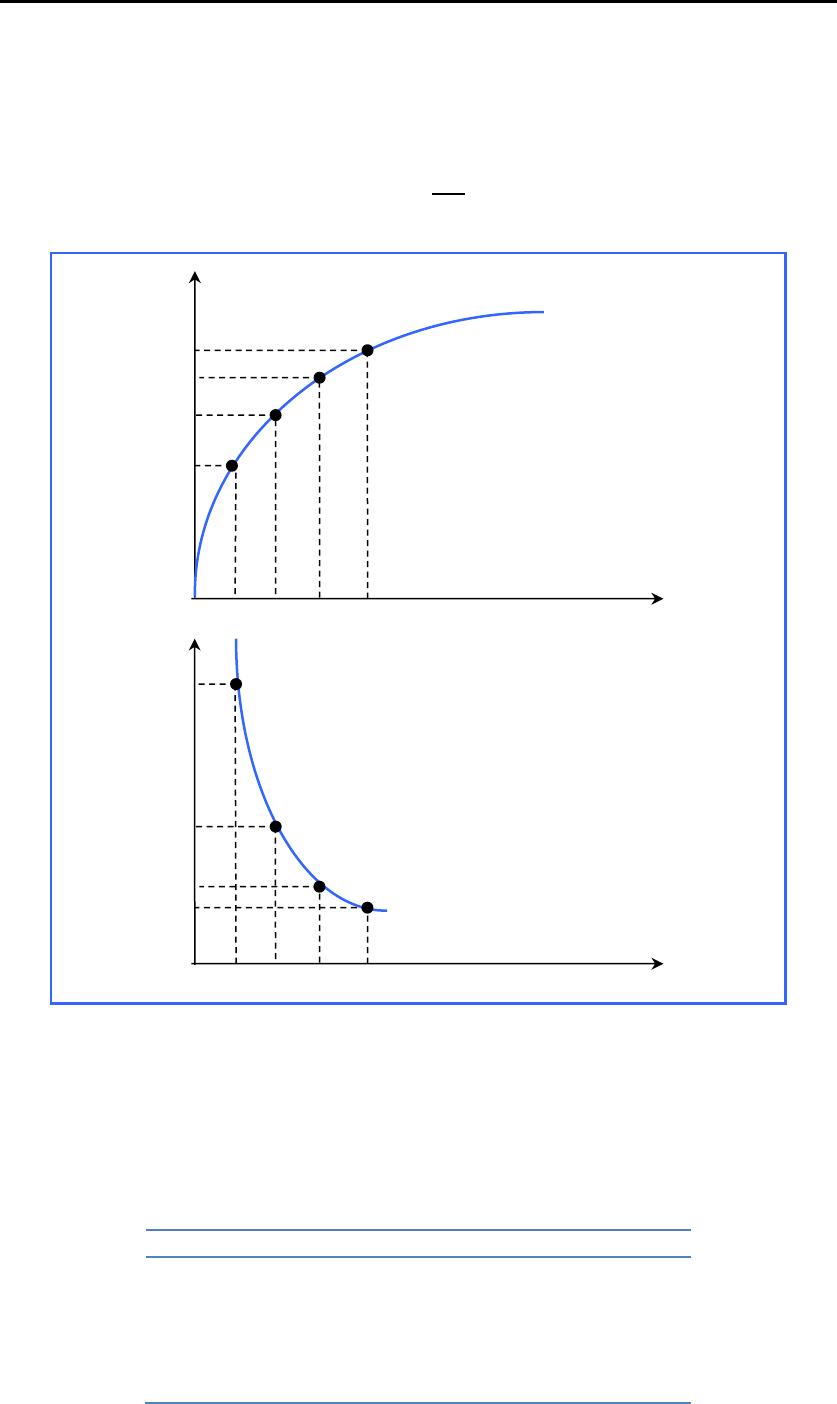
• The total utility curve: the graphical representation of the utility function of a single good.
• Marginal utility: the additional utility that can be obtained by consuming one more unit of a
good.
𝑀𝑈 =∆𝑈
∆𝑞1
• Two important assumptions about utility function:
o More is preferred.
o Diminishing marginal utility
• The utility function of a good for consumer A can also be represented in the form of table as
follow:
Quantity of cola
Total Utility
Marginal Utility
0
0
1
30
30
2
42
12
3
50
8
4
56
6
5
58
2
q1
Total Utility
U
42
30
1
4
2
3
50
56
q1
Marginal Utility
U
8
12
1
4
2
3
6
30
ECON 1005 Principles of Economics I: Microeconomics Semester 1, 2019/20
3
• In a two-good case, the utility function is:
𝑈 = 𝑈(𝑞1, 𝑞2,)
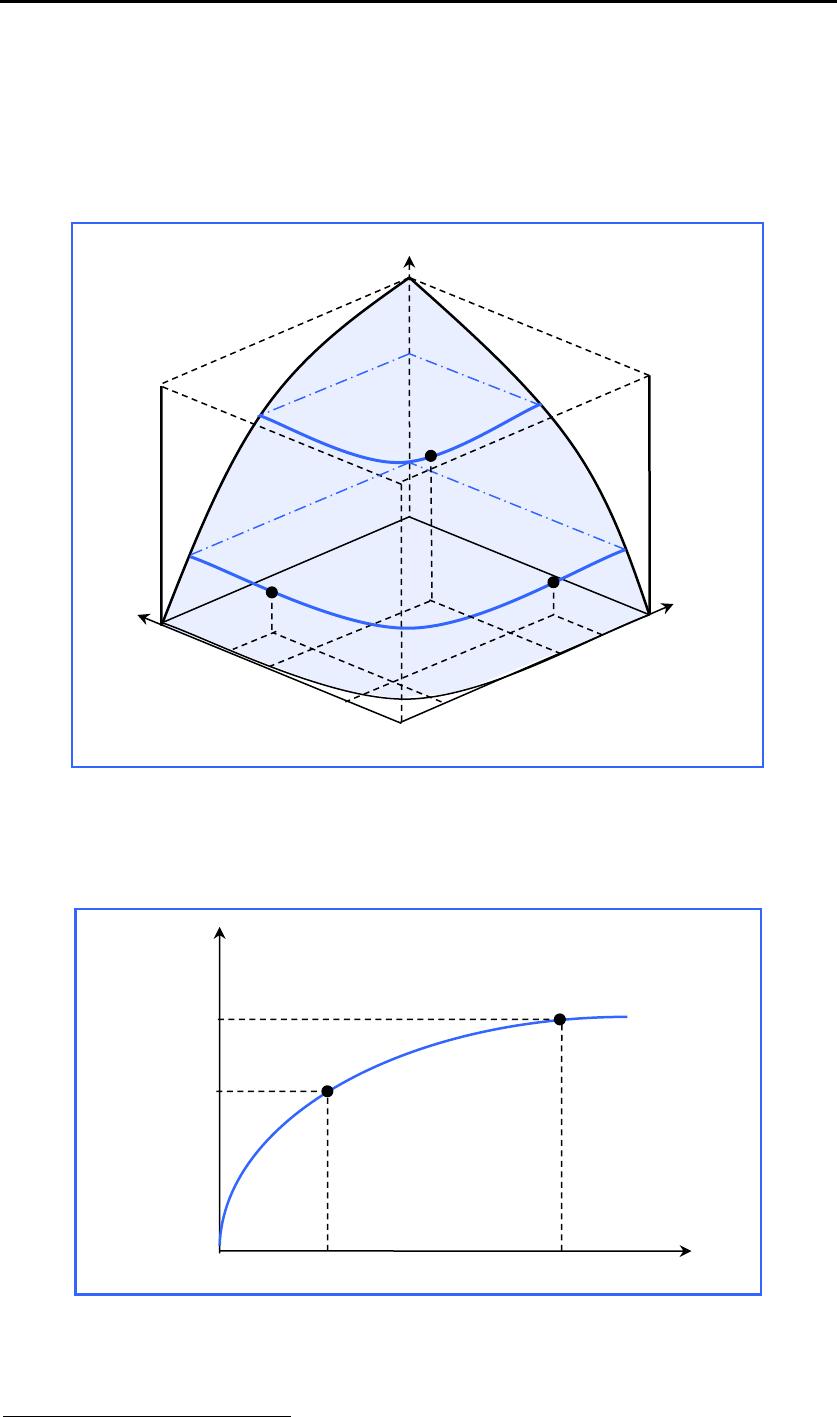
• A typical utility function
1
can be represented in a three-dimensional diagram.
• If we were to cut the utility hill vertically at a particular level of good 2, we can study how
utility level varies with the change in consumption of good 1, keeping q2 constant. For
example, if q2 is kept constant at 4 units, the total utility curve of good 1 can be derived:
1
The diagram depicts the three-dimensional diagram for a particular utility function, U = x0.5 y0.5.
0
q1
U
2
8
U = 4
U = 6
a
c
8
2
6
6
b
q2
q1
U
6
4
4
9
Total Utility
(when q2 = 4)
ECON 1005 Principles of Economics I: Microeconomics Semester 1, 2019/20
4. Indifference Curves
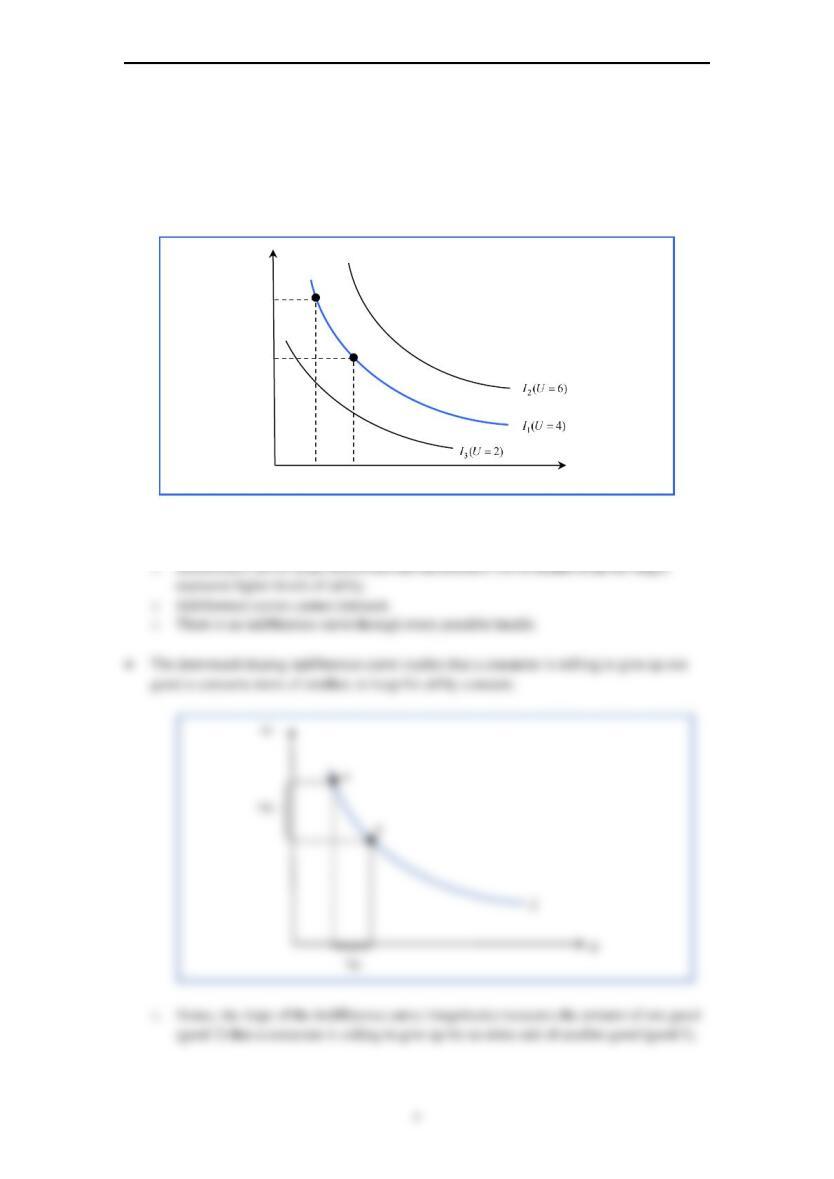
• If we cut the utility hill horizontally at a particular level of utility, and project the outside edge
of the hill on the floor. We derive an indifference curve that shows all the combinations of
good 1 and good 2 that yield the same level of utility.
• Indifference map: a graphical representation of a set of indifference curves.
• Given our assumptions about preferences, indifference curves on an indifference map have
four important properties:
q1
q2
4
4
2
8