In previous chapters, we used demand equations, but we did not
explain where they came from. Here, we discuss various
techniques for collecting data and using it to estimate and forecast
demand.
This chapter is organized as follows. We begin by examining
sources of information that provide data for forecasts. These
include consumer interviews and surveys, controlled market
studies, and uncontrolled market data. Next, we explore regression
analysis, a statistical method widely used in demand estimation.
COLLECTING DATA
Consumer Surveys
A direct way to gather information is to ask people. Whether face to face,
by telephone, online, or via direct mail, researchers can ask current and
prospective customers a host of questions: How much of the product do
you plan to buy this year? What if the price increased by 10 percent? Do
price rebates influence your purchase decisions, and, if so, by how much?
What features do you value most? Do you know about the current
advertising campaign for the product? Do you purchase competing
products? If so, what do you like about them?
SURVEY PITFALLS Though useful, surveys have problems and
limitations. For example, market researchers may ask the right questions,
but of the wrong people. Economists call this sample bias. In some
contexts, random sampling protects against sample bias. In other cases,
surveys must take care in targeting a representative sample of the relevant
market segment.
A second problem is response bias. Respondents might report what they
believe the questioner wants to hear. (“Your product is terrific, and I
intend to buy it this year if at all possible.”) Alternatively, the customer
may attempt to influence decision making. (“If you raise the price, I
definitely will stop buying.”) Neither response will likely reflect the
potential customer’s true preferences. A third problem is response
accuracy. Even if unbiased and forthright, a potential customer may have
difficulty in answering a question accurately. (“I think I might buy it at
that price, but when push comes to shove, who knows?”) Potential
customers often have little idea of how they will react to a price increase
or to an increase in advertising. A final difficulty is cost. Conducting
extensive consumer surveys is extremely costly. As in any economic
decision, the costs of acquiring additional information must be
weighed against the benefits.
An alternative to consumer surveys is the use of controlled
consumer experiments. For example, consumers are given money
(real or script) and must make purchasing decisions. Researchers
then vary key demand variables (and hold others constant) to
determine how the variables affect consumer purchases. Because
consumers make actual decisions (instead of simply being asked
about their preferences and behavior), their results are likely to be
more accurate than those of consumer surveys. Nonetheless, this
approach shares some of the same difficulties as surveys.
Subjects know they are participating in an experiment, and this
may affect their responses. For example, they may react to price
much more in an experiment than they do in real life. In addition,
controlled experiments are expensive. Consequently, they
generally are small (few subjects) and short, and this limits their
accuracy.
Controlled Market Studies
Firms can also generate data on product demand by selling their
product in several smaller markets while varying key demand
determinants, such as price, across the markets. The firm might
set a high price with high advertising spending in one market, a
high price and low advertising in another, a low price and high
advertising in yet another, and so on. By observing sales
responses in the different markets, the firm can learn how various
pricing and advertising policies (and possible interactions among
them) affect demand.
To draw valid conclusions from such market studies, all other factors
affecting demand should vary as little as possible across the markets. The
most common—and important—of these “other” demand factors include
population size, consumer incomes and tastes, competitors’ prices, and
even differences in climate. Unfortunately, regional and cultural
differences, built-up brand loyalties, and other subtle but potentially
important differences may thwart the search for uniform markets. In
practice, researchers seek to identify and control as many of these
extraneous factors as possible.
Market studies typically generate cross-sectional data—observations of
economic entities (consumers or firms) in different regions or markets
during the same time period. Another type of market study relies on time-
series data. Here, the firm chooses a single geographic area and varies its
key decision variables over time to gauge market response. The firm
might begin by setting a high price and a low advertising expenditure and
observing the market response. Some time later, it may increase
advertising; later still, it may lower price; and so on. Time-series
experiments have the advantage that they test a single (and, one would
hope, representative) population, thus avoiding some of the problems of
uncontrolled factors encountered in cross-sectional studies. Whatever the
type, traditional market tests and studies are expensive— often extremely
so.
Uncontrolled Market Data
In its everyday operation, the market itself produces a large amount of
data. Many firms operate in multiple markets. Population, income,
product features, product quality, prices, and advertising vary across
markets and over time. All of this change creates both opportunity and
difficulty for the market researcher. Change allows researchers to see
how changing factors affect demand. With uncontrolled markets,
however, many factors change at the same time. How, then, can a firm
judge the effect of any single factor? Fortunately, statisticians have
developed methods to handle this very problem.
REGRESSION ANALYSIS
Regression analysis is a set of statistical techniques using past
observations to find (or estimate) the equation that best summarizes the
relationships among key economic variables. The method requires that
analysts (1) collect data on the variables in question, (2) specify the form
of the equation relating the variables, (3) estimate the equation
coefficients, and (4) evaluate the accuracy of the equation. Let’s begin
with a concrete example.
Ordinary Least–Squares Regression
In the central example of Chapter 3, an airline’s management used a
demand equation to predict ticket sales and to make operating decisions
along a Texas–Florida air route. Let’s examine how the airline can use
regression analysis to estimate such an equation. The airline begins by
collecting data.
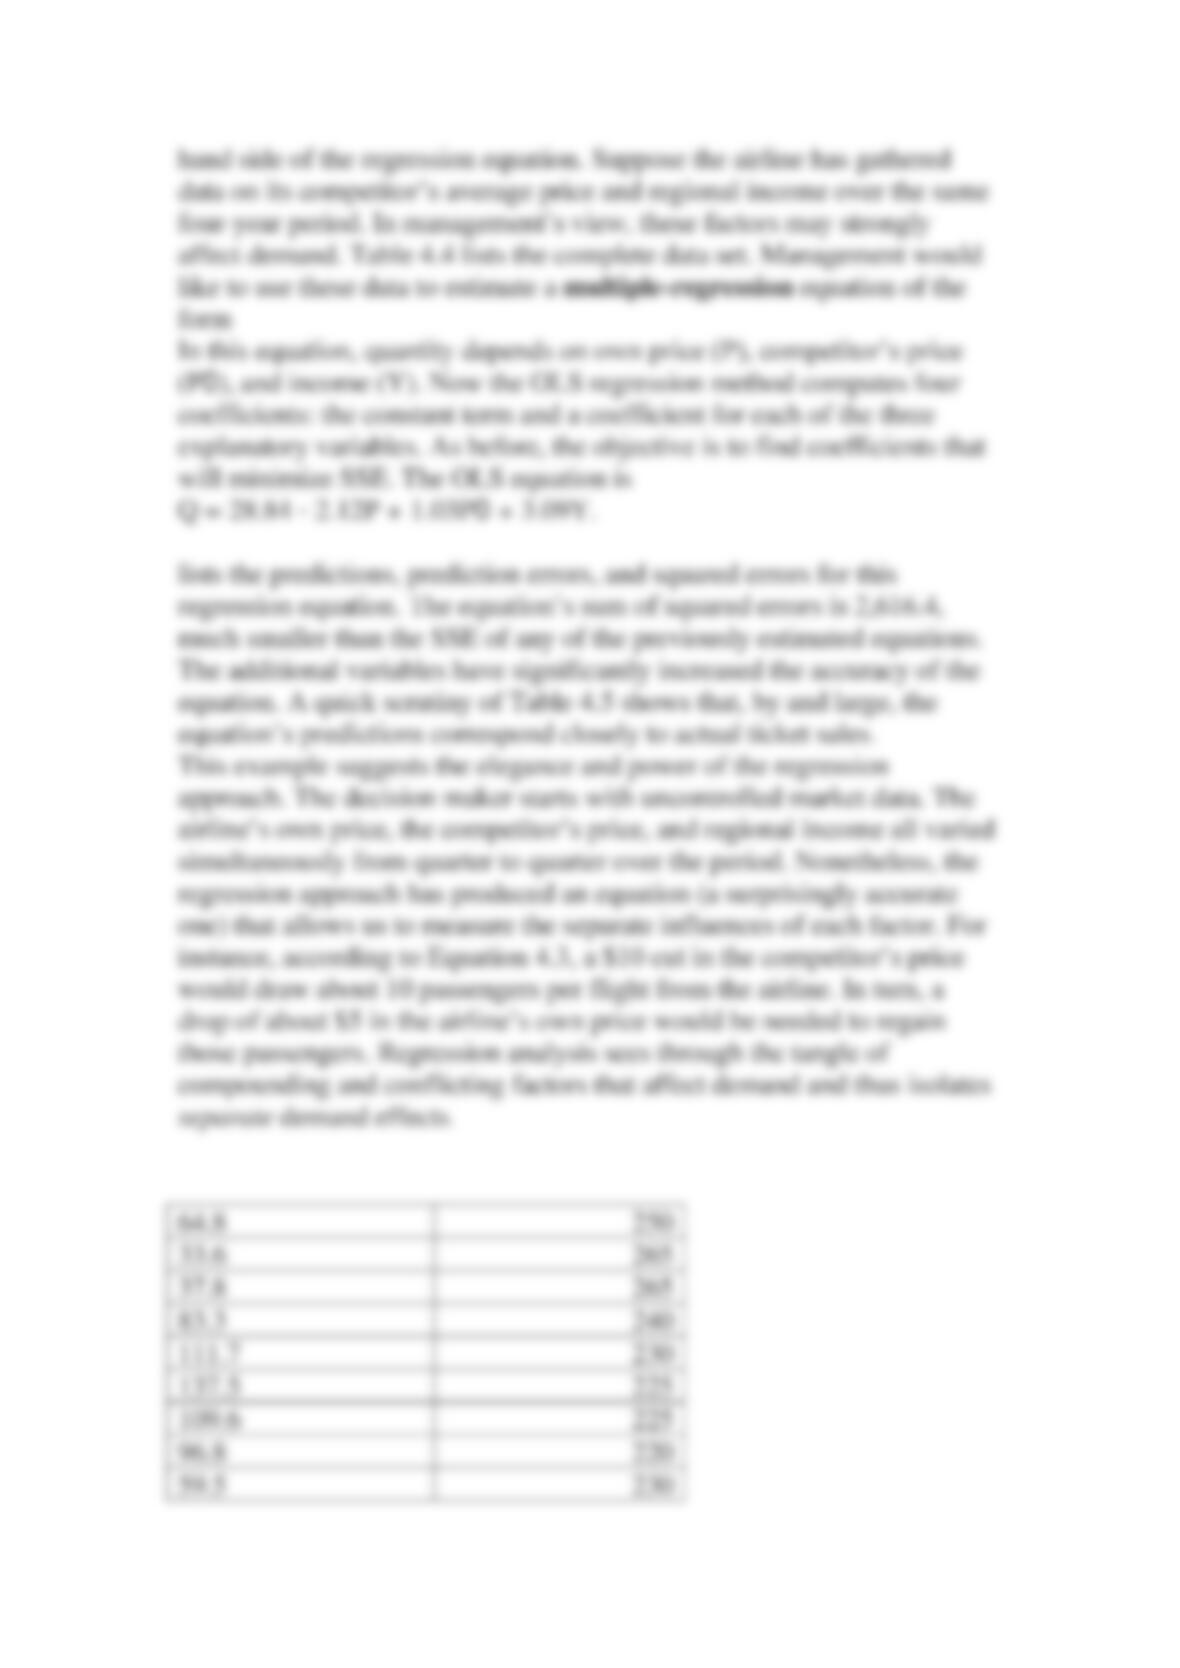
Year and quarter
Number of seats
Price
year 1Q1
64.8
250
Q2
33.6
265
Q3
37.8
265
Q4
83.3
240
year 2Q1
111.7
230
Q2
137.5
225
Q3
109.6
225
Q4
96.8
220
year 3Q1
59.5
230
Q2
83.2
235
Q3
90.5
245
Q4
105.5
240
year 4Q1
75.7
250
Q2
91.6
240
Q3
112.7
240
Q4
102.2
235
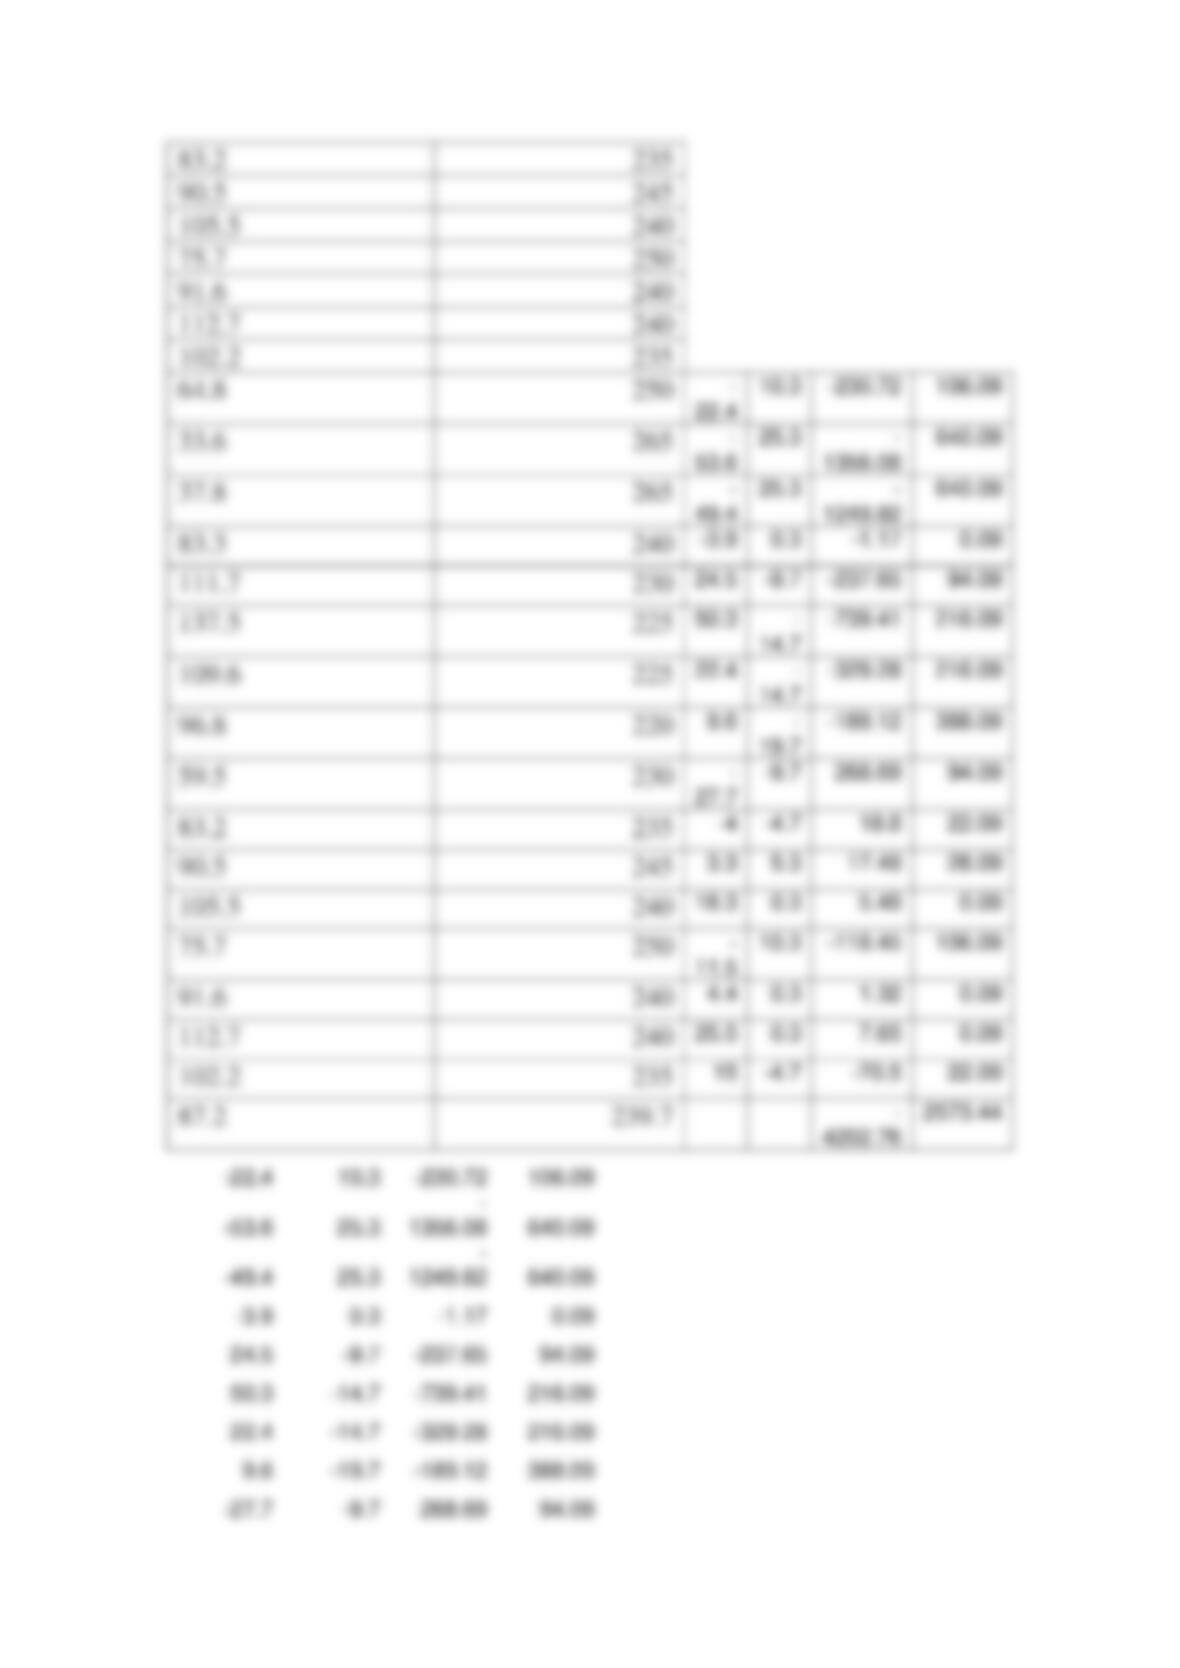
Mean
87.2
239.7
Standard deviation
27
12.7
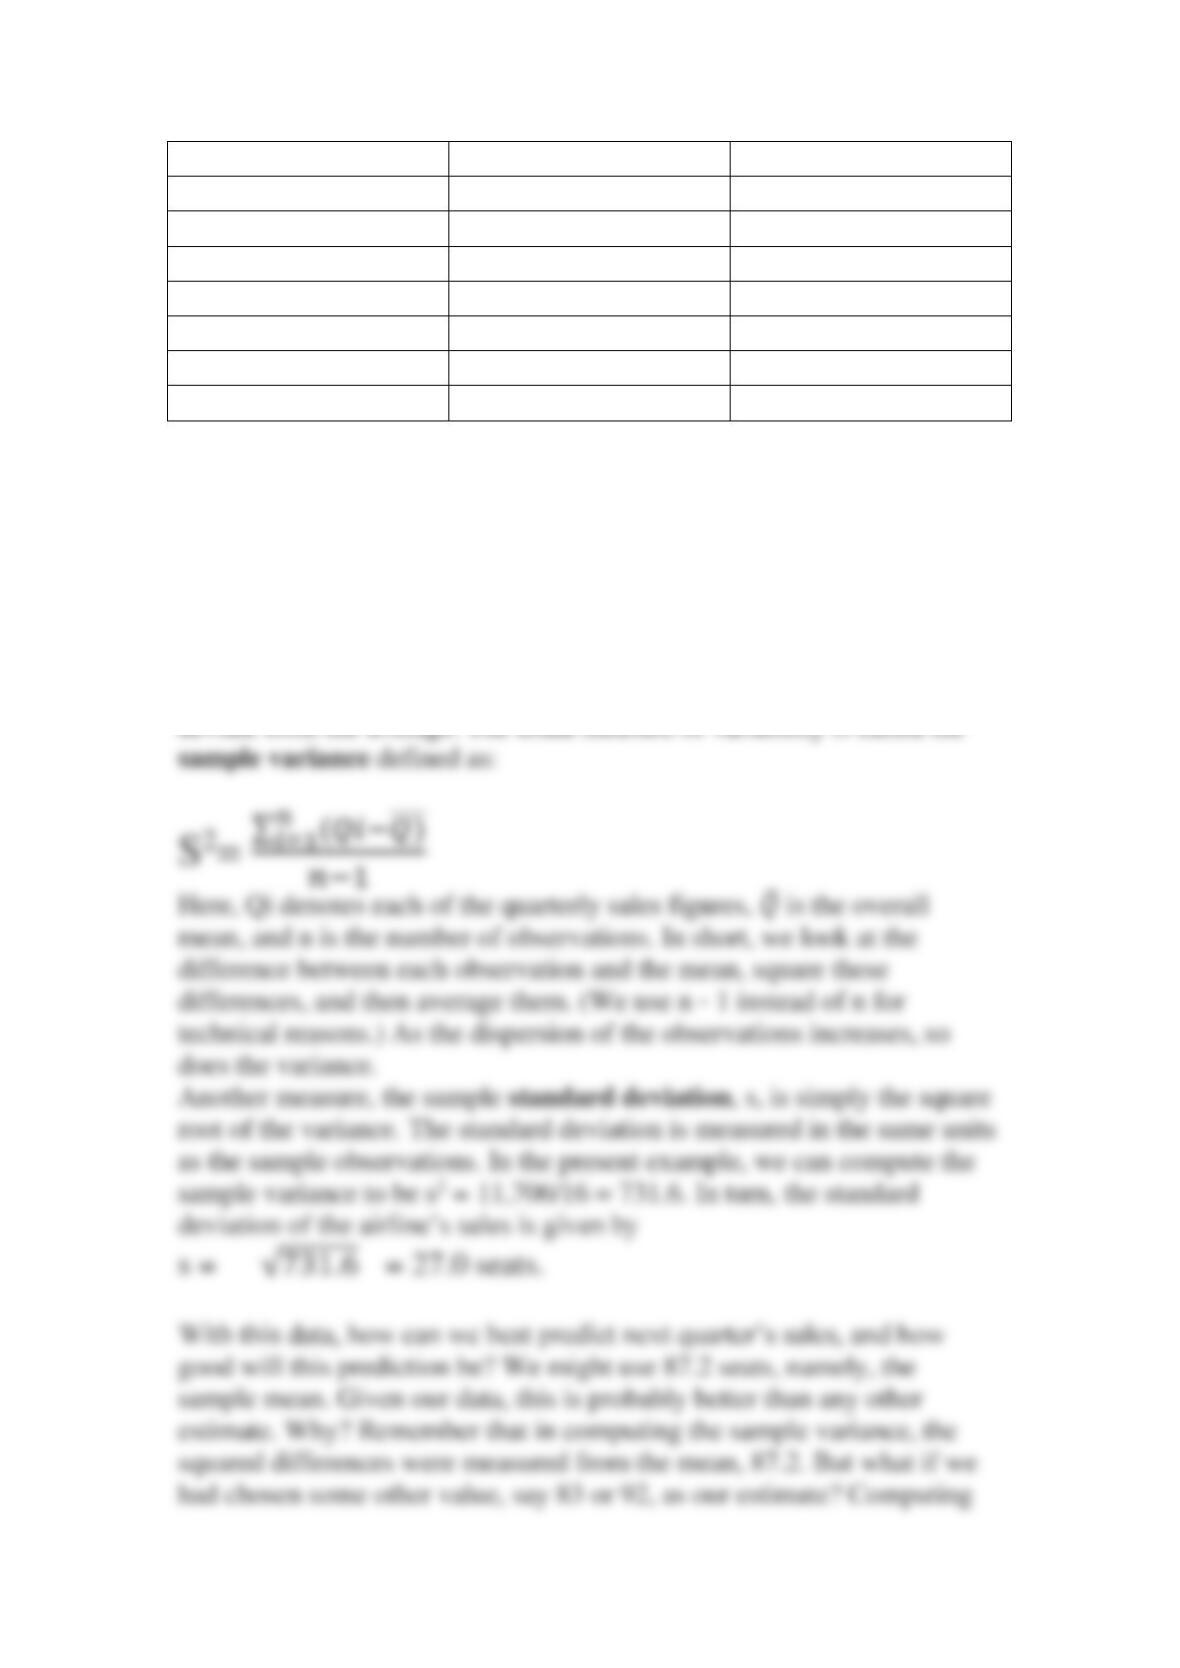
The second column of Table 4.1 shows the average number of coach
seats sold per flight for each quarter (i.e., 90 days) over the last four
years. Sales vary quarter by quarter. In the best quarter, customers bought
137 seats on each flight; in the worst, only a year earlier, customers
bought just 34 seats. Over the four-year period, the airline sold 87.2 seats
on average.
The mean (that is, the average) gives us some idea of the level of sales
we can expect. We would also like some idea of how much the sales can