tho75109_case05_C41-C50.indd C-41 12/18/18 09:24 PM
Competition in the Craft
Beer Industry in 2018
John D. Varlaro
Johnson & Wales University
John E. Gamble
Texas A&M University–Corpus Christi
Locally produced or regional craft beers caused a
seismic shift in the U.S. beer industry during the
early 2010s with the gains of the small, regional
newcomers coming at the expense of such well-known
brands as Budweiser, Miller, Coors, and Bud Light.
Craft breweries, which by definition sold fewer than
6 million barrels (bbls) per year, expanded rapidly
with the deregulation of intrastate alcohol distribution
and retail laws and a change in consumer preferences
toward unique and high-quality beers. The growing
popularity of craft beers led to an approximate 5 per–
cent sales volume increase in craft beer in 2017.1
Yet, the overall beer industry had remained flat
in 2017 with total beer sales dropping by 1.2 percent
in the United States.2 The craft beer industry, too,
had begun to show signs of a slowdown going into
2018. While volume sales had increased by 5 percent
in 2017 and annual growth had averaged 13.6 percent
from 2012 to 2017, projections had slowed dramati-
cally to 1.3 percent from 2017 to 2022.3 Yet there did
not seem to be a slowdown in the number of new
craft brewers entering the market. Industry com-
petition was increasing as grain price fluctuations
affected cost structures and growing consolidation
within the beer industry—led most notably by AB
InBev’s acquisition of several craft breweries, Grupo
Modelo, and its acquisition of SABMiller—and cre-
ated a battle for market share. While the market
for specialty beer was expected to gradually plateau
by 2020, it appeared that the slowing growth had
arrived by 2017. Nevertheless, craft breweries and
microbreweries were expected to expand in number
and in terms of market share as consumers sought
out new pale ales, stouts, wheat beers, pilsners, and
lagers with regional or local flairs.
THE BEER MARKET
The total economic impact of the beer market was
estimated to be 2.0 percent of total U.S. GDP in
2016 when variables such as jobs within beer pro–
duction, sales and distribution were included.4 Total
revenue for the craft beer industry was estimated at
$6 billion.5 Exhibit 1 presents annual per produc–
tion statistics for the United States between 2006
and 2017.
Although U.S. production had declined since
2008, consumption was increasing elsewhere in the
world, resulting in a forecasted global market of over
$700 billion in sales by 2022.6 Global growth seemed
to be fueled by the introduction of differing styles of
beer to regions where consumers had not previously
had access and the expansion of demographics not
normally known for consuming beer. Thus, exported
beer to both developed and developing regions
helped drive future growth. As an example, China
recently saw a number of domestic craft breweries
producing beer as well as experimenting with locally
and regionally known flavors, enticing the domestic
palette with flavors such as green tea.
The Brewers Association, a trade association
for brewers, suppliers and others within the indus-
try, designated a brewery as a craft brewer when
output was less than 6 million barrels annually and
the ownership was more than 75 percentindepen-
dent of another non-craft beer producer or entity.
The rapid increase in popularity for local beers led
to the number of U.S. brewers to reach over 6,000
CASE 5
Copyright ©2018 by John D. Varlaro and John E. Gamble. All rights
reserved.
Final PDF to printer

tho75109_case05_C41-C50.indd C-42 12/18/18 09:24 PM
C-42 PART 2 Cases in Crafting and Executing Strategy
EXHIBIT 1 Barrels of Beer Produced in
the United States, 2006–2017
(millions of barrels)
Year Barrels produced (in millions)*
2006 198
2007 200
2008 200
2009 197
2010 195
2011 193
2012 196
2013 192
2014 193
2015 191
2016 190
2017 186
*Rounded to the nearest million.
Source: Alcohol and Tobacco Tax and Trade Bureau website
EXHIBIT 2 Top 10 U.S. Breweries in 2017
Rank Brewery
1Anheuser-Busch, Inc
2MillerCoors
3Constellation
4Heineken
5Pabst Brewing Company
6D.G. Yuengling and Son, Inc
7North American Breweries
8Diageo
9Boston Beer Company
10 Sierra Nevada Brewing Company
Source: Brewers Association.
EXHIBIT 3 Top 10 Global Beer
Producers by Volume,
2014–2016 (millions of
barrels)*
Rank Producer 2014 2015 2016
1 Ab InBev** 351 353 435
2 Heineken 180 186 195
3 Carlsberg 110 107 102
4 CR Snow*** N/A N/A 100
5 Molson Coors
Brewing Company
54 54 82
6 Tsingtao (Group) 78 72 67
7 Asahi 26 24 60
8 Beijing Yanjing 45 41 38
9 Castel BGI 26 26 26
10 Kirin 36 35 24
* Originally reported as hectoliters. Computed using 1 hL = .852
barrel for comparison; to nearest million bbl.
** Now includes SABMiller; previous volumes for SABMiller in years
2014 and 2015 prior to acquisition were 249 and 353, respec –
tively, ranking it as second for both years.
*** Was not in top 10 for 2014 and 2015.
N/A: Not available.
Source: AB InBev 20-F SEC Document, 2015, 2016, 2017.
in 2017—nearly triple the number in 2012. Of these
breweries, 99 percent were identified as craft brewer-
ies with distribution ranging from local to national.
While large global breweries occupied the top posi-
tions among the largest U.S. breweries, three craft
breweries were ranked among the top-10 largest U.S.
brewers in 2017—see Exhibit 2. Exhibit 3 shows the
production volume of the 10 largest beer producers
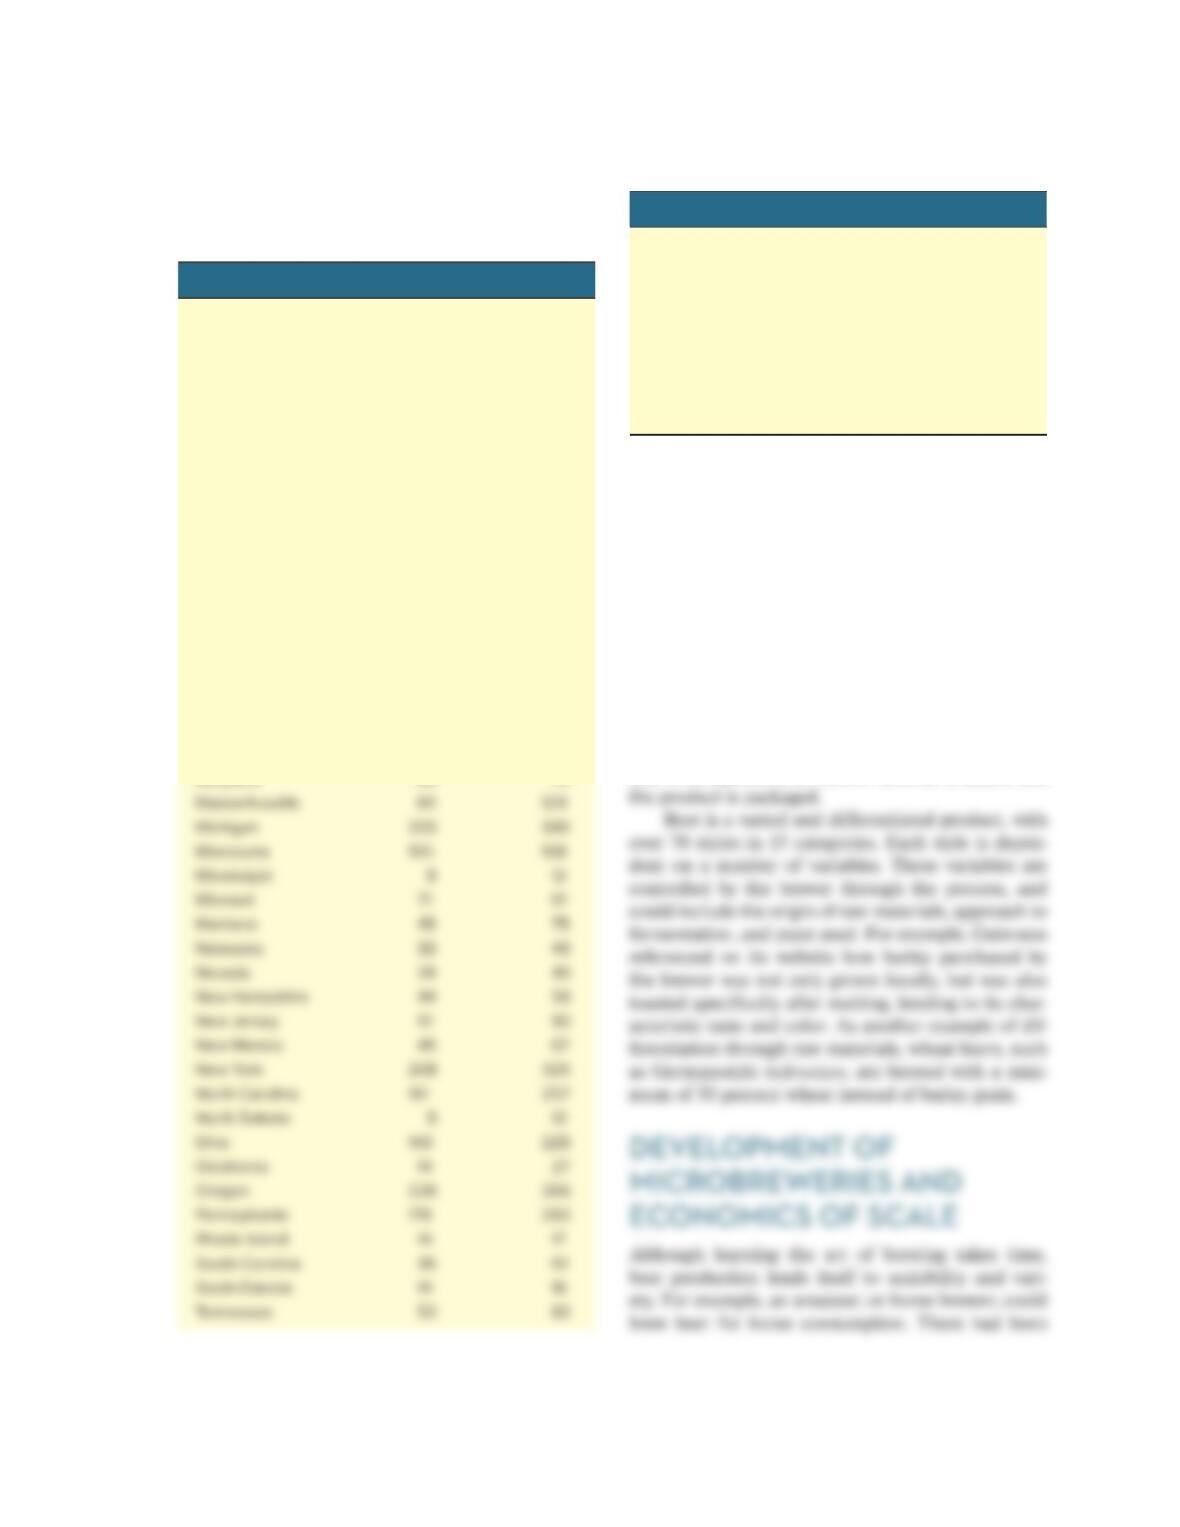
worldwide from 2014 to 2016. The number of craft
breweries in each U.S. state in 2015 and 2017 are
presented in Exhibit 4.
THE BEER PRODUCTION
PROCESS
The beer production process involves the fermenta-
tion of grains. The cereal grain barley is the most
common grain used in the production of beer. Before
fermentation, however, barley must be malted and
milled. Malting allows the barley to germinate and
produce the sugars that would be fermented by the
yeast, yielding the sweetness of beer. By soaking the
barley in water, the barley germinates, or grows, as it
would when planted in the ground. This process is
halted through the introduction of hot air and drying
after germination began.
After malting, the barley is milled to break open
the husk while also cracking the inner seed that has
begun to germinate. Once milled, the barley is mashed,
or added to hot water. The addition of the hot water
produces sugar from the grain. This mixture is then
filtered, resulting in the wort. The wort is then boiled,
Final PDF to printer
CASE 5 Competition in the Craft Beer Industry in 2018 C-43
which sterilizes the beer. It is at this stage that hops
are added. The taste and aroma of beer depend on the
variety of hops and when the hops were added.
After boiling, the wort is cooled and then poured
into the fermentor where yeast is added. The sugar
created in the previous stages is broken down by
the yeast through fermentation. The different styles
of beer depend on the type of yeast used, typically
either an ale or lager yeast. The time for this process
could take a couple of weeks to a couple of months.
After fermentation, the yeast is removed. The pro-
cess is completed after carbon dioxide is added and
EXHIBIT 4 Number of Craft Brewers
by State, 2015 and 2017
State 2015 2017
Alabama 24 34
Alaska 27 36
Arizona 78 96
Arkansas 26 35
California 518 764
Colorado 284 348
Connecticut 35 60
Delaware 15 21
Florida 151 243
Georgia 45 69
Hawaii 13 18
Idaho 50 54
Illinois 157 200
Indiana 115 137
Iowa 58 76
Kansas 26 36
Kentucky 24 52
Louisiana 20 33
Maine 59 99
State 2015 2017
Texas 189 251
Utah 22 30
Vermont 44 55
Virginia 124 190
Washington 305 369
West Virginia 12 23
Wisconsin 121 160
Wyoming 23 24
Source: Brewers Association.
Final PDF to printer