To: Christine Seebon, Adjunct, Franklin University
From: Mahmood Al-Bimani, MBA Student
Subject: Company Analysis Part 1
Date: July 15, 2018
Business Brief
Alphabet is one of the most famous USA companies not only inside USA but its fame went
beyond the horizons to cover the whole world. The company was founded by Larry Page and
Sergey Brin in 1998 under the name of “Google”. It is specialized in providing internet and
related products services. In 2015, the company made major changes in the management
structure to include all subsidiaries companies (e.g; Google, CapitalG, Google Fiber, and
others) under one umbrella which called Alphabet. This assignment aims to discuss the
Alphabet’s performance for the past three years (2017-2015) in terms of revenue, profitability,
liquidity, and leverage
Revenue
Revenue is the amount of income that the company generates from sales or its services before
taking out any expenses (Boyte-White, 2014). Revenue is the profitability essence of
investment, therefore, to get a high profit you have to raise the revenues. Consequently, the
revenue’s annual growth can show the trends of economic activity in the company.
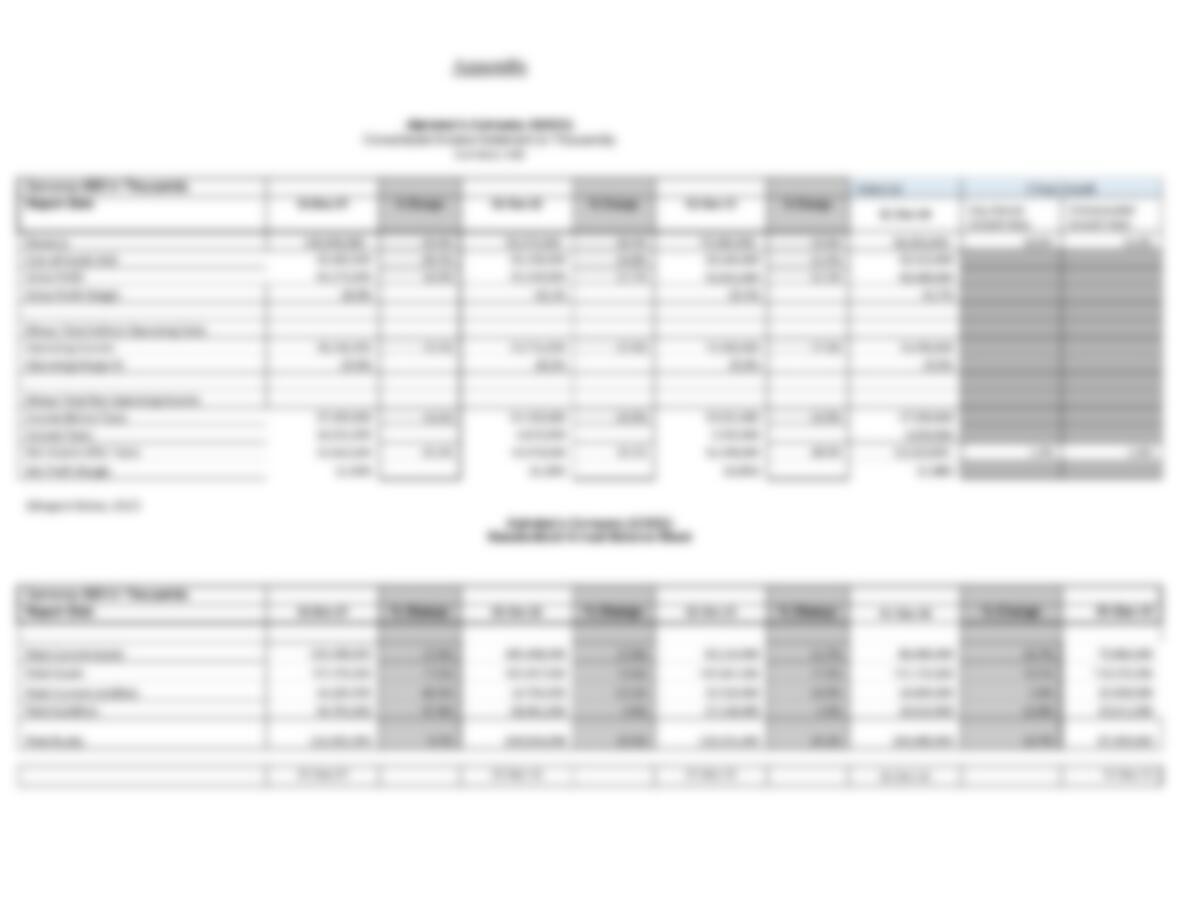
Alphabet Company reported steady growth in the revenues amount during the last three years
(Appendix 1). The revenue in 2015 was $74 million, and then increased by 20.4% in the next
year reaching up to $90 million in 2016. The growth continued in 2017 hitting $110 million, at
an average annual growth of 18.9% over the three years. This is because the increase of sales
amount in 2015, 2016, and 2017 in which sales amount is estimated at$45 million, $35
million, and $28 million respectively. Advertising accounted for the highest percentage of
company’s revenue by 84%, followed by the cloud and hardware services by 14.5% (D’Onfro,
2018). Despite the good rate of average annual growth (18.9%), however, this can be
misleading sometimes because this formula taking the average. Therefore, it highly
recommended checking the compounded growth rate as well. Compounded growth rate is the
best calculation to evaluate the company performance over period of time which helps in
fixing the average limitation (Wayman, 2018). Therefore, it is important to look at the
compound growth rate for Alphabet Company to indicate its real growth over the three years
period. The compound growth rate of Alphabet is 13.8% which speculate the growth will
continue in the coming year also.
Profitability
Profitability is the company’s ability to gain profit from its operation. It is important to
analyze the company’s performance in terms of financial statement. There are number of
financial indicators that can illustrate the profitability status of the company. For example, net
income, gross profit, net profit margin, and others. This assignment going to focus on gross
profit and net income as it considered as the most important indicators in for company’s
financial performance in the basic level (Boyte-White, 2015). Gross profit is the indicator that
measure the profit made from the products or sales of goods. It is calculated by subtracting the
cost of goods from total revenue. Alphabet shows significant progresses in gross profit during
the three years, where it was $46 million in 2015, $55 million, and reached to$65 million in
2017. Net income is the second indictor that will be discussed in this assignment. Net income
is amount of revenue that remained after taking out all expenses like taxes, cost of sold goods,
and others. So, net income can give a broader view of the company’s financial performance
and profitability. During the first two years (2015 and 2016), alphabet shows increase in the
net income $16 million, and $19 million respectively. However, in 2017 net income dropped
to $12 million. This is because the company spent more money for long term investment
especially in “Google Fiber” and “Waymo Self–Driving Car” and others (Callaham, 2018).
Liquidity
Liquidity is level of ability to convert assets to cash (Mueller, 2007). Current ratio is one way
to measure the company’s liquidity. It is calculated by dividing the current assets by current
liabilities (Mueller, 2007). The ideal status of company’s current ratio is higher than 1, the
higher current ratio means more company’s capability to pay its obligation. However, this is
not always the case, sometimes greater current ratio (higher than 3) might suggest inefficient