1
COMBINED SEISMIC AND SCOUR VULNERABILITY ASSESSMENT OF STEEL
MOMENT RESISTING FRAME STRUCTURE USING CURSORY SATELLITE
IMAGERIES
By
RAUNAK SHUKLA
A design paper submitted in partial fulfillment of the requirements for the
Master of Science
Major in Civil Engineering
South Dakota State University
2015

2
COMBINED SEISMIC AND SCOUR VULNERABILITY ASSESSMENT OF STEEL
MOMENT RESISTING FRAME STRUCTURE USING CURSORY SATELLITE
IMAGERIES
This design paper is approved as a creditable and independent investigation by a
candidate for the Master of Science in civil engineering degree and is acceptable for meeting
design paper requirement for this degree. Acceptance of this design paper does not imply that
the conclusion reached by the candidate is necessarily the conclusion of the major
department.
Junwon Seo, Ph.D., P.E. Date
Design Paper Advisor
Nadim Wehbe, Ph.D., P.E Date
Department Head
Civil & Environmental Engineering
Dean Graduate School Date
3
ACKNOWLEDGMENTS
I would like to gratefully acknowledge the advice, support, and encouragement provided
by Dr. Junwon Seo throughout the pursuit of my master’s degree. His experience and
knowledge have brought me a great educational experience. This paper would not be
completed without his support and guidance.
Deep gratitude is extended to my Mother, brother Rahul and my Uncle Yogendra Nath
Tripathi for the ceaseless love and unconditional support they have provided throughout the
course of my education.
I would also like to express special thanks to Abdullah, Nitin, Marius and Burte for their
assistance and friendship, as well as for their willingness to share their considerable
knowledge.

4
TABLE OF CONTENT
TITLE Page
List of Figures……………………………………………………………………………………………………….. v
List of Tables…………………………………………………………………………………………………………. vi
ABSTRACT………………………………………………………………………………………………………….. vii
1 INTRODUCTION……………………………………………………………………………………………….. 1
1.1 Background…………………………………………………………………………………………….1
1.2 Objective………………………………………………………………………………………………..1
1.3 Scope of Work……………………………………………………………………………………….. 2
1.4 Outline……………………………………………………………………….… 2
2 LITERATURE REVIEW……………………………………………………………………………………… 4
2.1 Estimation of Structure Dimensions………………………………………………………….. 4
2.2 Seismic Vulnerability Assessment……………………………………………………………. 4
2.3 Soil-Structure Interaction (SSI)……………………………………………………………….. 5
2.4 Fragility Curves…………………………………………………………………………………….. 6
3 SATELLITES IMAGE-BASED BUILDING CONFIGURATION…………………………… 7
3.1 Building Selection…………………………………………………………………………………. 7
3.2 Building Configuration………………………………………………………… 8
3.3 Validation of Building Configuration…………………………………………. 9
4. SEISMIC SIMULATION……………………………………………………………………………………. 10
4.1 Modelling Approach………………………………………………………………………………. 10
4.2 Seismic Ground Motion Parameters…………………………………………………………. 15
4.3 Soil Structure Interaction for Building Structure………………………………………… 16
4.3.1 Introduction……………………………………………………………………………… 16
4.3.2 Brookings City & County Building…………………………………………….. 20
4.3.3 Foundation Conditions………………………………………………………………. 20
4.3.4 Development of Foundation Springs and Dashpots……………………….. 21
4.4 Synthetic Ground Motion………………………………………………………………………… 27
4.5 Inter-story Drift…………………………………………………………………………………….. 29
5 FRAGILITY CURVE………………………………………………………………………………………….. 31
5.1 Damage Indices………………………………………………………………….31
5.2 Procedure………………………………………………………………………. 31
5.3 Samples of Fragility Curves…………………………………………………………………….. 32
6 PARAMETRIC STUDIES……………………………………………………………………………………. 37
7 SUMMARIES, CONCLUSIONS AND FUTURE WORK……………………………………….. 41
APPENDIX…………………………………………………………………………………………………………… 43
REFRENCES ……………………………………………………………………………………………………….. 50
5
LIST OF FIGURES
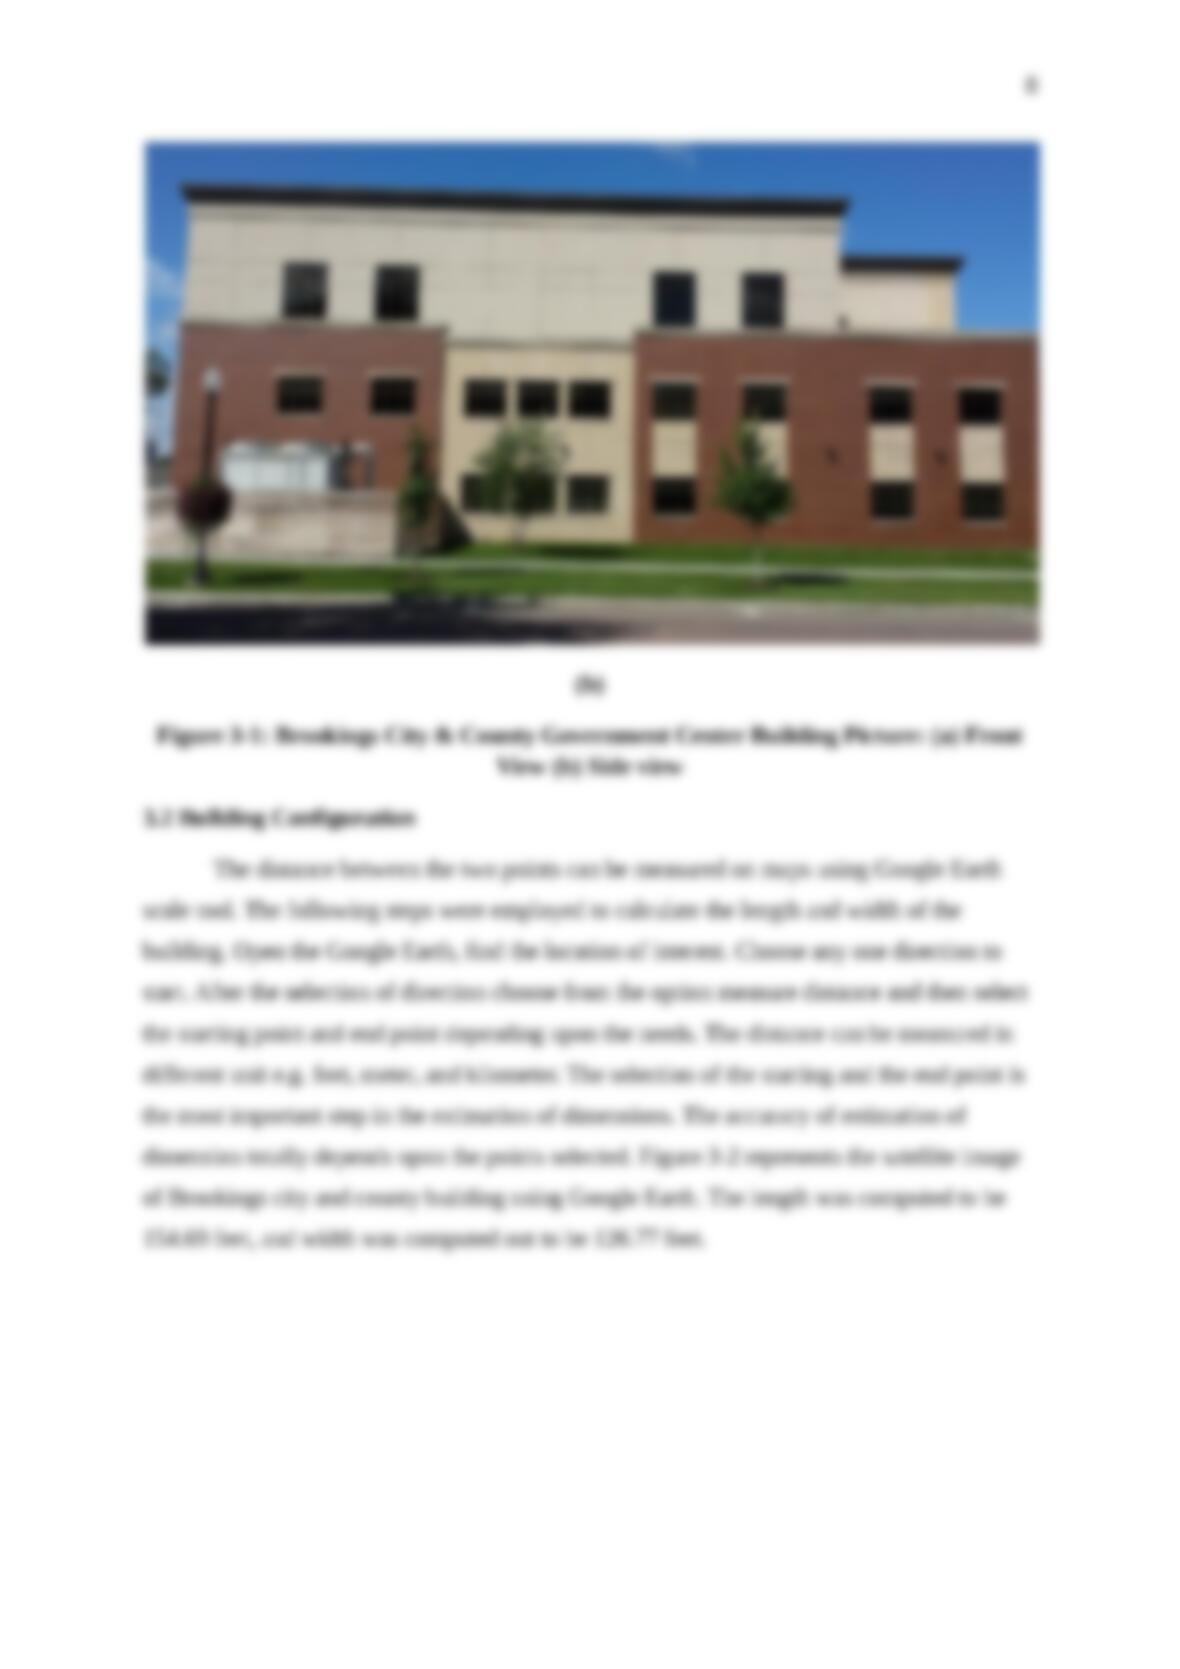
Figure 3-1: Brookings City & County Government Center Building Picture:
(a) Front View (b) Side view…………………………………………………………………………. 8
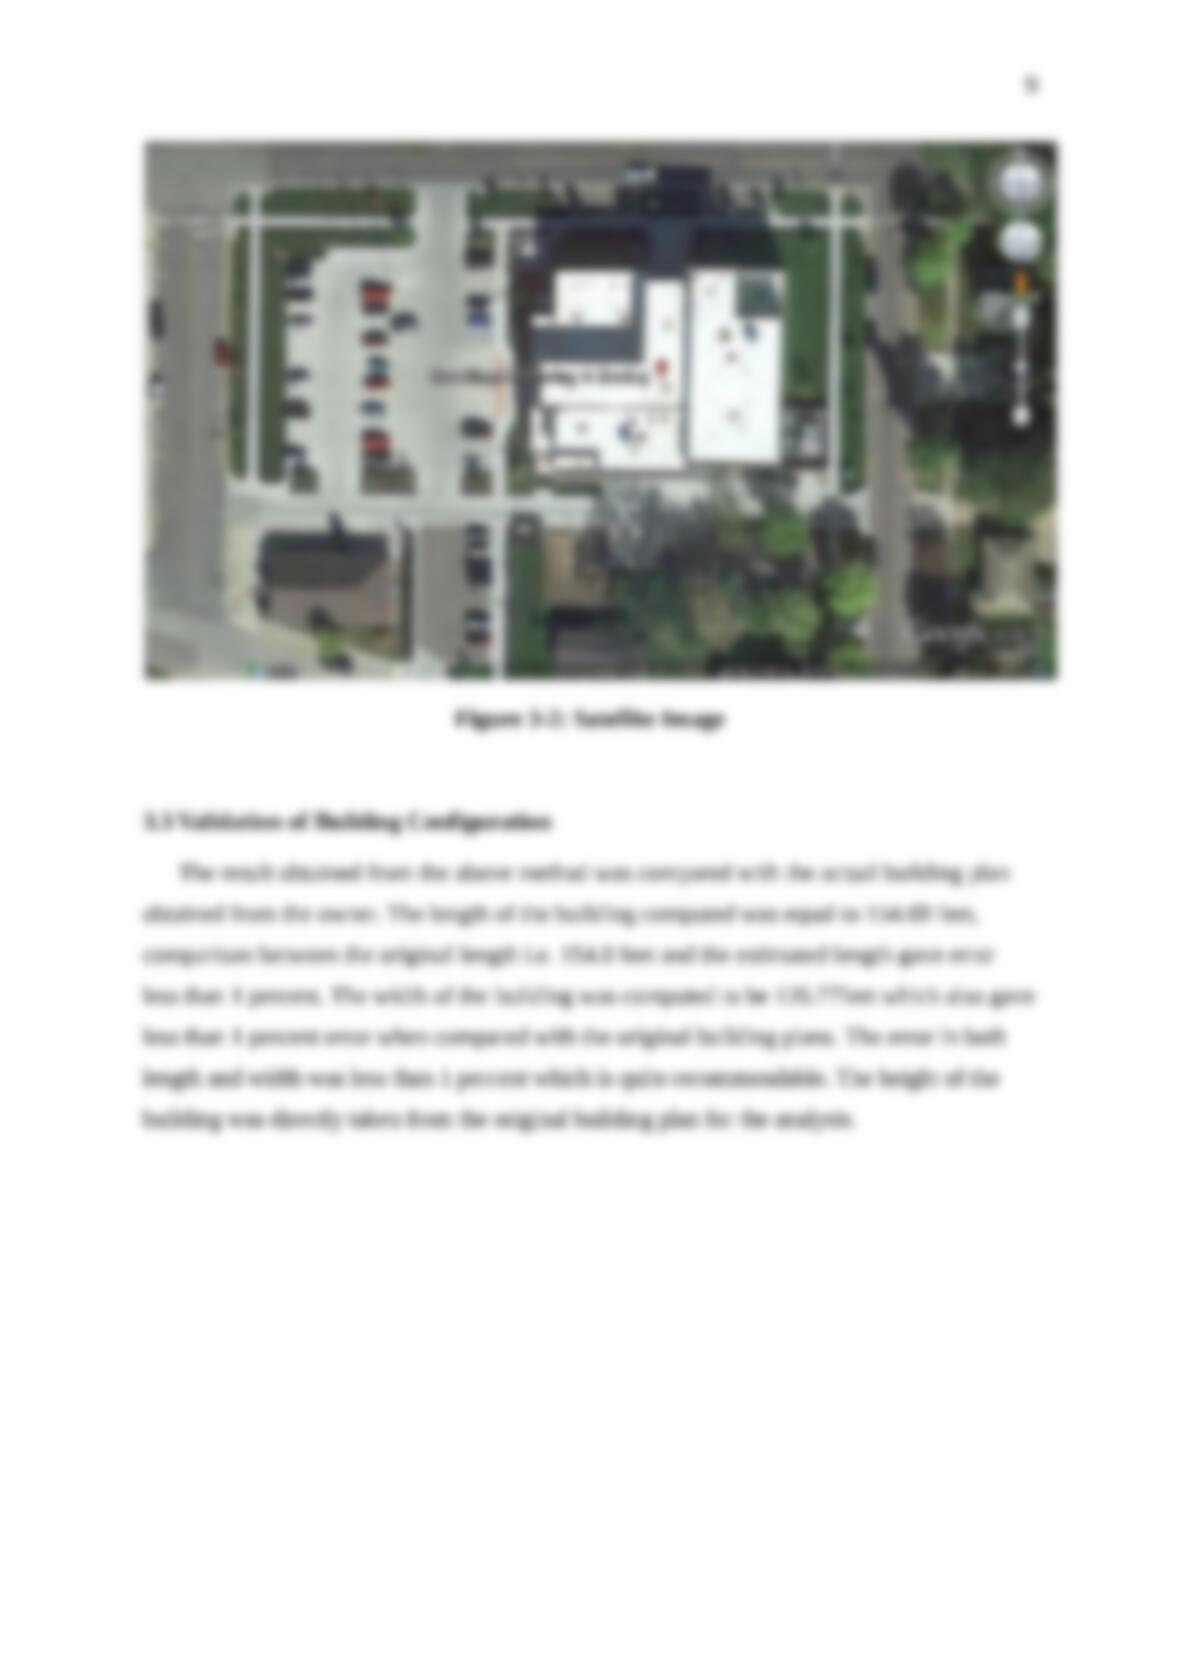
Figure 3-2: Satellite Image………………………………………………………………………………………..9
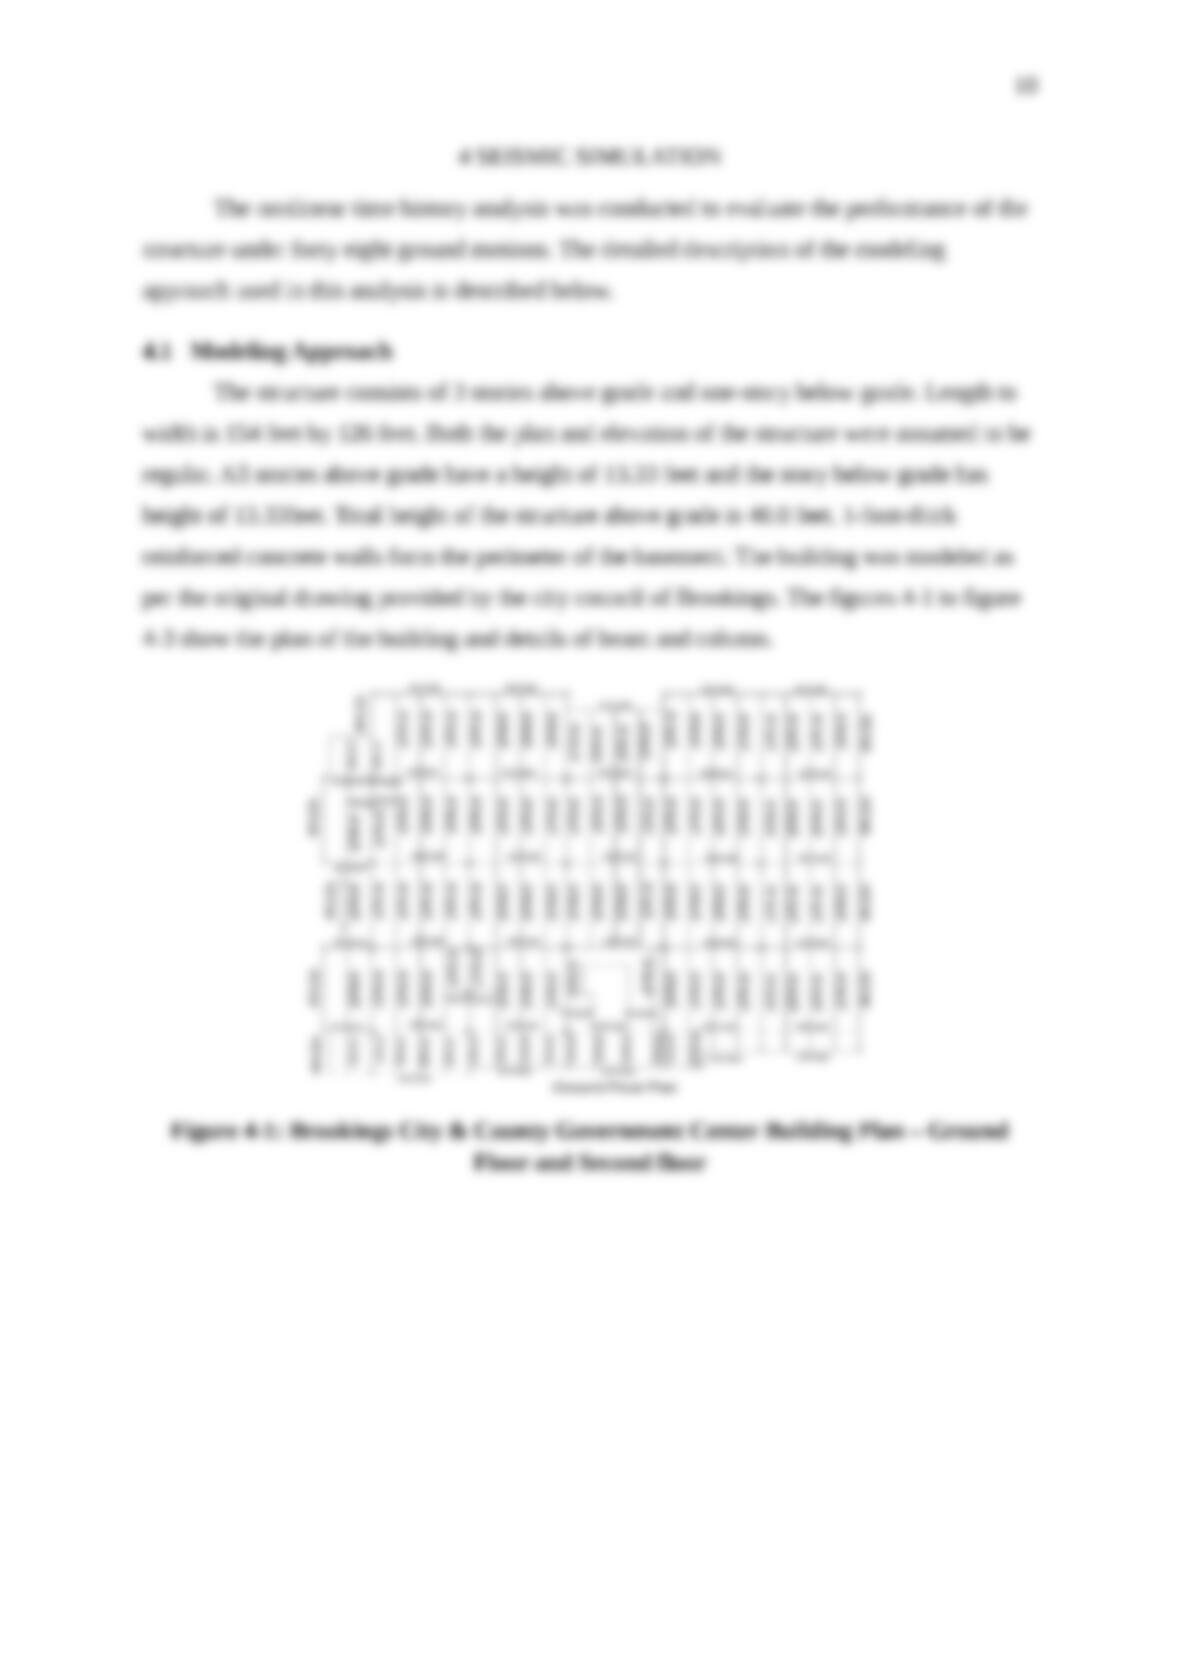
Figure 4-1: Brookings City & County Government Center Building Plan –
Ground Floor and Second floor……………………………………………………………………… 10
Figure 4-2: Brookings City & County Government Center Building Plan – First Floor…… 11
Figure 4-3: Brookings City & County Government Center Building Plan – Roof…………… 11
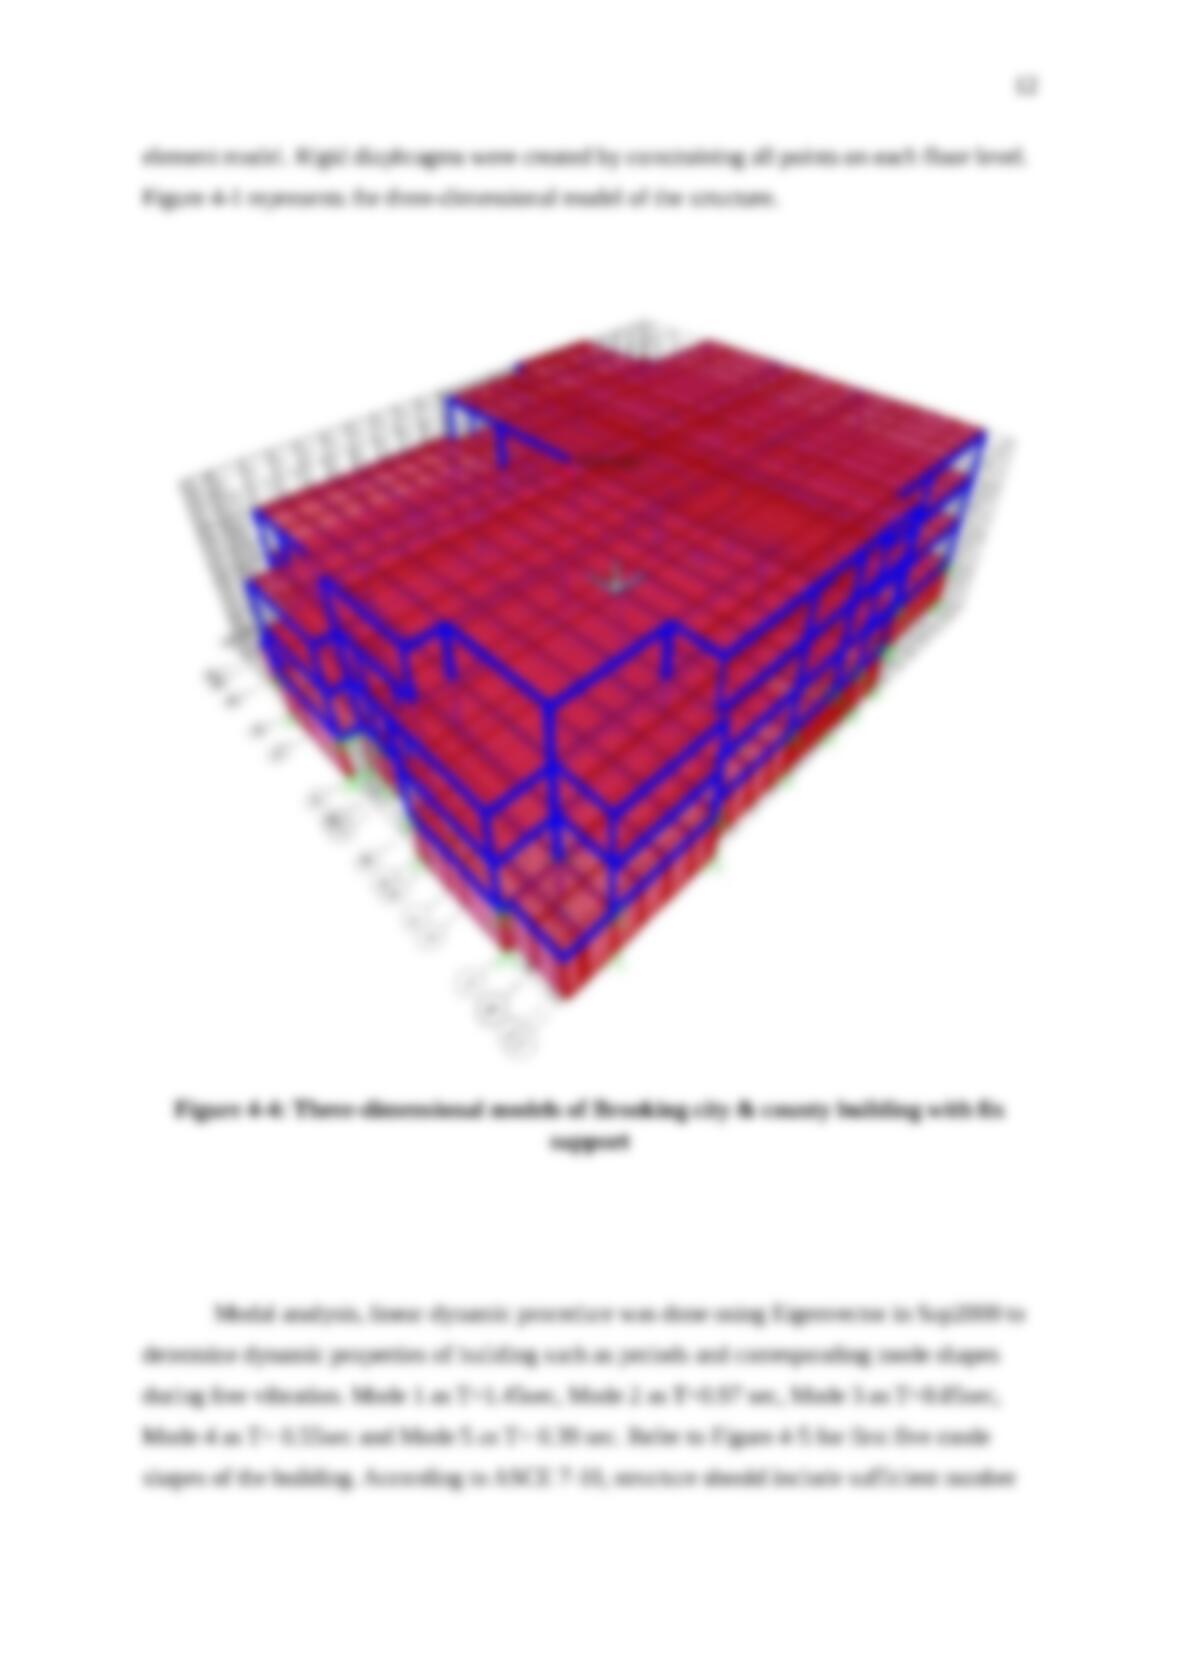
Figure 4-4: Three-dimensional models of Brooking city & county building
with fix support…………………………………………………………………………………………….12
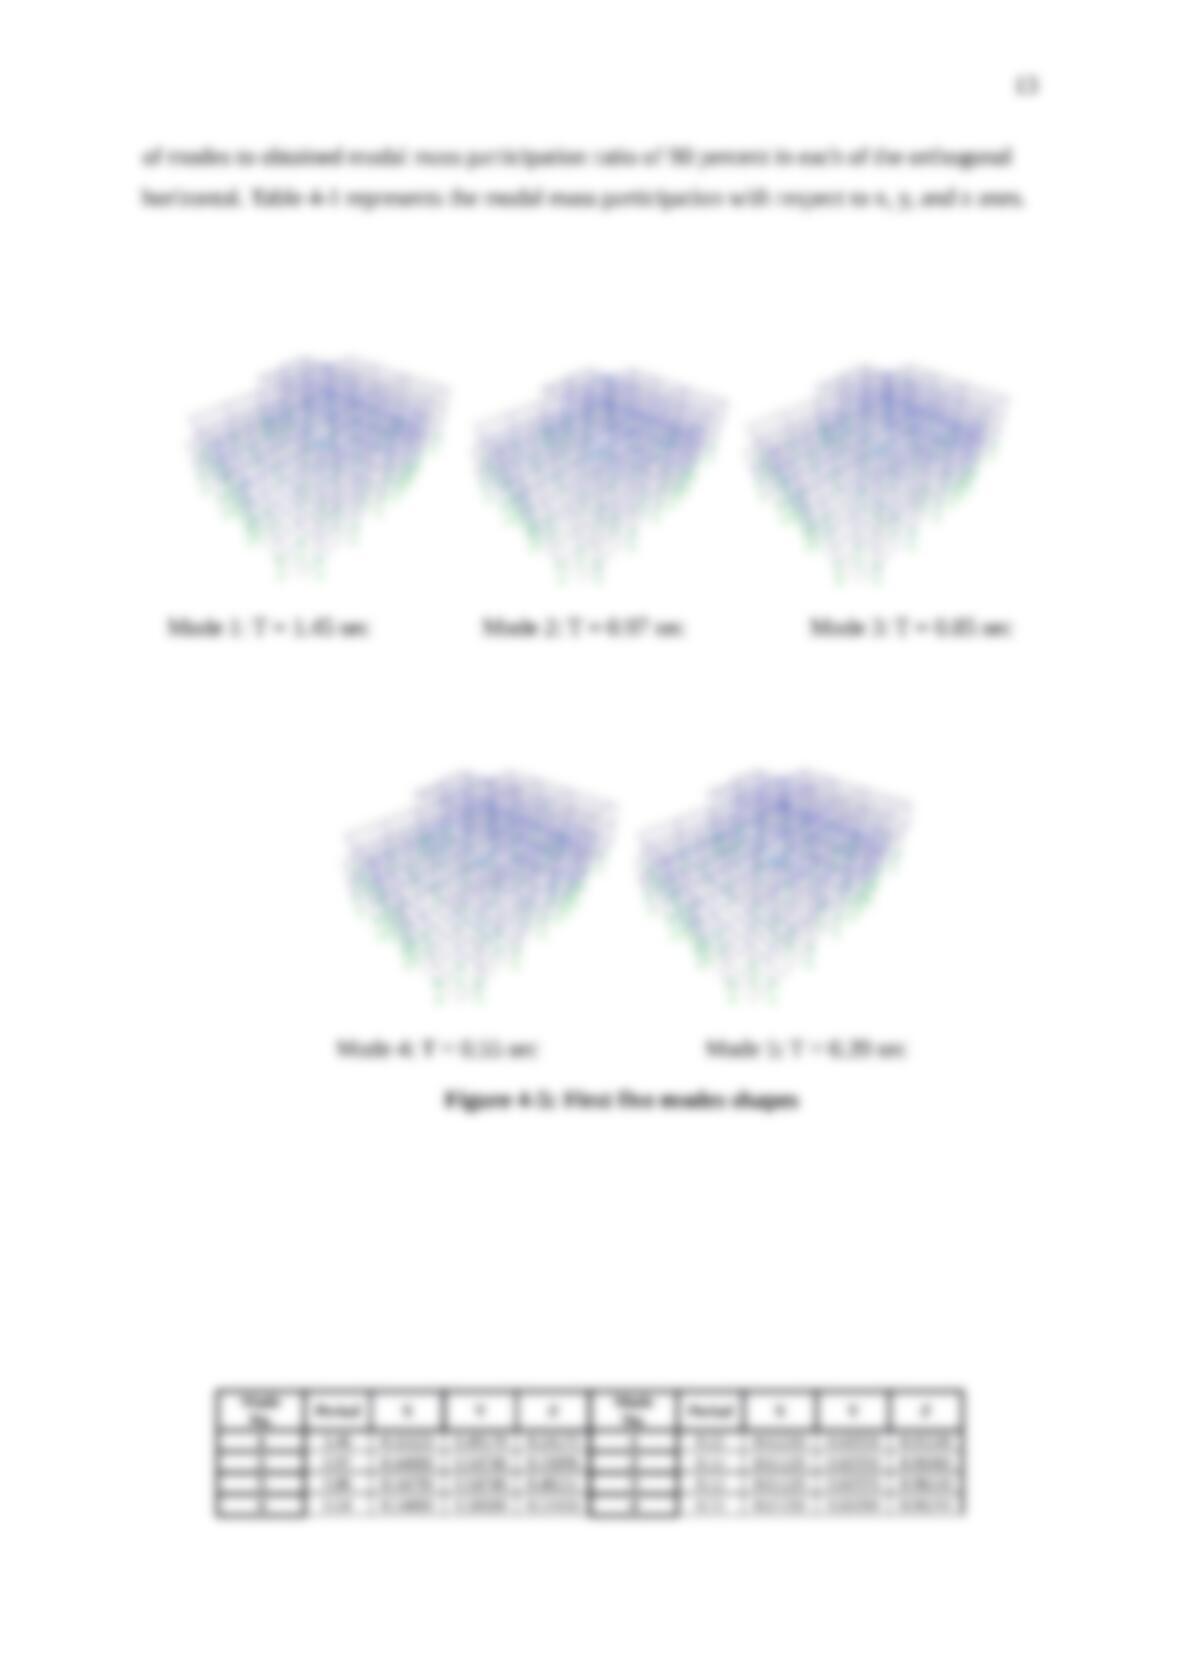
Figure 4-5: First five modes shapes……………………………………………………………………………13
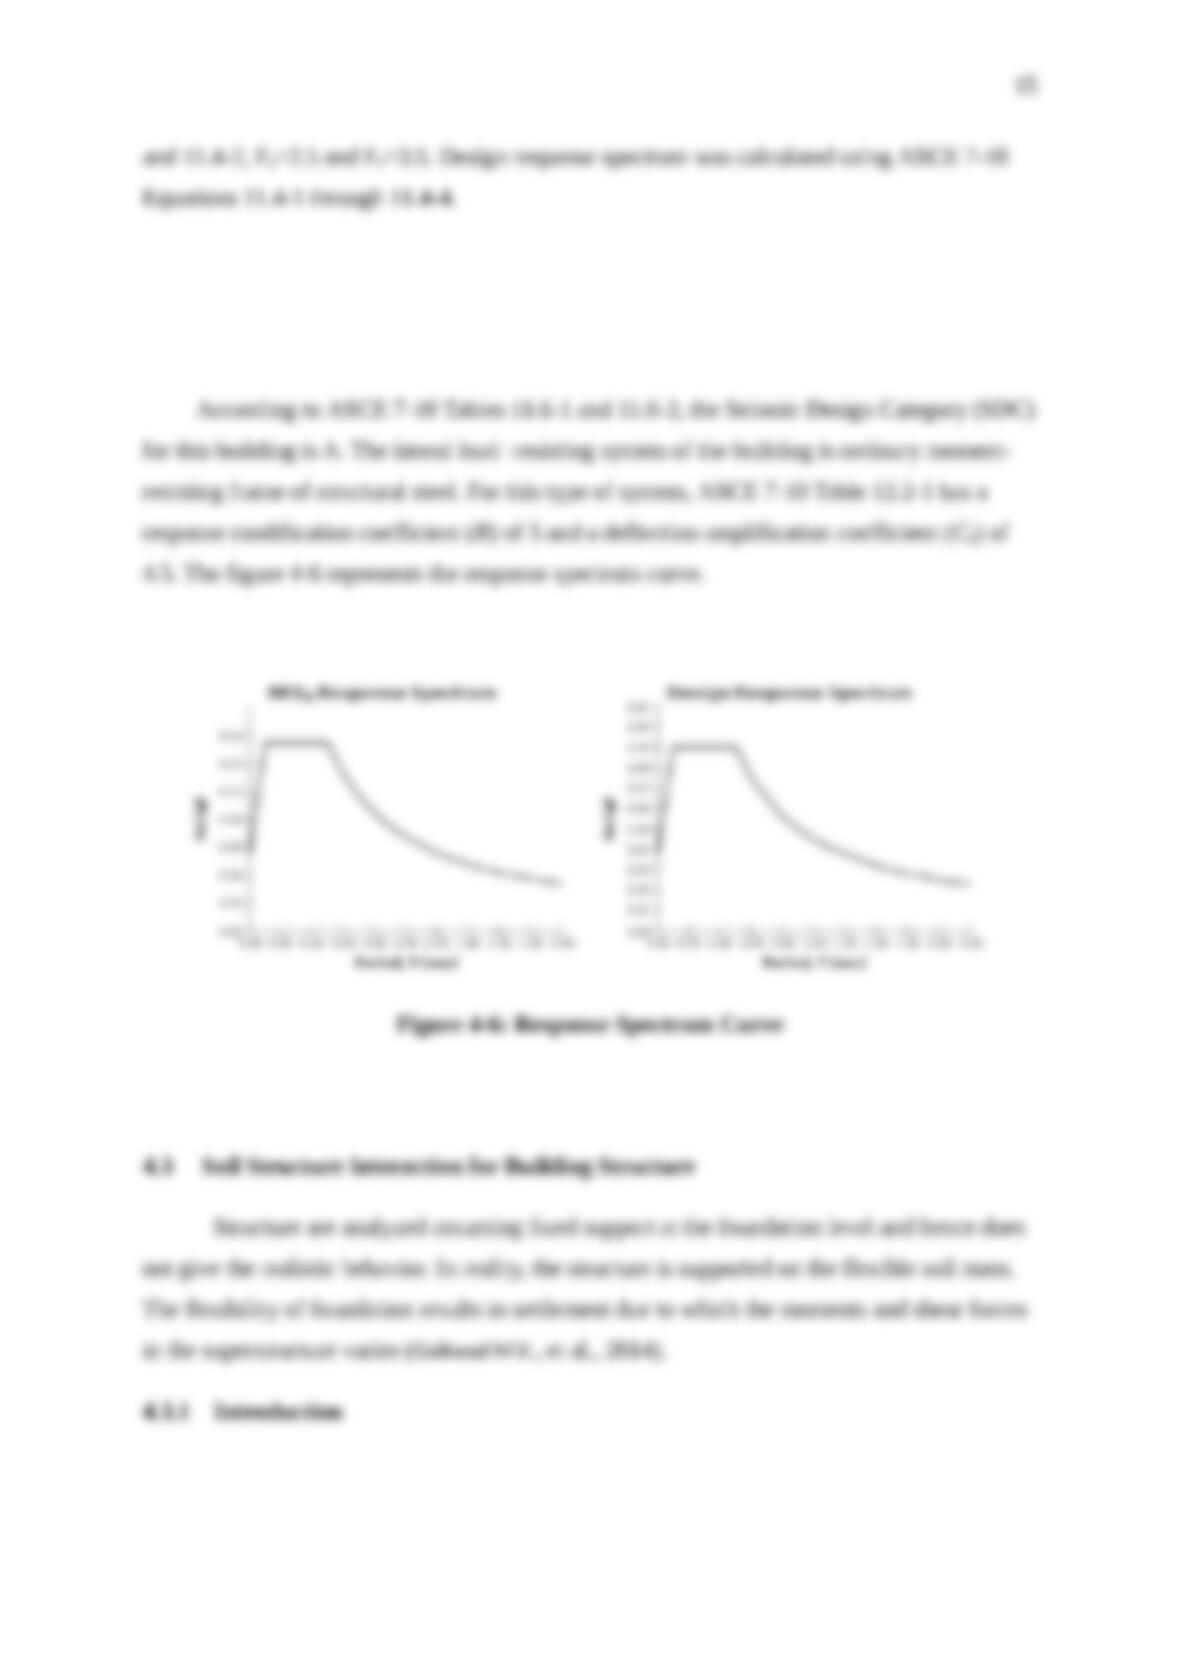
Figure 4-6: Response Spectrum Curve………………………………………………………………………. 15
Figure 4-7: Three Dimensional Soil Structure Interaction………………………………… 22
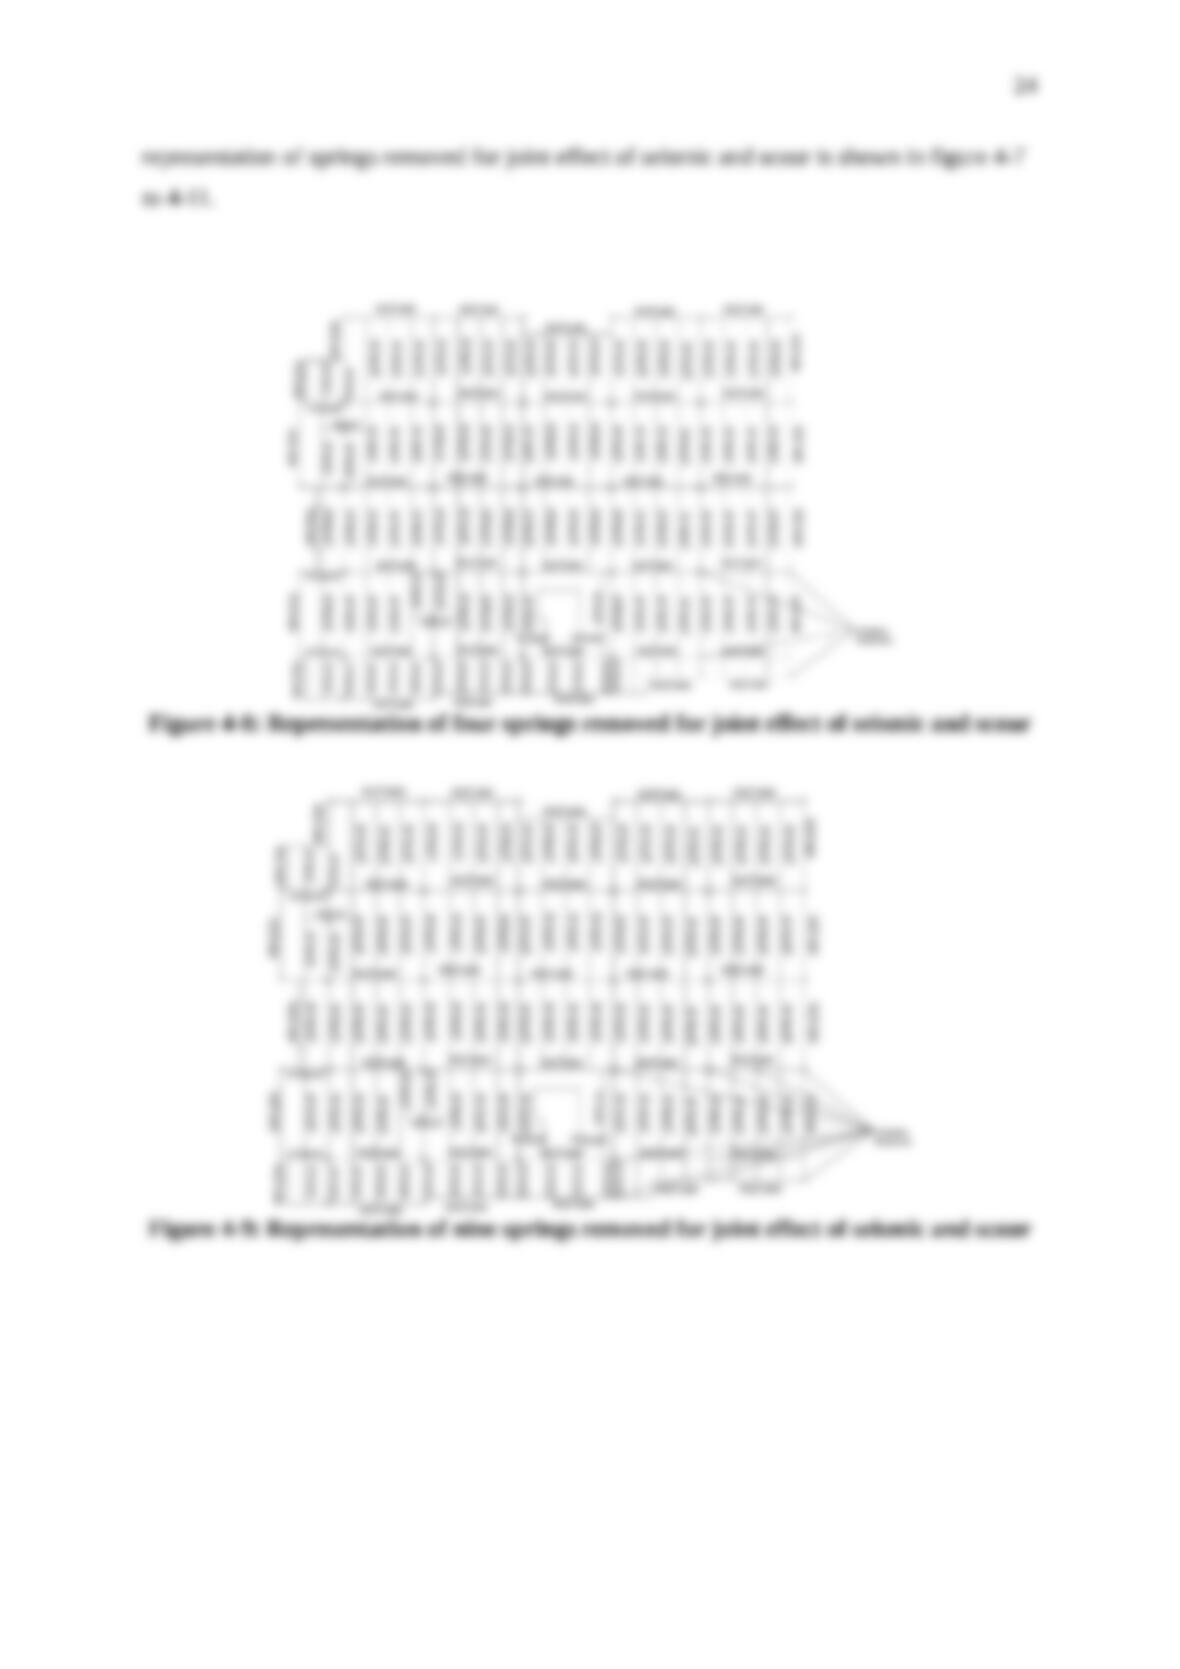
Figure 4-8: Representation of four springs removed for joint effect of seismic and scour… 24
Figure 4-9: Representation of nine springs removed for joint effect of seismic and scour… 25
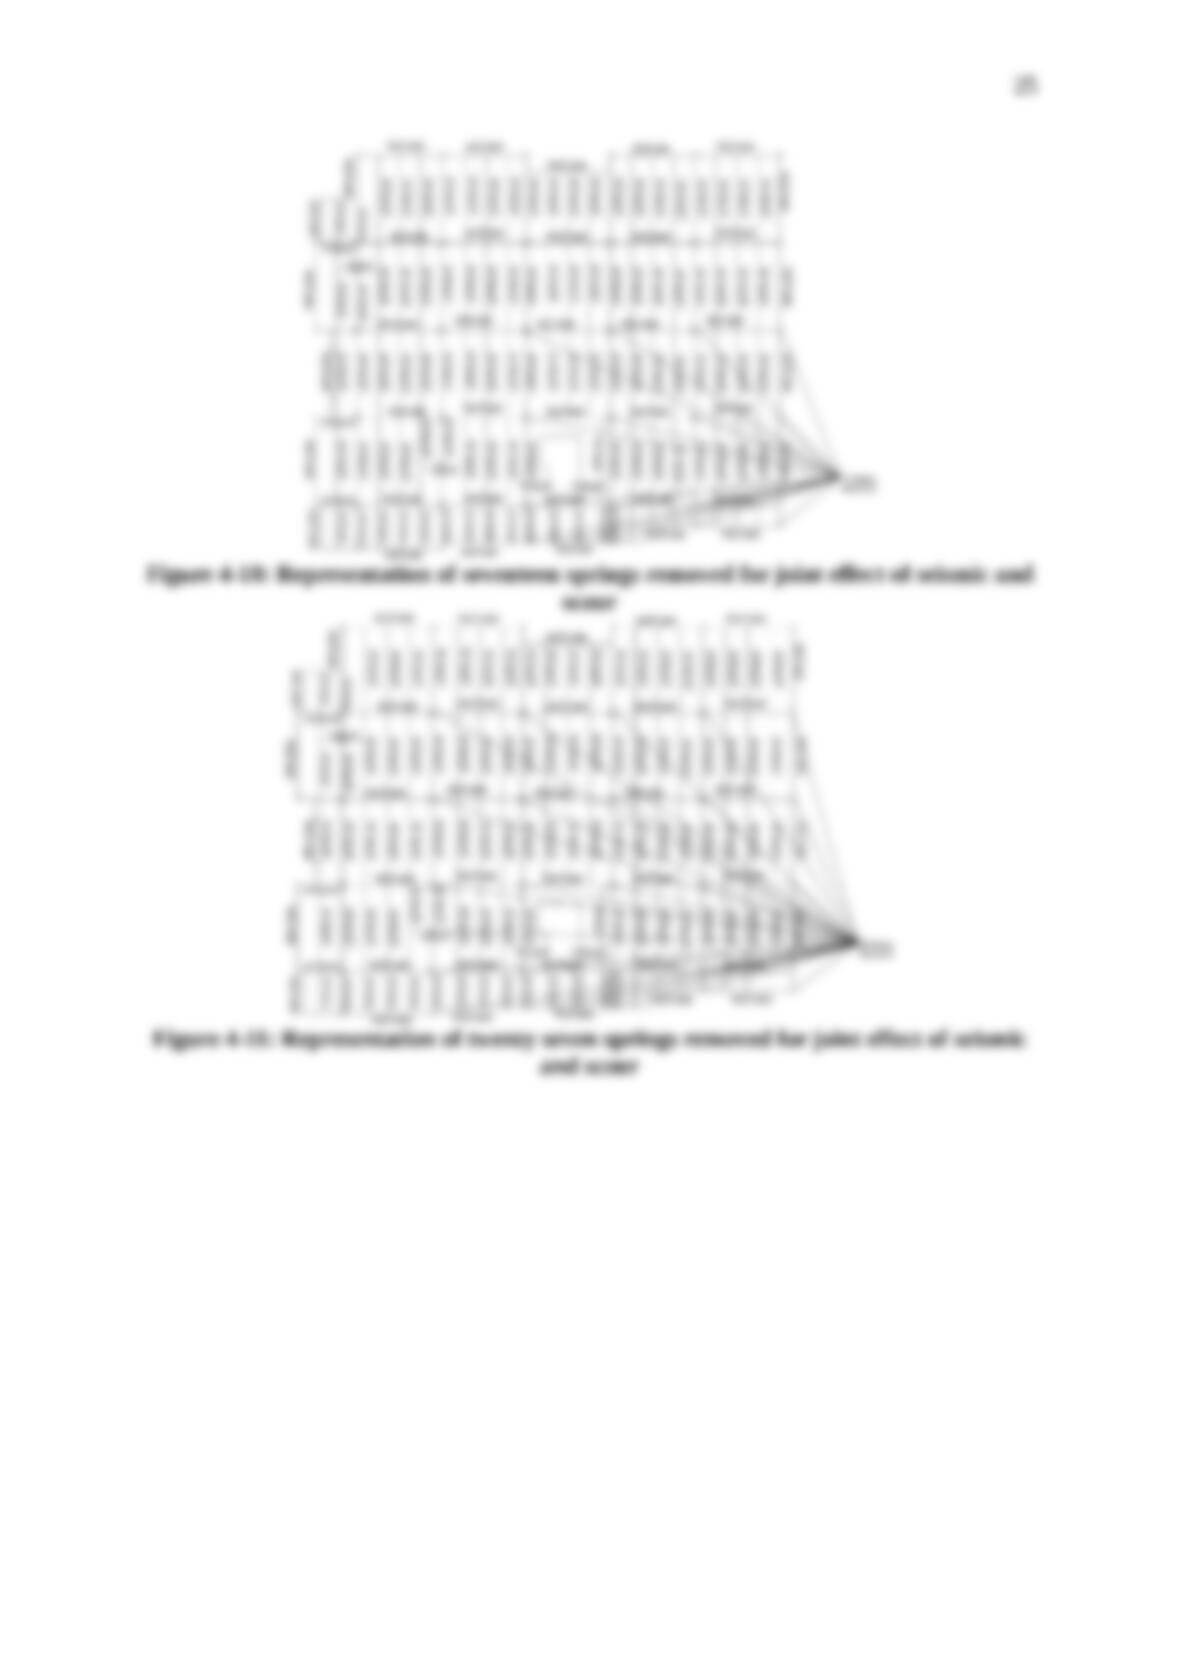
Figure 4-10: Representation of seventeen springs removed for joint effect of
seismic and scour…………………………………………………………………………………………. 25
Figure 4-11: Representation of twenty seven springs removed for joint effect
of seismic and scour………………………………………………………………………………………26
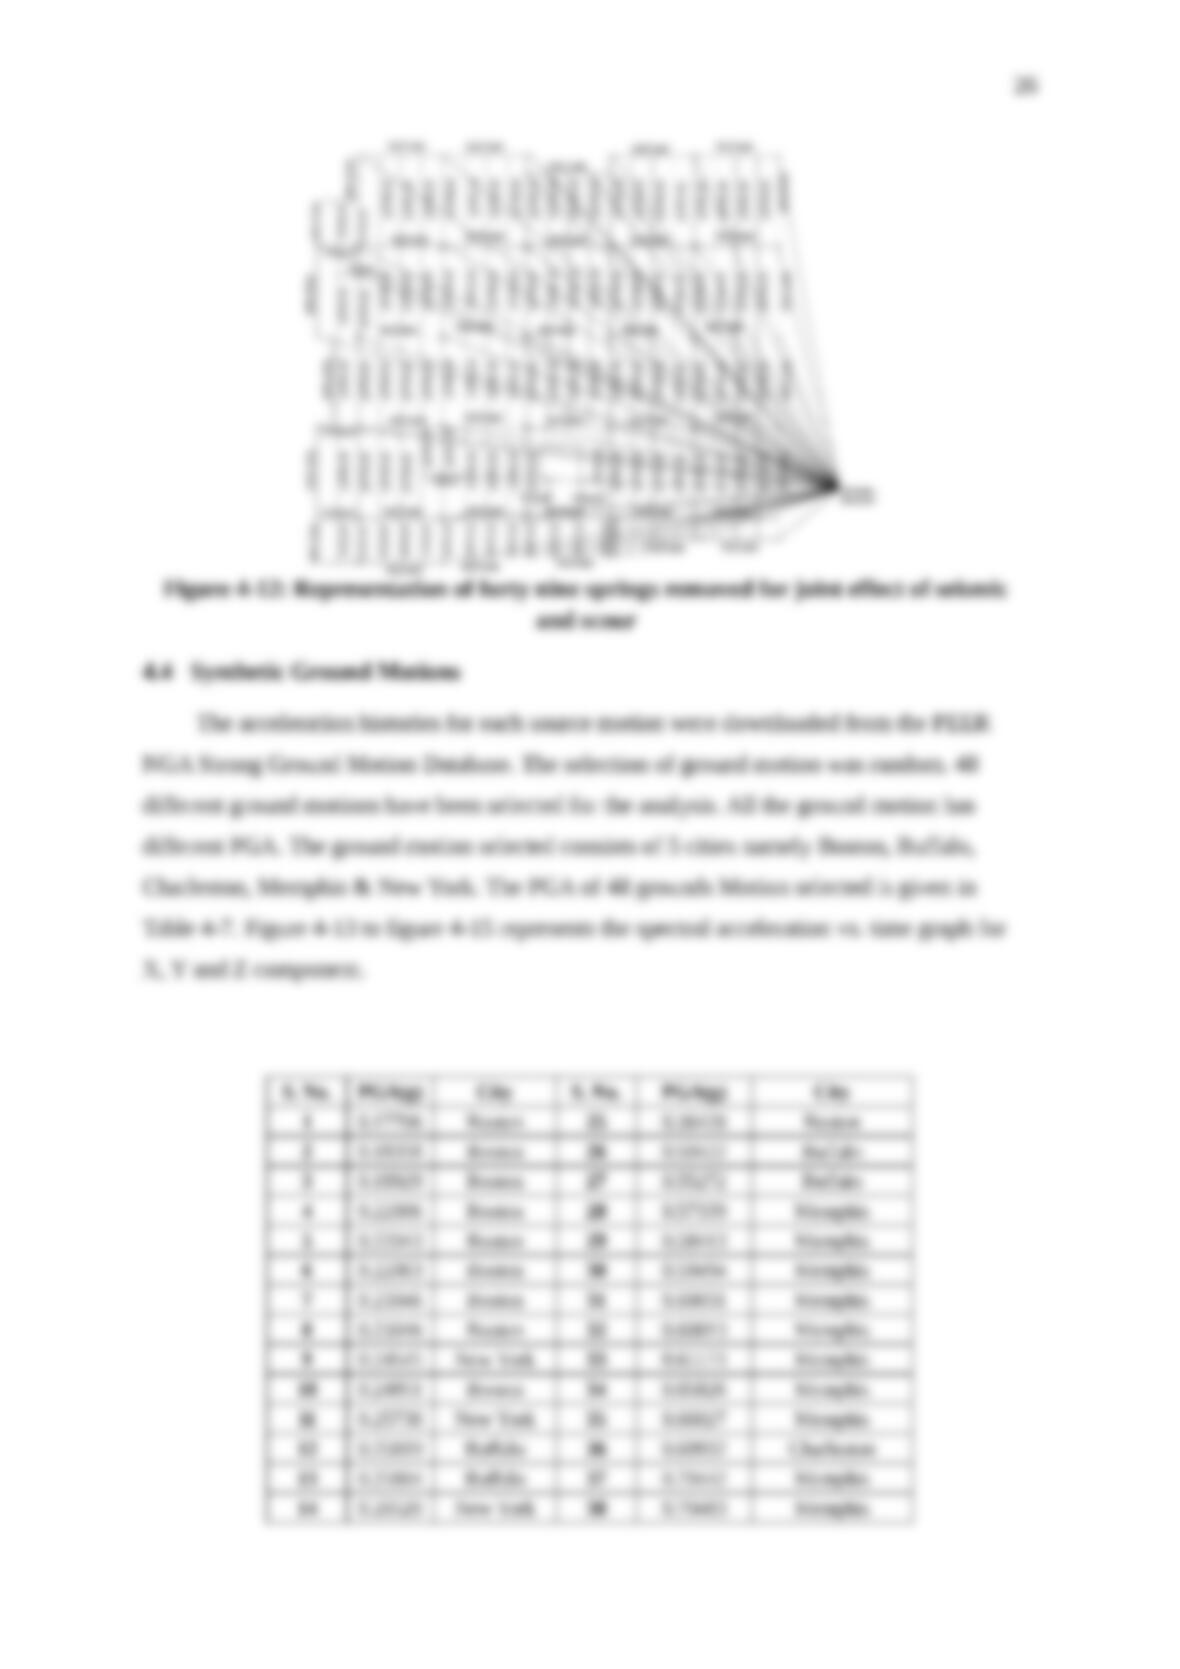
Figure 4-12: Representation of forty nine springs removed for joint effect of
seismic and scour…………………………………………………………………………………………. 26
Figure 4-13: X-Component Spectral Acceleration Vs Time…………………………………………. 28
Figure 4-14: Y Component Spectral Acceleration Vs Time…………………………………………. 28
Figure 4-15: Z Components Spectral Acceleration Vs Time Graph………………………………. 29
Figure 4-16: Inter-story drift …………………………………………………………………………………….29
Figure 5-1: Fragility Curve XYZ-Component for Fix support……………………………………….33
Figure 5-2: Fragility Curve XYZ-Component for spring support………………………………….. 33
Figure 5-3: Fragility Curve XYZ-Component for Soil-Structure interaction for
the four springs removed……………………………………………………………………………… 34
Figure 5-4: Fragility Curve XYZ-Component for Soil-Structure interaction for
the nine springs removed………………………………………………………………………………. 34
Figure 5-5: Fragility Curve XYZ-Component for Soil-Structure interaction for
the seventeen springs removed……………………………………………………………………… 35
Figure 5-6: Fragility Curve XYZ-Component for Soil-Structure interaction for
the twenty seven springs removed………………………………………………………………….. 35
Figure 5-7: Fragility Curve XYZ-Component for Soil-Structure interaction for
the forty nine springs removed………………………………………………………………………..36
Figure 6-1: Fragility curves of performance levels of each parameter: (a) IO;
(b) LS; and (c) CP……………………………………………………………………………………….. 38
Figure 6-2: FEMA structural performance levels (IO) XYZ-component……………………….. 39
Figure 6-3: FEMA structural performance levels (LS) XYZ-component……………………….. 39
Figure 6-4: FEMA structural performance levels (CP) XYZ-component……………………….. 40
6
LIST OF TABLES
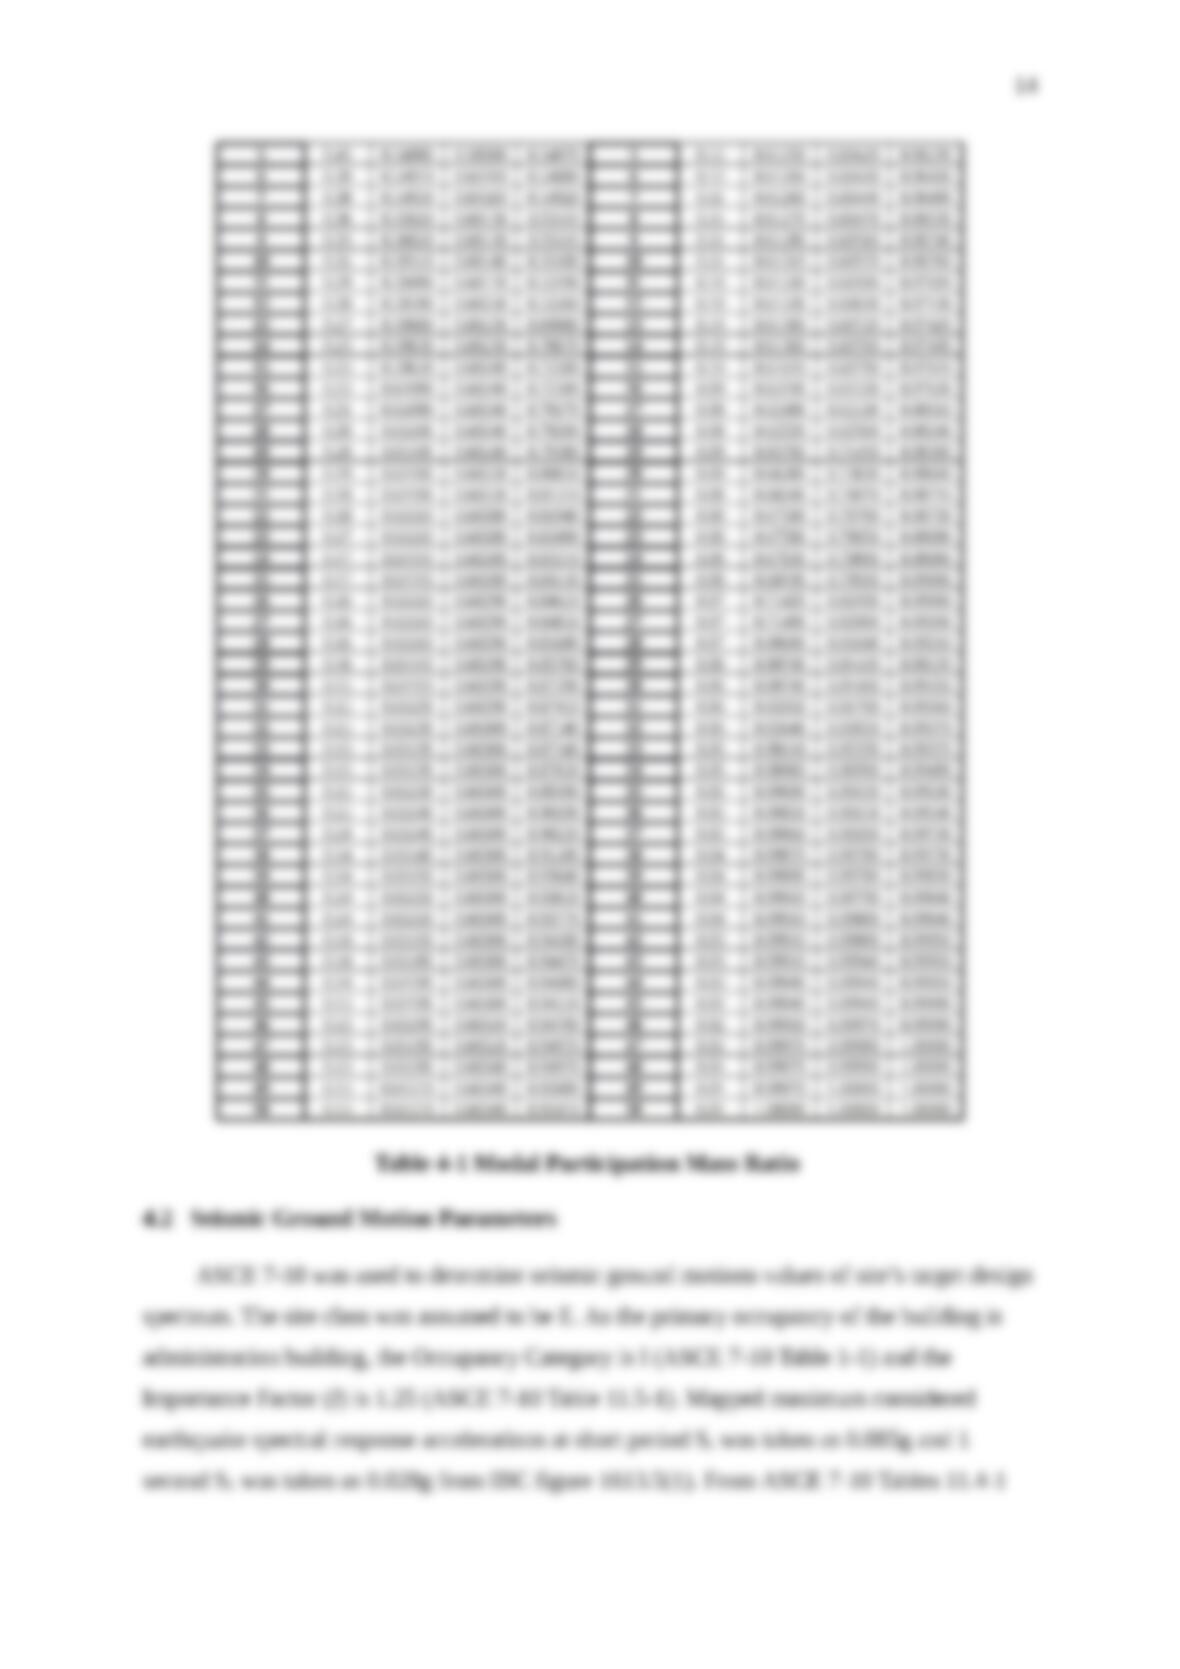
Table 4-1: Modal Participation Mass Ratio………………………………………………… 14
Table 4-2: Values of Shear Wave Velocity and Shear Modulus Reduction for various
Site Classes and Shaking Amplitudes (ASCE, 2010; FEMA, 2009)…………………….17
Table 4-3a: Elastic Solutions for static stiffness for rigid footings at the ground surface
(NEHRP, 2012)…………………………………………………………………………………………… 17
Table 4-3b: Embedment Correction Factor for Static Stiffness of Rigid Footings
(NEHRP, 2012)…………………………………………………………………………………………… 18
Table 4-4a: Dynamic Stiffness Modifiers and Radiation Damping Ratios for Rigid
Footings (NEHRP, 2012)………………………………………………………………………………. 19
Table 4-4b: Dynamic Stiffness Modifiers and Radiation Damping Ratios for Embedded
Footings (NEHRP, 2012)………………………………………………………………………………. 20
Table 4-5: Summaries of Effective Profile Depth and Average Effective Profile
Velocities for the Brookings City & County Building………………………………………. 22
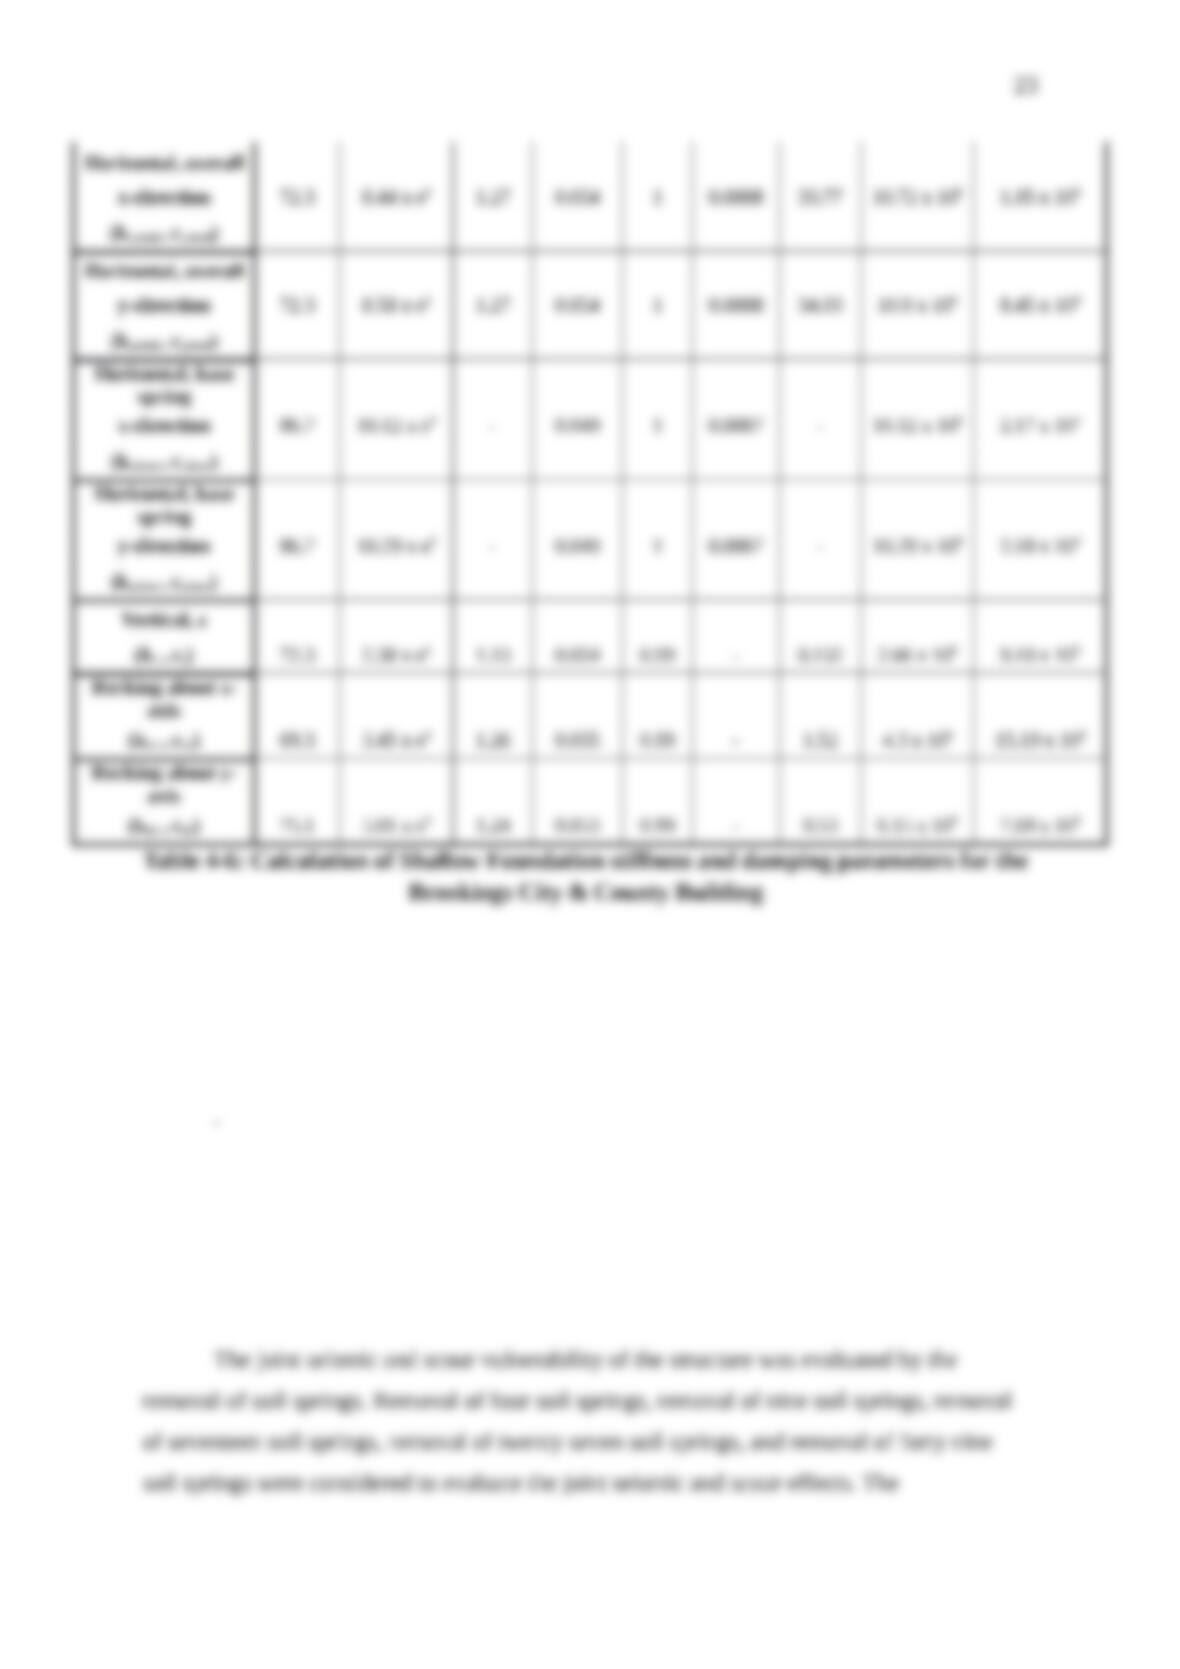
Table 4-6: Calculation of Shallow Foundation stiffness and damping parameters
for the Brookings City & County Building……………………………………………………….23
Table 4-7: Ground Motion peak ground accelerations (PGAs)……………………………………… 27

7
ABSTRACT
COMBINED SEISMIC AND SCOUR VULNERABILITY ASSESSMENT OF STEEL
MOMENT RESISTING FRAME STRUCTURE USING CURSORY SATELLITE
IMAGERIES
RAUNAK SHUKLA
2015
Given the majority of the steel moment frame structures located in a region classified as the
low seismically active and high flood prone area, vulnerability assessment on such structures
subjected to combined effects of seismic and scour loads is needed. This paper focuses on
combined seismic and scour vulnerability assessment of a three-story existing steel moment
resisting frame structure in the Midwestern region of the United States. The structure
dimensions were initially measured using satellite imageries of the selected structure via
commercial scale map tools and calibrated with those from the design plan having beam and
column details which were detained from the building owner. With all the structural
information, a finite element model of the structure with soil springs reflecting the soil-
structure interaction behaviors during an earthquake was created through commercially
available finite element software, SAP2000. To account for joint seismic and scour risk, a
total of forty eight synthetic ground motions having different spectral accelerations (Sa) were
used, and the soil springs were progressively removed. Numerous nonlinear time history
analyses reflecting the effects of scour effects by adjusting the removed soil spring number
was conducted to determine peak inter-story drifts (PISDs) of the structure. Federal
Emergency Management Agency (FEMA)-based three performance levels (i.e., immediate
occurrence, life safety, and collapse prevention) were used for creation of joint seismic and
scour vulnerability functions. Significant findings show that the joint seismic and scour
vulnerability of the structure increased as they become more damaged due to the reduced
resistant forces from the removal of soil springs over a broad spectrum of Sa.
1
1 INTRODUCTION
1.1 Background
The seismic vulnerability assessment of existing steel building structures is one of the
priorities for many earthquake engineers and researchers (Plasticier, 2007) to help
probabilistically measure their structural vulnerability and to establish systematic earthquake
mitigation planning. Steel moment-resisting frame structures have been widely used in all
seismic zones because of favorable mass-to-stiffness ratio and ductility which enhances
energy absorption capacity (Sarno, 2002). Typically, steel frame structures are divided into
three types: moment resisting frame (MRF) structure, concentrically braced frame (CBF)
structure, and eccentrically braced frame (EBF) structure. They exhibit different structural
behaviors with respect to stiffness, strength and ductility of an earthquake (Sarno, 2002). In
fact, past earthquakes, including 1994 Northridge earthquake in the United States, 1995
Hyogoken-Nanbu earthquake in Japan and 1999 Chi-Chi earthquake in Taiwan, arouse
unexpected significant damage to certain structural components of low- to mid-rise steel
framing structures (Sarno, 2002). The damages were widespread and extensive throughout
residential or commercial building structures (Sarno, 2002). Specifically, Northridge
earthquake caused the most damage to low-rise steel frame structures with no casualties
(Mahin, 1998). The past earthquake demonstrated that several structural components, such as
moment connections, have a significant influence on seismic performance, resulting in
associated structural vulnerability of such structures. Hence, some provisions related to
seismic resistance of moment connections, including Structural Engineers Association of
California (SEAOC), Federal Emergency Management Agency (FEMA) regulations, and the
ASCE 7-10 design standard, are included.
The majority of the steel moment frame structures located in a region classified as the low
seismically active and high flood prone area, vulnerability assessment on such structures
subjected to combined effects of seismic and scour loads is needed.
1.2 Objectives
The objective of this paper is to evaluate the vulnerability assessment of a three-story
existing steel moment frame structures located in Midwestern region of the United States,
subjected to combined effects of seismic and scour loads. This evaluation was accomplished
by performing numerous nonlinear time history analyses using computational finite element
analysis software. Specific tasks are made to achieve the objective as follows:

2
Measure the dimension (height, length & width) of the selected structure using
cursory satellite imageries.
Evaluate soil-structure interaction of the structure.
Evaluate seismic performance of the structure subjected to forty eight ground
motions.
Develop combined seismic and scour vulnerability of fragility curves for the
structures.
1.3 Scope of Work
The structure dimensions were measured using their satellite imageries via
commercial scale map tools and calibrated with those obtained from the design plan having
beam and column details. Three dimensional finite element models were created using
commercially available finite element software SAP2000. To account for different seismic
intensities of the building, a total of forty eight ground motions having different peak ground
accelerations (PGAs) ranging from 0.1 g to 1.2 g were used. Structure was modeled for soil
flexibility. To consider soil-structure interaction behavior, both the effect of soil-structure was
taken into account to evaluate the stiffness in translational and rotational direction. To
account for joint seismic and scour risk, the soil springs were progressively removed.
Nonlinear time history analysis was conducted to determine inter-story drifts (ISDs) of the
structure subjected to forty eight ground motions. Three performance levels, e.g., immediate
occurrence, life safety and collapse prevention were considered for seismic fragility analysis.
Fragility curves were developed using commercial method.
1.4 Outline
This paper focuses on measurement of dimensions using cursory satellite
imageries and combined seismic and scour vulnerability assessment of a three-story
existing steel moment resisting frame structure in the Midwestern region of the United
States.
Chapter 2 describes the previous studies on estimation of structure dimension, seismic
vulnerability assessment, soil structure interaction, development of fragility curves.
Chapter 3 provides building dimension measurement using cursory satellite imageries.
3
Chapter 4 provides an overview of seismic vulnerability assessment and soil-structure
interaction to account for the foundation flexibility.
Chapter 5 describes three performance levels based on federal emergency management
agency (FEMA) which were considered in this study for the creation of joint seismic and
scour vulnerability functions and explains the procedure for creating fragility curves.
Chapter 6 describes the comparison of FEMA performance levels with spectral acceleration
median range to account for the joint seismic and scour effect.
Chapter 7 provides a summary, conclusion remark and recommendation for future research.
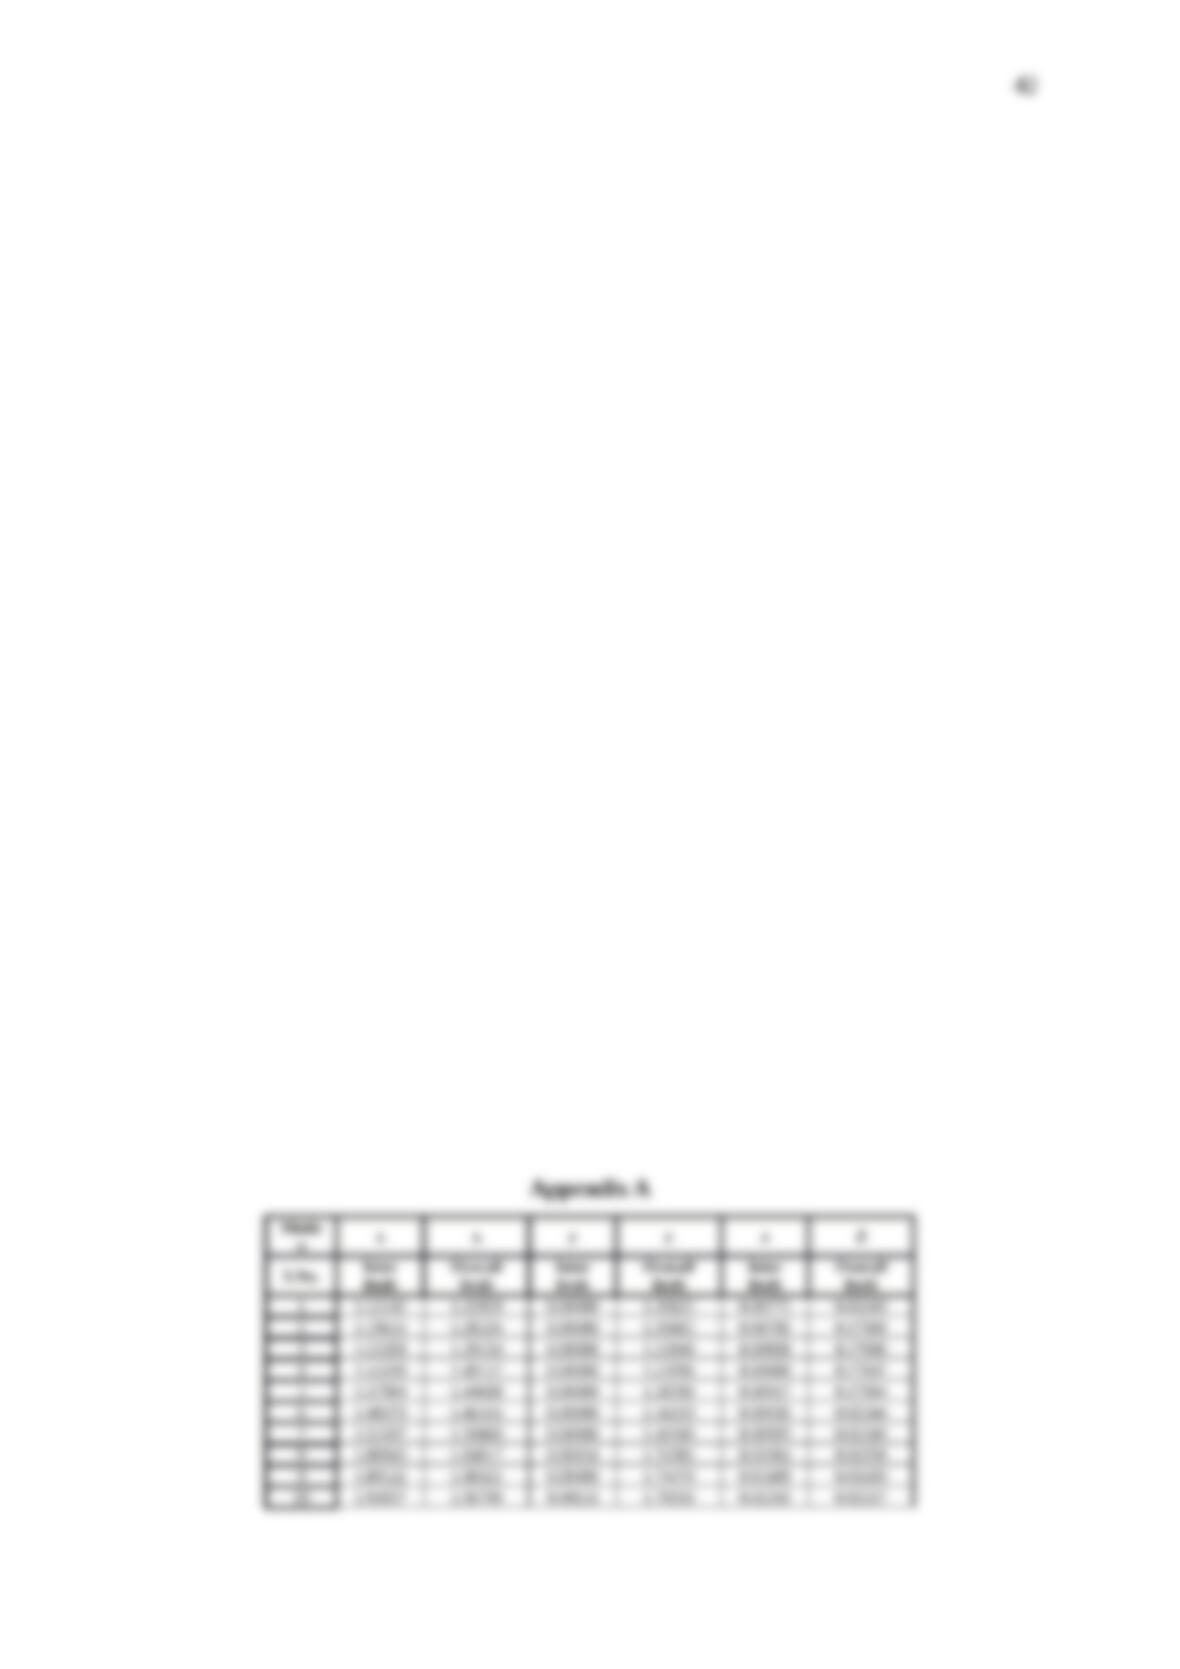
Appendix provides the tables of Mass participation ratio and inter-story drift for all the cases
considered in combined effect of seismic and scour loads.
A list of references cited from the body of literature review is provided at the end of this
paper.
4
2 LITERATURE REVIEW
This chapter reviews information about previous studies on structure dimension
determination using cursory satellite imageries, seismic vulnerability assessment, soil-
structure interaction, and development of fragility curves.
2.1 Estimation of Structure Dimensions
The vulnerability assessment of the structure can be measured using satellite
imageries. High-resolution satellite imageries were used to estimate damage for the Bhuj,
India during 2001 earthquake (Chiroiu L., 2001). The study provided the fast loss estimation
of physical damage and human casualties. During past few years measurement of structure
configurations using satellite images has gained lot of attention (Meng, 2009). Building
extraction requires high-resolution satellite images with a resolution higher than 5meters (Jin
and Davis, 2005). To identify buildings by using structural, contextual and spectral
information a 1-meter resolution satellite imagery is needed (Jin and Davis, 2005).
Morphological building detecting method was employed to identify building configuration by
gradually removing non-building pixels (Meng, 2009). A methodology was evaluated to
determine the height and position of buildings in dense residential areas by using IKONOS
stereo imagery (Shaker, 2011). An automated extraction of buildings by high-resolution
satellite imagery with different rooftops utilizes structural and spectral information by using
Artificial Neural Networks (Lari, 2007). Building reconstruction from a single digital surface
model (DSM) was usually monitored based on a stochastic approach (Lafarge, 2007).
Reconstruction of structures involved assembling simple urban structures extracted from a
library of 3D parametric models, this method was well adapted to data of average quality
such as high-resolution satellite imageries. Still need further work on estimation of structure
configuration.
2.2 Seismic Vulnerability Assessment
A proper evaluation of the seismic risk in existing buildings is a necessary step in
order to recognize the most critical areas. A number of studies on the seismic risk of steel
moment frame structure have been carried out. The seismic vulnerability assessment of steel
moment resisting frames was studied to determine the impact of higher importance factors
and stringent drift limits (Jeong H. S. et al., 2014). The effects of the risk categories for the
structural periods and the seismic force demand was investigated. The results show that the
5
risk category IV had a decreased in its period by 0.5 to 0.8 and show an increase in strength
by a factor of 1.5 to 3.2. The seismic behavior of weak axis column-tree connection used in
steel moment resisting frames were investigated (Keunyeong et al., 2015). The result showed
that the weak column axis connection with reduced beam section was better than the trapped
connections. The seismic vulnerability assessment of a 20-story steel moment resisting frame
structure was conducted to evaluate the performance based on ASCE 7-10. The result showed
that the structure met the code requirements (FraAnnika Mathiasson and Ricardo A. Medina.,
2014). A linear dynamic analysis and nonlinear pushover analyses on a existing irregular 8-
story steel building (Hosseini et al.,). Result showed that for multiple excitations the value of
responses is very high and nonlinear behavior is different for the corner columns then what is
mentioned in recommendation. Erduran, (2010) performed nonlinear response history
analysis to evaluate the multi-intensity seismic response of code-designed conventional and
base-isolated steel frame building. Three-story braced frame building was used. The results of
structural response analysis showed that the isolated structure is more superior to
conventional structures.
2.3 Soil-Structure Interaction (SSI)