Introduction
Coca-Cola or Coke for short has been a staple in American households for years. Some
may wonder how a company that’s been around for 125 years is performing since times are
different now days. Financial statements hold the answer to the question: “how is a company
performing?”. While there are many numbers that may be confusing to the naked eye business
professionals can interpret the numbers. Through this paper, it will discuss and answer the
question: “how is Coke performing?”. To answer this question, a balance sheet, income
statement, and various ratios will be used.
Balance Sheet
A balance sheet is a company’s financial position as of a specific date, based on
measurements made in accordance with generally accepted principles (GAAP) or some other
reporting basis (Bruns, 2017, pg. 3). Coke’s balance sheet is made up of assets, liabilities, and
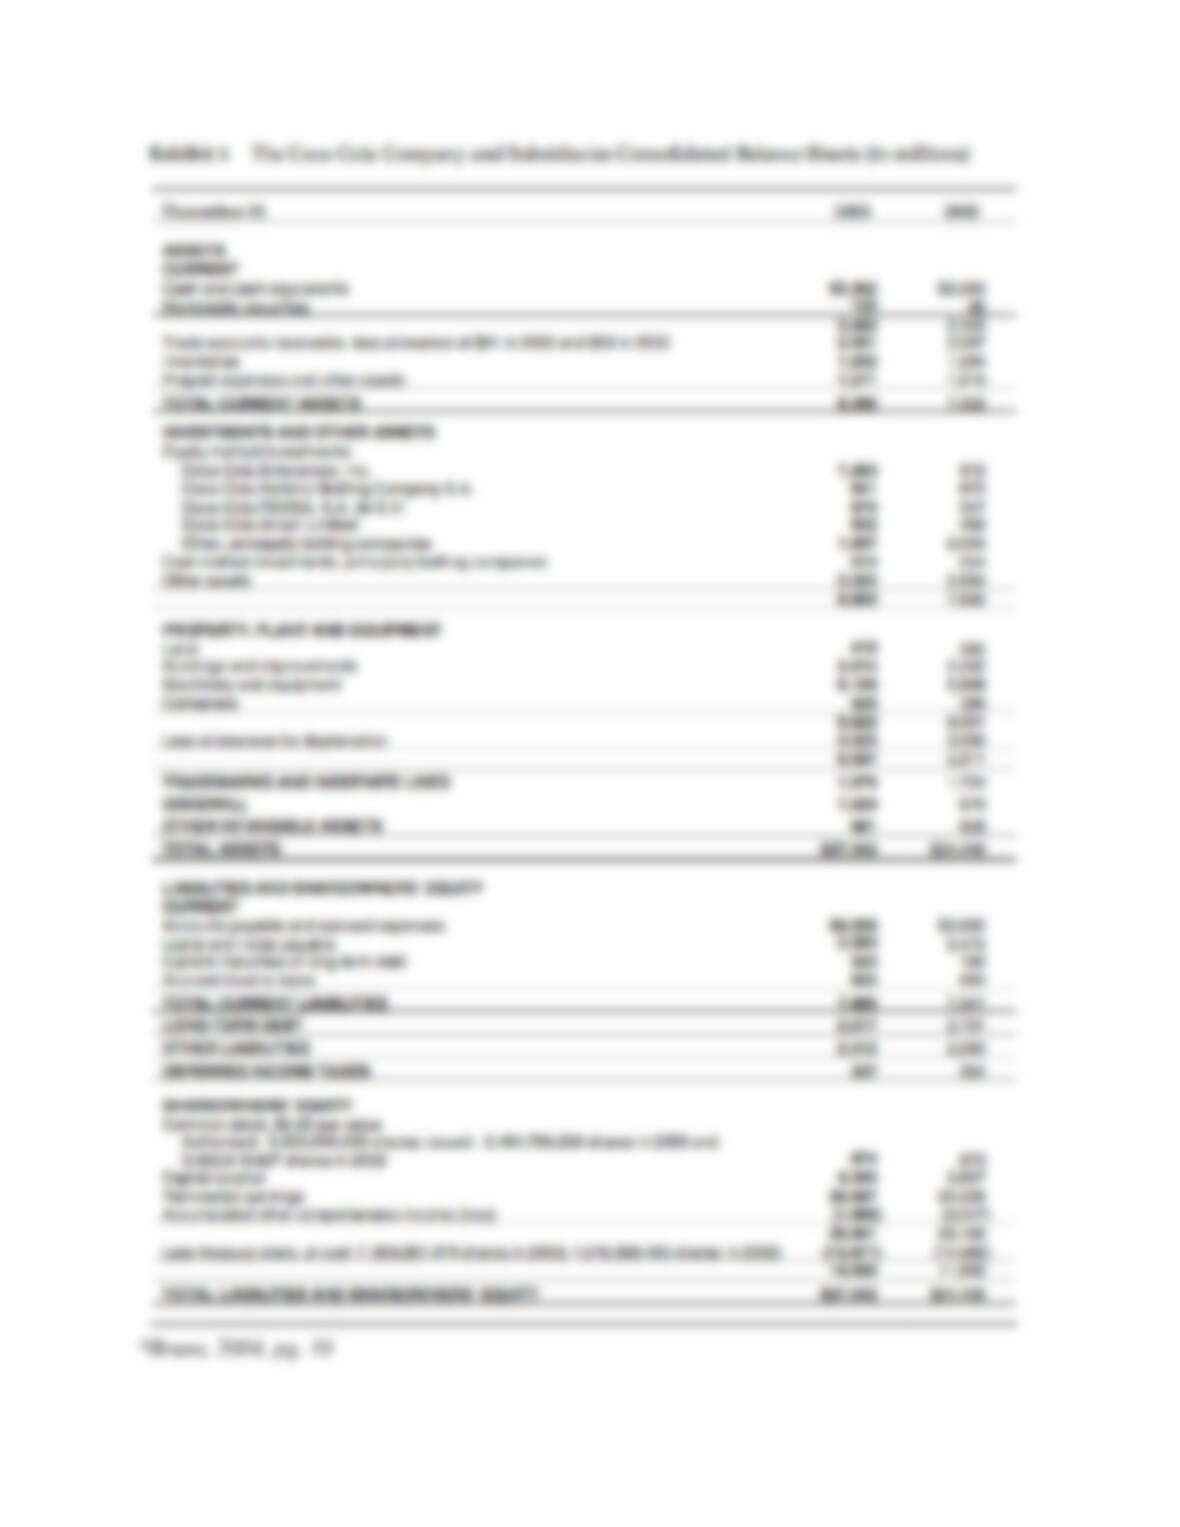
shareowner’s equity. For a balance sheet to be correct, assets must be equal to liabilities plus
shareowner’s equity which, is what Coke’s exemplifies (see exhibit 1).
When looking at Exhibit 1, almost all the data is more in 2003 than in 2002. There are
only a couple of sections where the data didn’t increase but one is most interesting: accrued
income taxes. The decrease means that the amount of unpaid taxes decrease which, is a positive
for the company. However, in another section it shows that current liabilities increased by
around $540. This could be a red flag to the naked eye but after calculating the percentage, of
liabilities to assets 2003 is at 28% while 2002 was at 30%, meaning that even though it looks like
an increase it really isn’t. Overall, the balance sheet lets one take a step forward is saying that
coke is performing well.
Income Statement
An income statement is a financial statement that reports a company’s financial
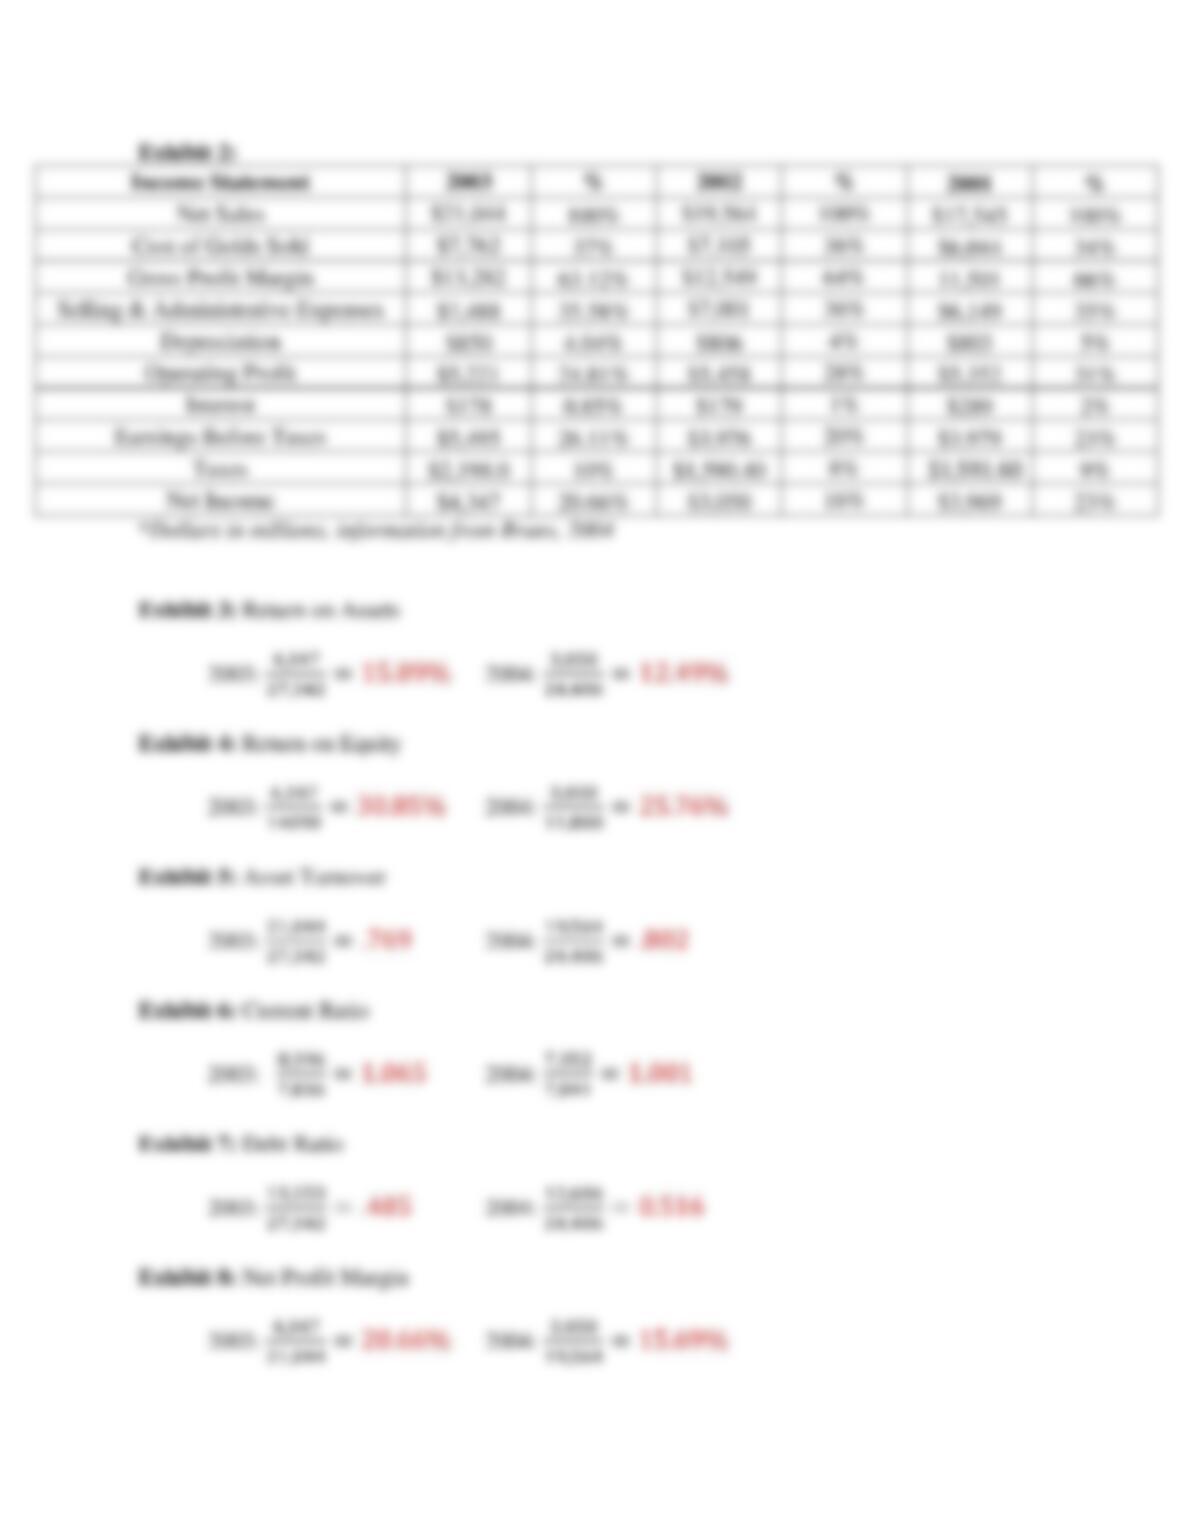
performance over a specific accounting period (Investopedia, 2017). In exhibit 2, it shows the
breakdown of each respective category and the percentage of each in relation to net sales. In
most of the components there is a slight increase from 2001-2003. While the dollar amount can
tell one side of the story the percentages tell a better one. For example, gross profit margin
increases each year however, when one looks at the percentages it’s decreasing. This is one of
the ways that numbers from a company can be deceiving.
There are multiple categories that exemplify the trend listed above. Although, only one
has been identified if one looks it should stand out. These increases show that overall everything
seems to be growing but it also pinpoints areas where it stays the same or decreases. There are