1
Introduction
Our group was interested in learning in depth about what individuals believe to be
important to them by determining how much each individual would spend on goods and services
in personal consumption. The term consumer spending or consumer consumption can be defined
as “another term for voluntary private consumption, or an exchange of money for goods and
services. Contemporary measures of consumer spending include all private purchases of durable
goods, nondurables and services. In a purely free market, the aggregate level of private
consumer spending in an economy is necessarily equal to the total market value of economic
output” (Consumer Spending). From recent reports they have shown that by understanding how
individuals spend their money it gives evidence to how to be successful in managing the
economy and it gives deeper knowledge into what products are greater in importance to
consumers through where and how each individual decides to spend their own money. But why
is this important one may ask?
According to Osmond Vitez, “a national economy is a broad amalgamation of individual,
business and government spending or investment. Governments typically pay close attention to
economic factors to measure the strength of an economy. Consumers represent a major factor in
economies” (Vitez). In addition, Vitez states that, “according to Henry Hazlitt, author of
“Economics in One Lesson,” U.S. consumers account for approximately 70 percent of the
national economy. Spending is an important role of consumers. Free market economies rely on
consumer demand to gauge the allocation and distribution of economic resources” (Vitez). To
break this down even further, it is important to understand that every consumer has an essential

2
part in regards to providing the economy with a sufficient amount of spending to generate
economic growth. A company and/or employer are accountable for paying and providing their
employees with an agreeable and functional wage that the individual receives for his or her
services to the company. In addition, the government will take a percentage of the wages that
the company gives to the employees as tax revenue, which in return provides goods and services.
This relies on both the employee and the employer in order to work correctly.
Then, banks as well as other financial organizations are accountable for loaning funds to
the individual and the company for the reasons of spending and investments. If interference
were to happen in any of these four divisions, the results would be far from pleasant. For
instance when buyers decide to cut back on their spending habits, this will lead to a domino
effect in the economy. When consumers begin to cut back on spending on goods and services,
tax revenues will decrease, which causes demand for goods and services to decrease as well.
Then in response, suppliers will start to cut back, which leads to a decrease in employee wages
and an increase in unemployment, and if this trend continues it could lead to an overall recession.
In rare situations, a steep decline in tax revenue could result in government defaults as well as a
stoppage of banks loaning out money. In addition, Osmond Vitez states that “significant changes
to consumer spending in durable and luxury goods can be an important economic indicator.
Consumer spending increases in these two categories usually represent individuals with higher
income. Conversely, spending decreases may indicate lower individual income or consumer
confidence. These spending categories can help businesses and governments determine if
consumer spending is expanding or contracting based on the number of purchases” (Vitez). Not
only is consumer spending important for the economy, but is important to understand how
consumers are spending their money and where these consumers are spending their money.
3
Our group pursued to answers the question of how and where consumers spend their
money through conducting a questionnaire. By doing a questionnaire, our group was able to take
a large amount of information and distribute it to a large amount of people in a short period of
time. An advantage of using the questionnaire was that it was already produced, the results were
quickly and easily measured by the website that was used, and the data produced from the
questionnaire was easily able to be compared and contrasted to create a final report. This
questionnaire was targeted at our focus group of individuals who have obtained an undergraduate
degree or have at least some college and/or job experience. The questionnaire was hosted on a
website where participants were able to follow the link and complete the questionnaire for our
research. How our group constructed the questionnaire will be discussed later in the report, as
well as the final results and a discussion will be discussed later.
For this project, our group hypothesized that the consumers who are spending a higher
percentage of their income on consumption are more likely to consider outside pricing influences
like inflation. Meaning, individuals consume based on their overall approximation of
forthcoming income, not based merely on their current after tax income. For example, think
about a college student at San Jose State University that is about to graduate. If that college
student has continued to borrow large amounts of money for tuition and other expenses, then the
college student is probably in a reasonable volume of debt. However, the only reason the college
student put themselves in that situation is based on the fact that in the future, after college, this
person will retain a job with their college degree. With their new salary they will pay off the
large amount of debt owed. In other words, the consumer or college student in this situation
went into debt knowingly, due to the fact that a future salary would pay off the current debt
owed. Consumer spending is a significant factor for a healthy economy because it typically goes
4
hand in hand with the general consumer assurance in a nation’s economy. For example,
according to Osmond Vitez, he states that “high consumer confidence indicators usually relate to
higher levels of consumer spending in the economic market. Consumer confidence provides
governments and businesses with an analysis on consumer perception” (Vitez). Through
situations like the college student at San Jose State University and through our project we hope
to gain a better understanding of how and where our participants, or the consumers, spend their
money.
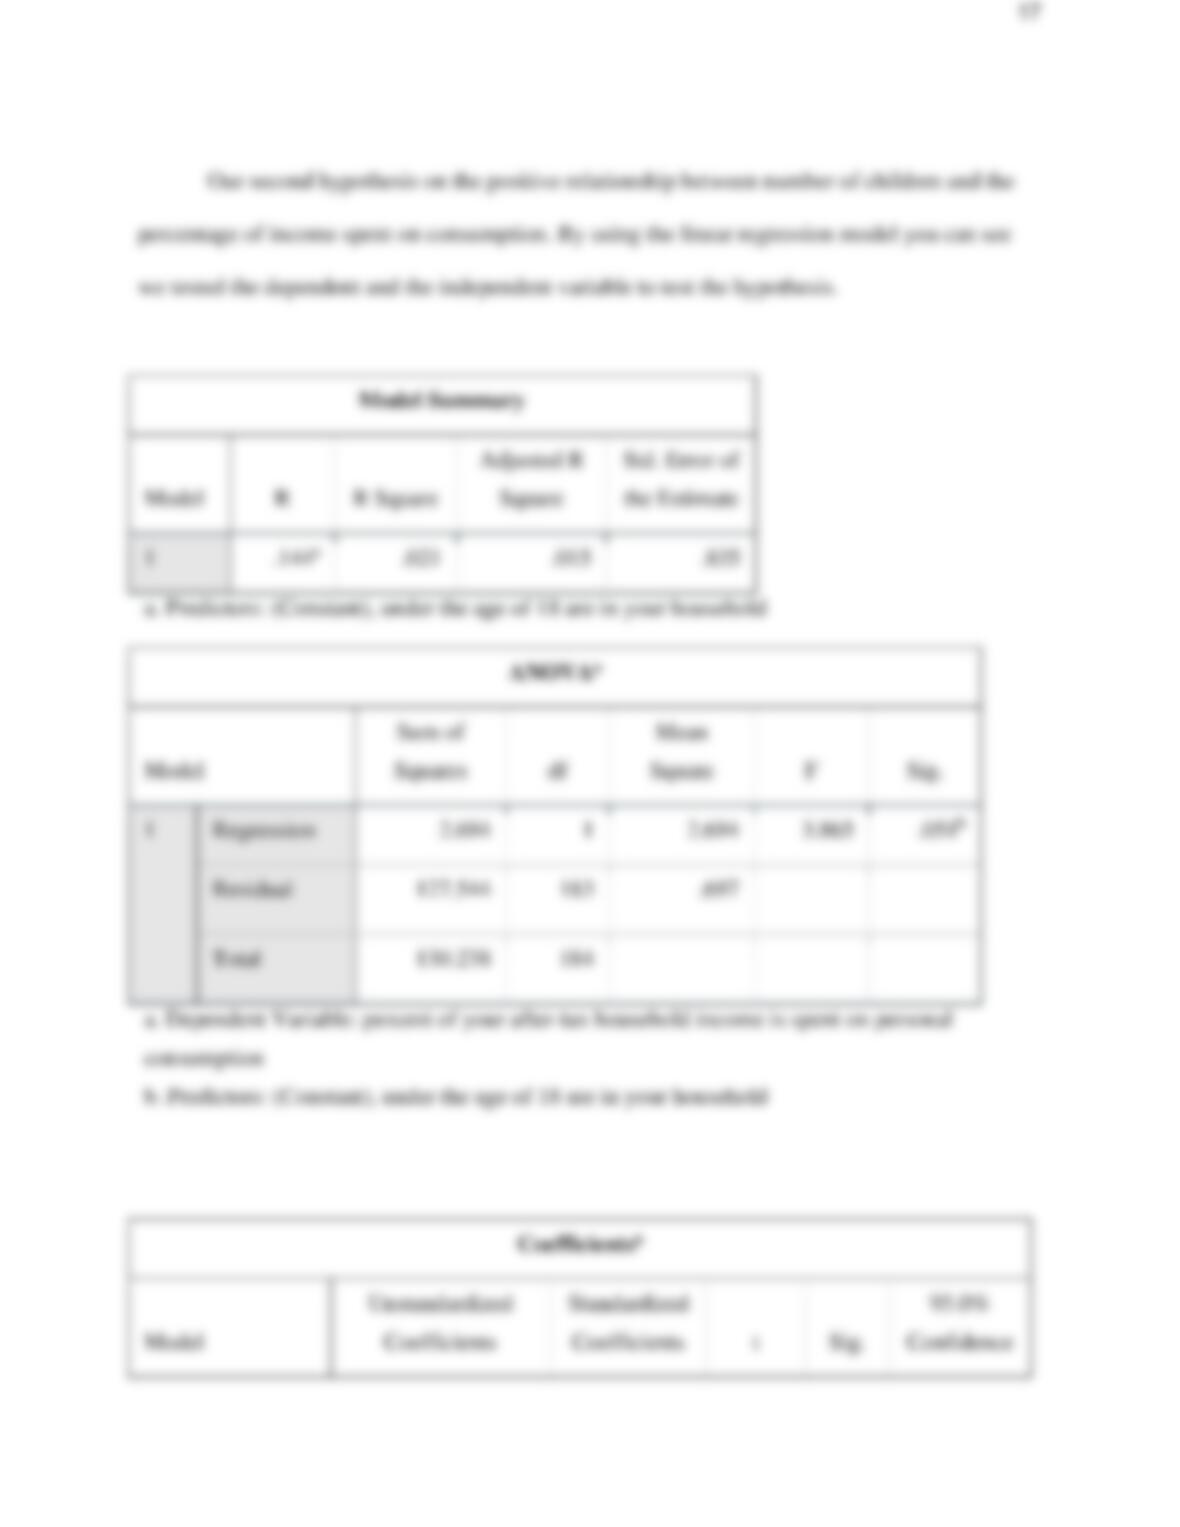
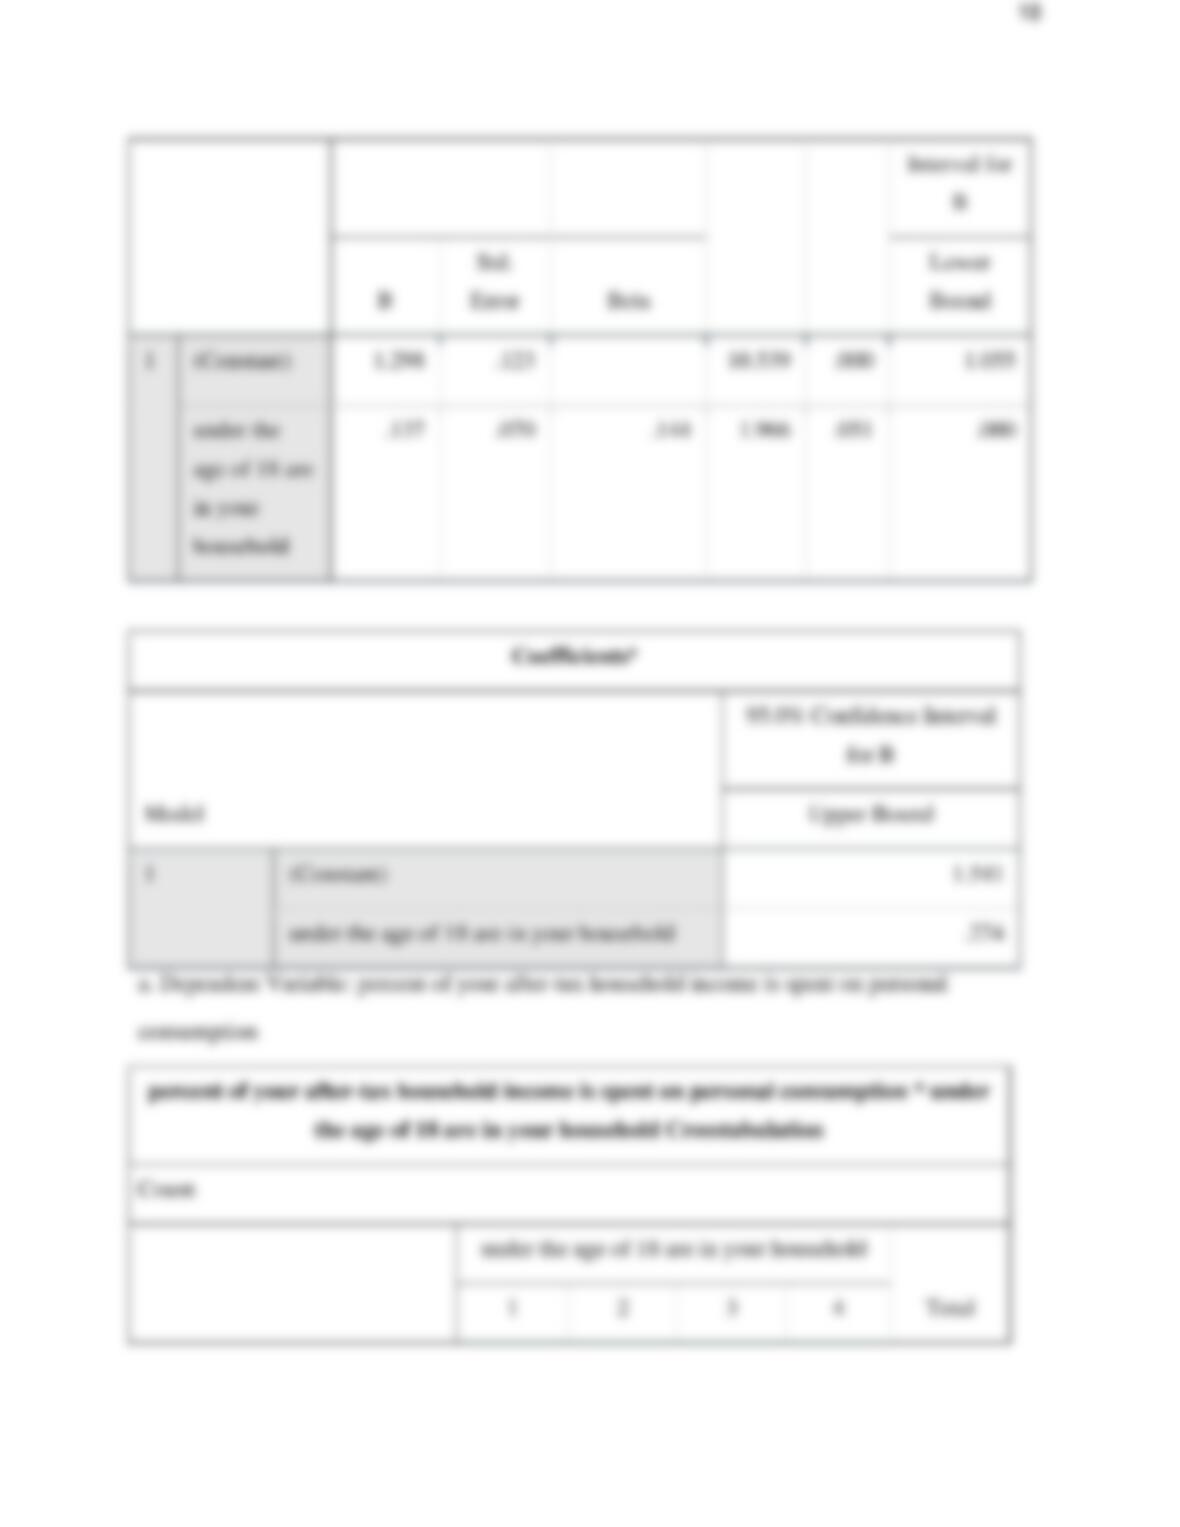
The number of children in the household is positively correlated with an individual’s
percent of after tax income is spent on consumption. This is our group’s second hypothesis that
we wish to prove. We anticipate seeing a positive relationship between the number of children in
the household and anticipated spending on consumption. We believe this is a reasonable
hypothesis because those that have dependent children are more likely to allocate a larger part of
their income for consumption. It costs money to have a family and research has shown that those
that have children are more likely to spend on consumption.
Method
For our method our group used a closed ended questionnaire. A closed end questionnaire
is used for quantitative data. In a closed ended questionnaire there are only a few answers to
choose from. This makes it easier to gather data information. For a qualitative data we would
have chosen open-ended questionnaire.
Closed questions have the following characteristics, they give you facts, you can answer
them easily and quickly. Since these questions are so easy to answer, the questionnaires can be
performed very quickly. The time requirement for a closed ended questionnaire is about 20-30
minutes while for an open ended questionnaire would take longer than 30 minutes (2002).
5
For this survey the qualifications were the participants had to have a higher education.
They should have at least a college education. Then the survey also offered qualifying questions,
or screening questions. Screening questions are usually placed in the beginning of a survey in
order to determine if the respondents qualify for the questionnaire. Usually if people are
ineligible if they don’t meet all the requirements. Why are these questions used? There are many
different reasons but the main is so the right respondent’s answers will matter. What else are
these questions used? You can use these to survey the correct demographics, legal issues,
measure credentials (how they were used in this paper), and measure knowledge (Screening,
2013).
In this survey there were many different types of questions and they were important
placed. The different type of questions are, important for different reasons. First off there were
different types of scales: agree-disagree and semantic differential. The agree- disagree scale is a
likert scale. What information can we gather from a likert scale? Two major forms of data, are
discovered from these reports, first a summary using a median or a mode. The second is displays
the distribution of observations using a bar chart. Another advantage is that since these scales do
not use yes or no answers, so they allow for degrees of opinions (Mcleod, 2008).
Then a rating scale was used: semantic differential scale. This scale is used for measuring
the meaning of concepts, things and ideas. There is connotative and denotative aspects to the
scale. Connotation meaning what is the significance of the word, or the perceived image. For
denotation, what’s a name or concept a certain thing is referring too. The positive adjectives
would be on the left side and the negative adjectives would be on the right side. To make sure all
the responses won’t be biased do not put all the “good” adjectives on the left side. The
limitations require intelligent respondents (Scaling).
6
An importance rating scale asks survey respondents to rate topics from ‘very important to
least important’ using their opinions. These questions can also be asked in a ranking order or in
ranking scales. In ranking order respondents will rank the order of importance of certain topics.
For example, the question could be like ‘rank the following in order of importance from 1 to 4
where 1 is most important to you and 4 is least important to you.” These questions help identify
what the respondents hold value to. What’s really important to them and why that should be
important to our survey.
The other type of questions that were asked were demographic based these questions
were asked at the end. Usually these questions are asked for research purposes, to analyze
responses, who to survey, and collect meaningful data. These questions are designed to help
survey researcher’s determine what factors may influence a respondent’s interests, answers and
opinions. In this survey the demographic questions that were if the participants were
single/married, education and their income level (2014). These questions were asked at the end
because they weren’t really that sensitive to the cause. If the respondents ran into them in the
beginning they would answer them without any thought, might answer them untruthfully or they
might be uninterested and would terminate the survey.
Results
After results were collected from the 185 participants we ran the raw data through IBM’s
SPSS program to drive insights and look at the results that we collected. Looking at the data that
we found in SPSS was very interesting because it helped us organize and sort this information in
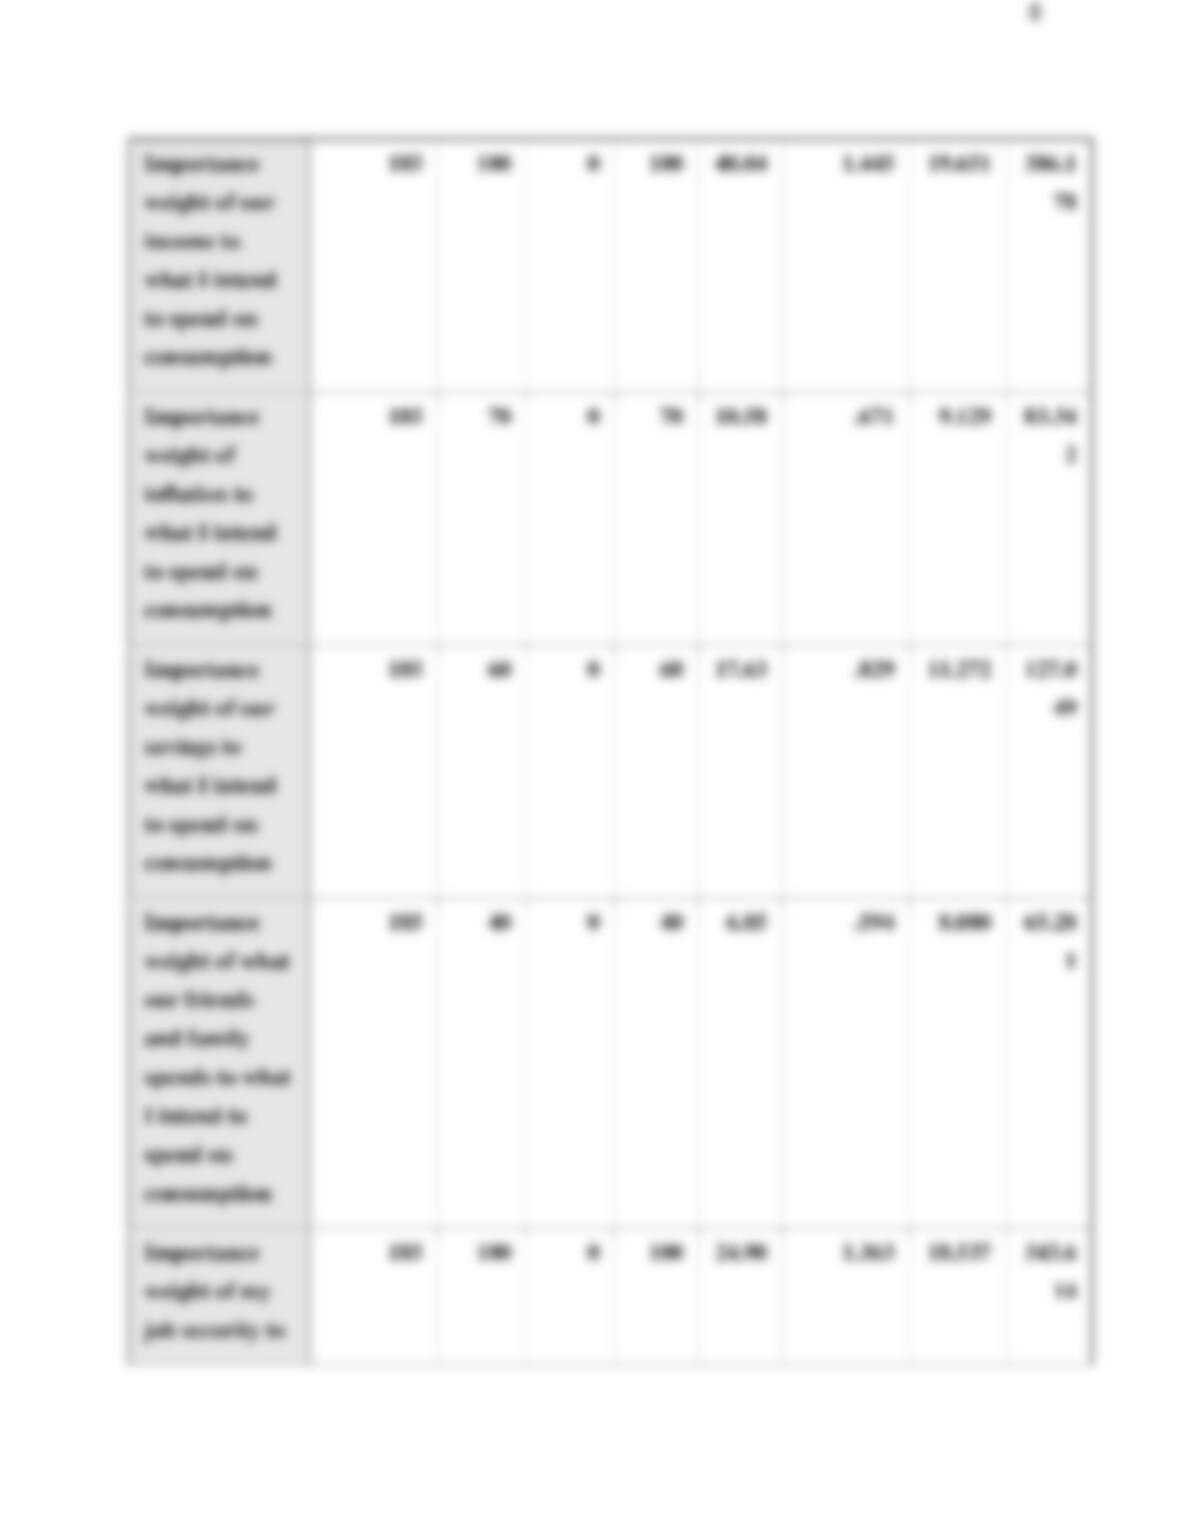
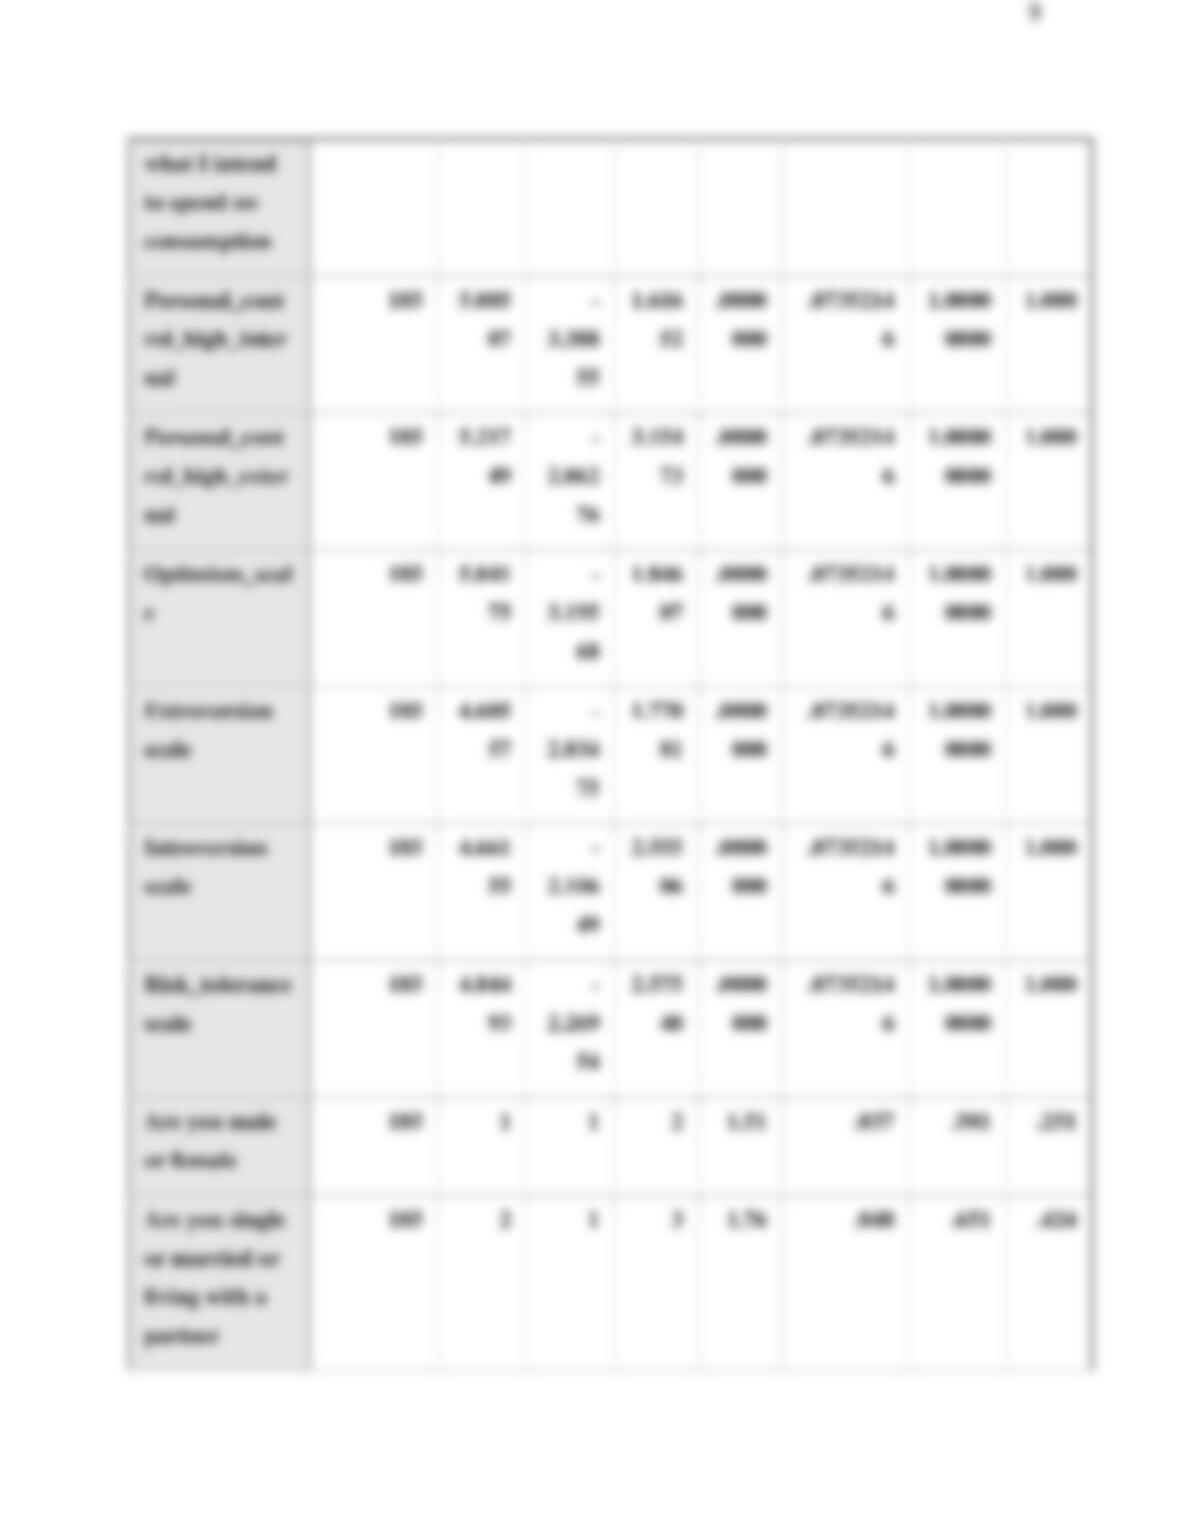
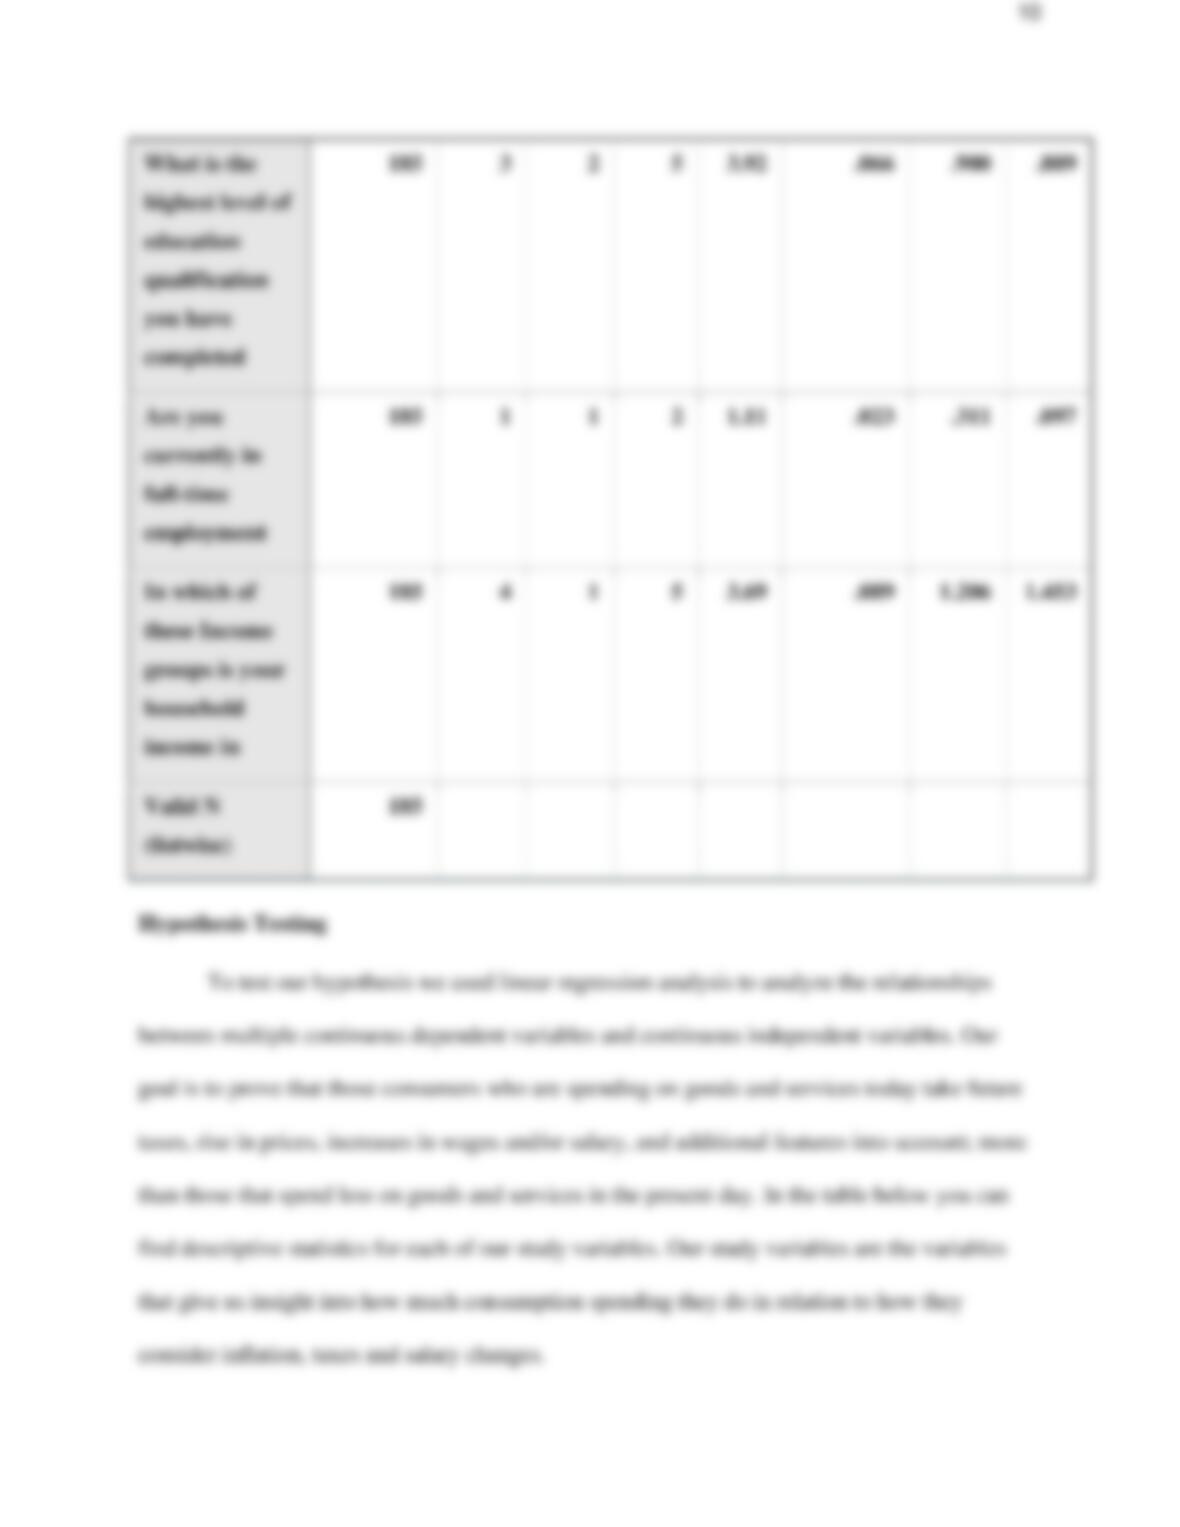
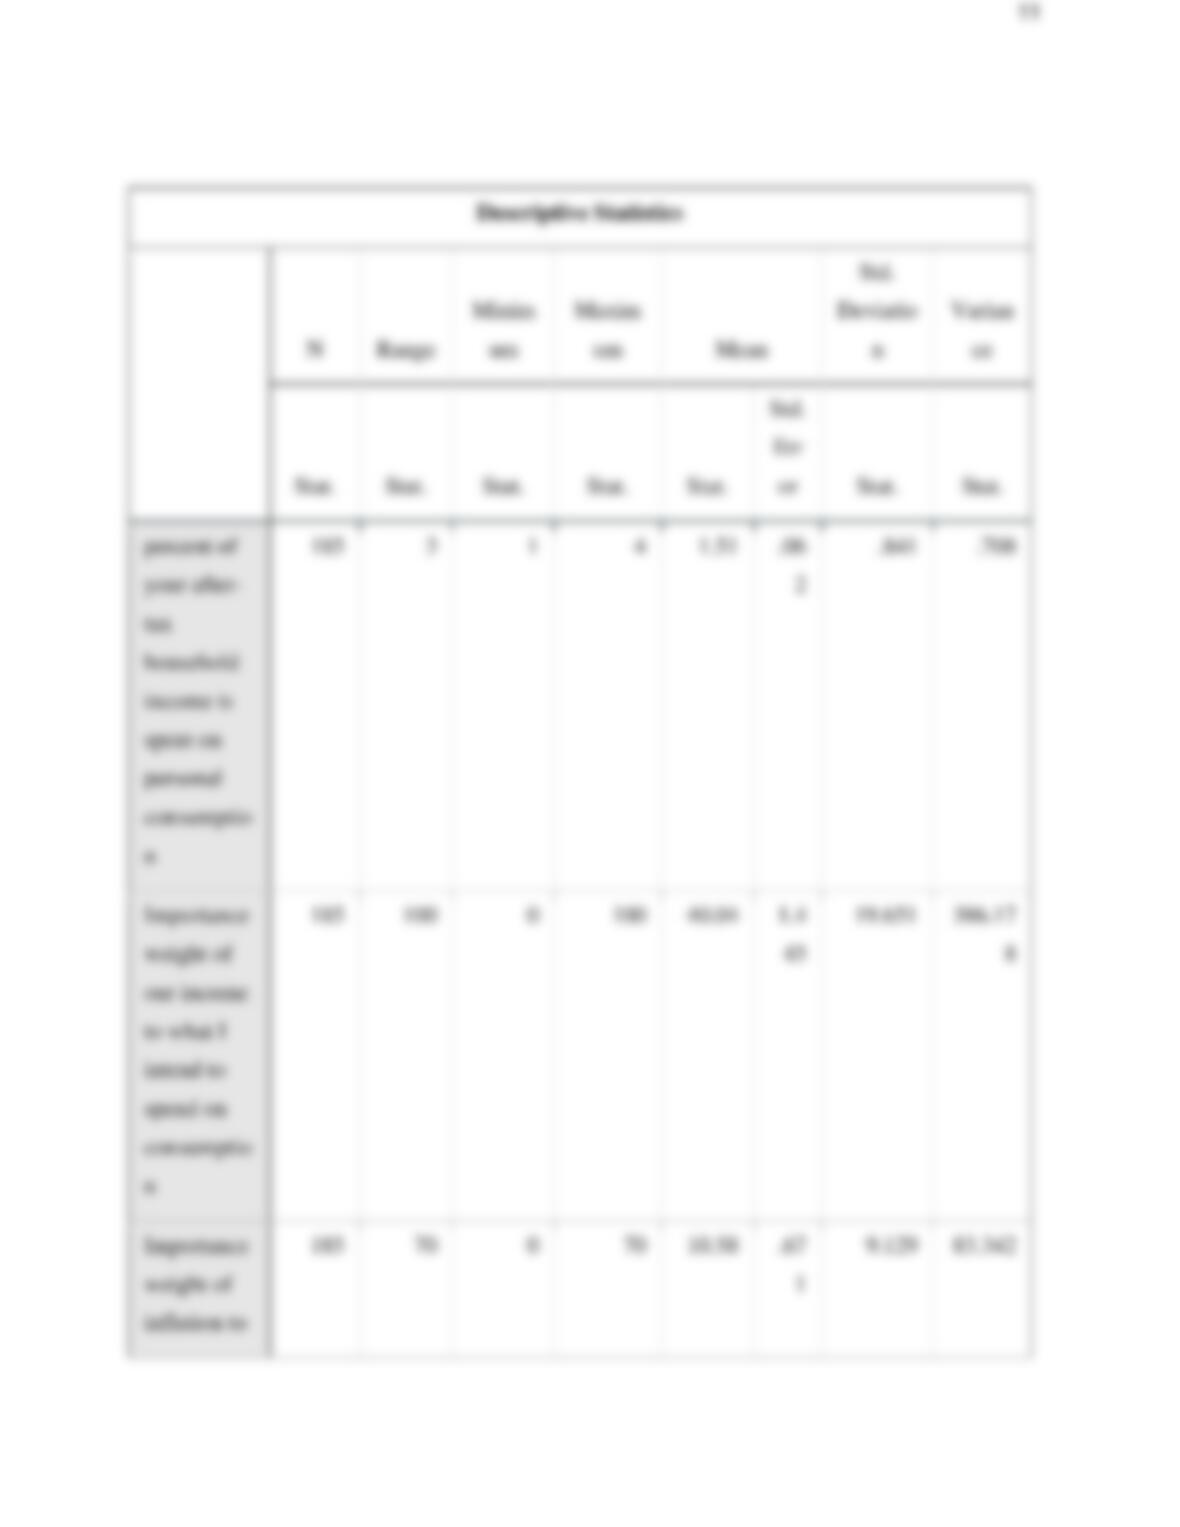
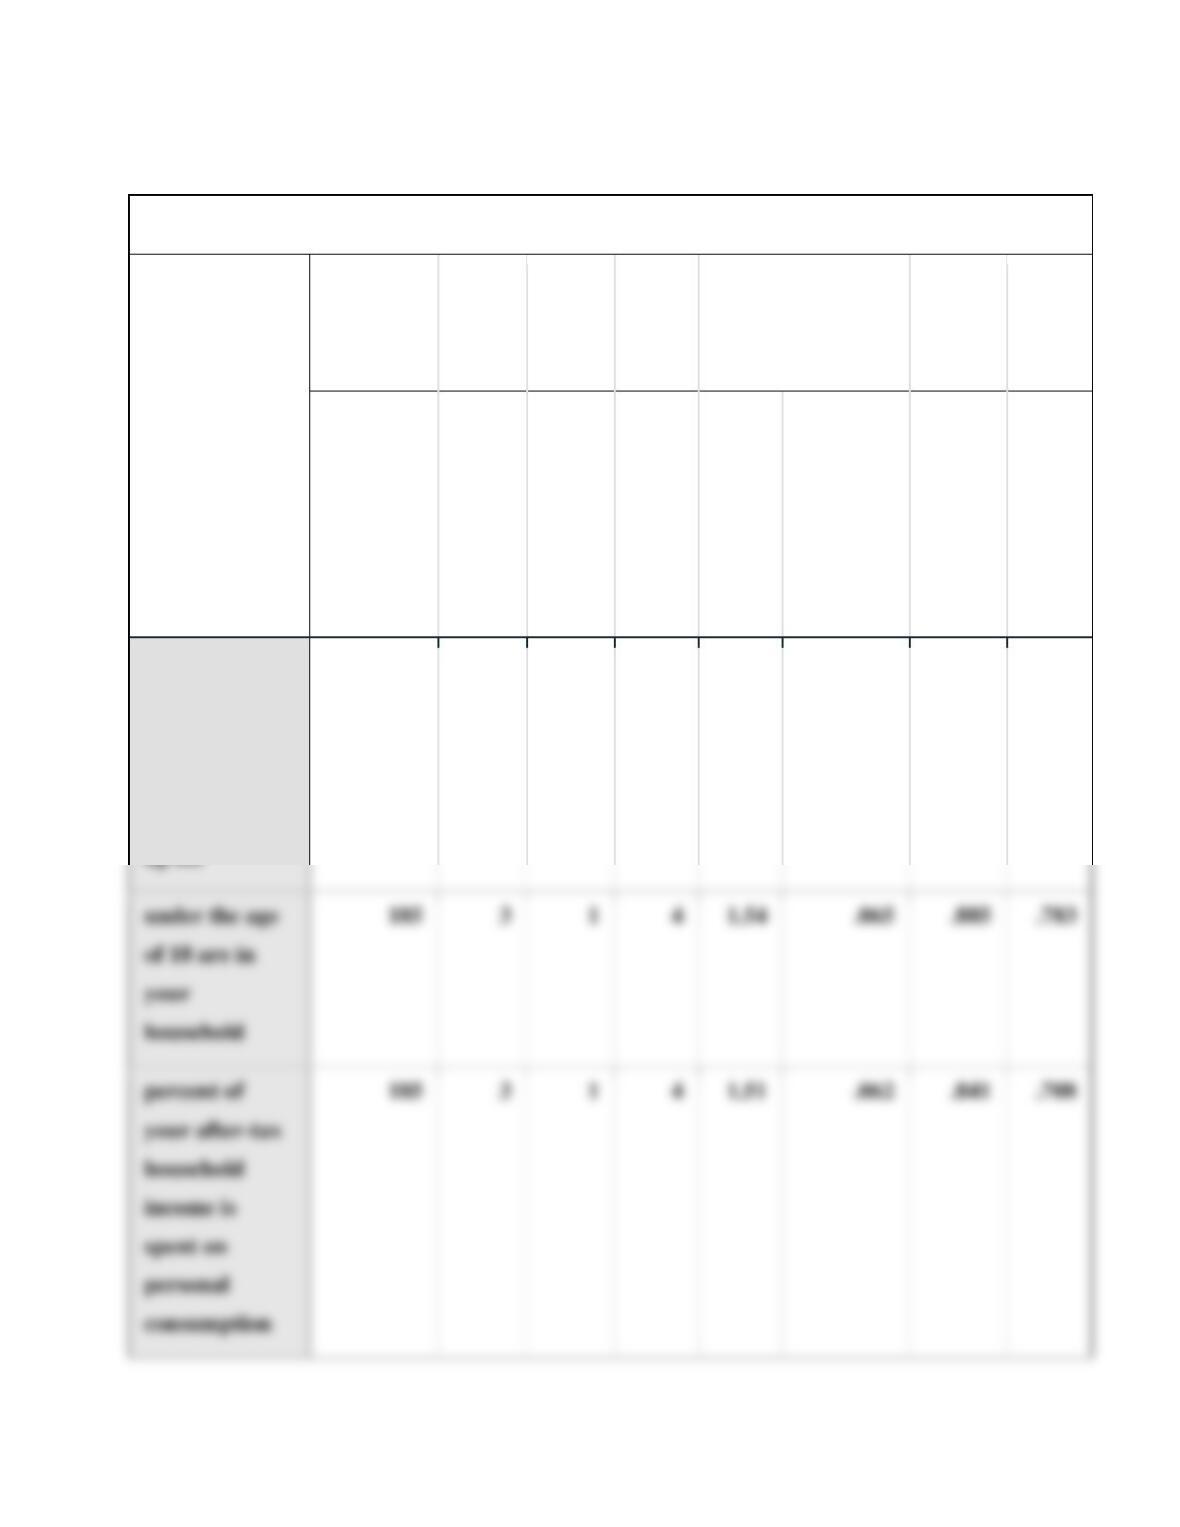
a manner that allows us to derive hidden insights. In the table below you can find the means,
standard deviations and confidence interval (.95) for the variables found in the questionnaire.
7
Descriptive Statistics
N
Rang
e
Min
Ma
Mean
Std.
Deviat
ion
Vari
ance
Statistic
Stat.
Stat.
Stat.
Stat.
Std.
Error
Stat.
Stat.
total number
of household
members a
common
budget is made
185
3
1
4
2.59
.082
1.115
1.242