Running hеad: CHEVRON AND EXXON 1
Chevron and Exxon
Studеnt Namе:
Institution affiliatеd
Profеssor’s Namе
Datе

CHEVRON AND EXXON 2
Chevron and Exxon
1.Compare and contrast the limitations and usefulness of the single-step income statement
and the multi-step income statement.
A single-step income statement presents a company’s net loss or profit is a single
mathematical equation. This is useful when presenting financial information to individual who
only needs to know the end result. Income and expenses are not separated by this statement. This
statement is short and hence less time consuming and easily understood. However its major
drawback is the lack of information especially when the financial condition of a company is
being assessed. Multiple-step income statement is detail statement that includes details of a
company different sources of expenses and income. The overall health of a company is assessed
using this statement. It is however time consuming to prepare and correct a mistake in this
statement.
2. Analyze the gross profit, operating profits, and net income of both Exxon and
Chevron for 2012 and 2013. Of the two (2) companies, speculate on the main reasons why one
(1) company may have been more profitable than the other company.
Exxon
Exxon Mobil Corp., Net Profit Margin
Dec 31,
2013
Dec 31,
2012
Dec 31,
2011
Selected Financial Data (USD $ in
millions)
Net income attributable to ExxonMobil 32,580 44,880 41,060
Sales and other operating revenue 420,836 453,123 467,029
Ratio
Net profit margin 7.74% 9.90% 8.79%
Benchmarks
Net Profit Margin, Competitors
BP PLC 6.19% 3.08% 6.84%
Chevron Corp. 9.73% 11.35% 11.01%
ConocoPhillips 16.83% 14.54% 5.08%

CHEVRON AND EXXON 3
Royal Dutch Shell PLC 3.63% 5.69% 6.58%
Net Profit Margin, Sector
Integrated Oil & Gas 6.75% 7.43% 7.60%
Net Profit Margin, Industry
Oil & Gas 6.92% 7.39% 7.54%
2013 Calculations
Net profit margin = 100 × Net income attributable to ExxonMobil ÷ Sales and other
operating revenue = 100 × 32,580 ÷ 420,836 = 7.74%
Exxon Mobil Corp., Operang Prot
Margin(hps://www.google.com/nance?
fstype=ii&q=NYSE:X)
Dec 31,
2013
Dec 31,
2012 Dec 31, 2011
Selected Financial Data (USD $ in millions)
Operating income 40,301 49,881 54,104
Sales and other operating revenue 420,836 453,123 467,029
Ratio
Operating profit margin 9.58% 11.01% 11.58%
Benchmarks
Operating Profit Margin, Competitors
BP PLC 3.87% 1.87% 7.69%
Chevron Corp. 12.36% 15.18% 15.67%
ConocoPhillips 20.52% 20.94% 7.17%
Royal Dutch Shell PLC 5.73% 7.84% 8.91%
Operating Profit Margin, Sector
Integrated Oil & Gas 7.82% 8.88% 10.03%
Operating Profit Margin, Industry
Oil & Gas 8.37% 9.20% 10.08%
Operating profit margin = 100 × Operating
income ÷ Sales and other operating revenue
= 100 × 40,301 ÷ 420,836 = 9.58%
CHEVRON AND EXXON 4
Exxon Mobil Corp., Gross Profit margin
Dec 31,
2013
Dec 31,
2012
Dec 31,
2011
Selected Financial Data (USD $ in millions)
Gross profit 105,566 117,044 126,724
Sales and other operating revenue 420,836 453,123 467,029
Gross profit margin 25.08% 25.83% 27.13%
2013 Calculations
Gross profit margin = 100 × Gross profit ÷ Sales and other operating revenue = 100 × 105,566 ÷
420,836 = 25.08%
Chevron
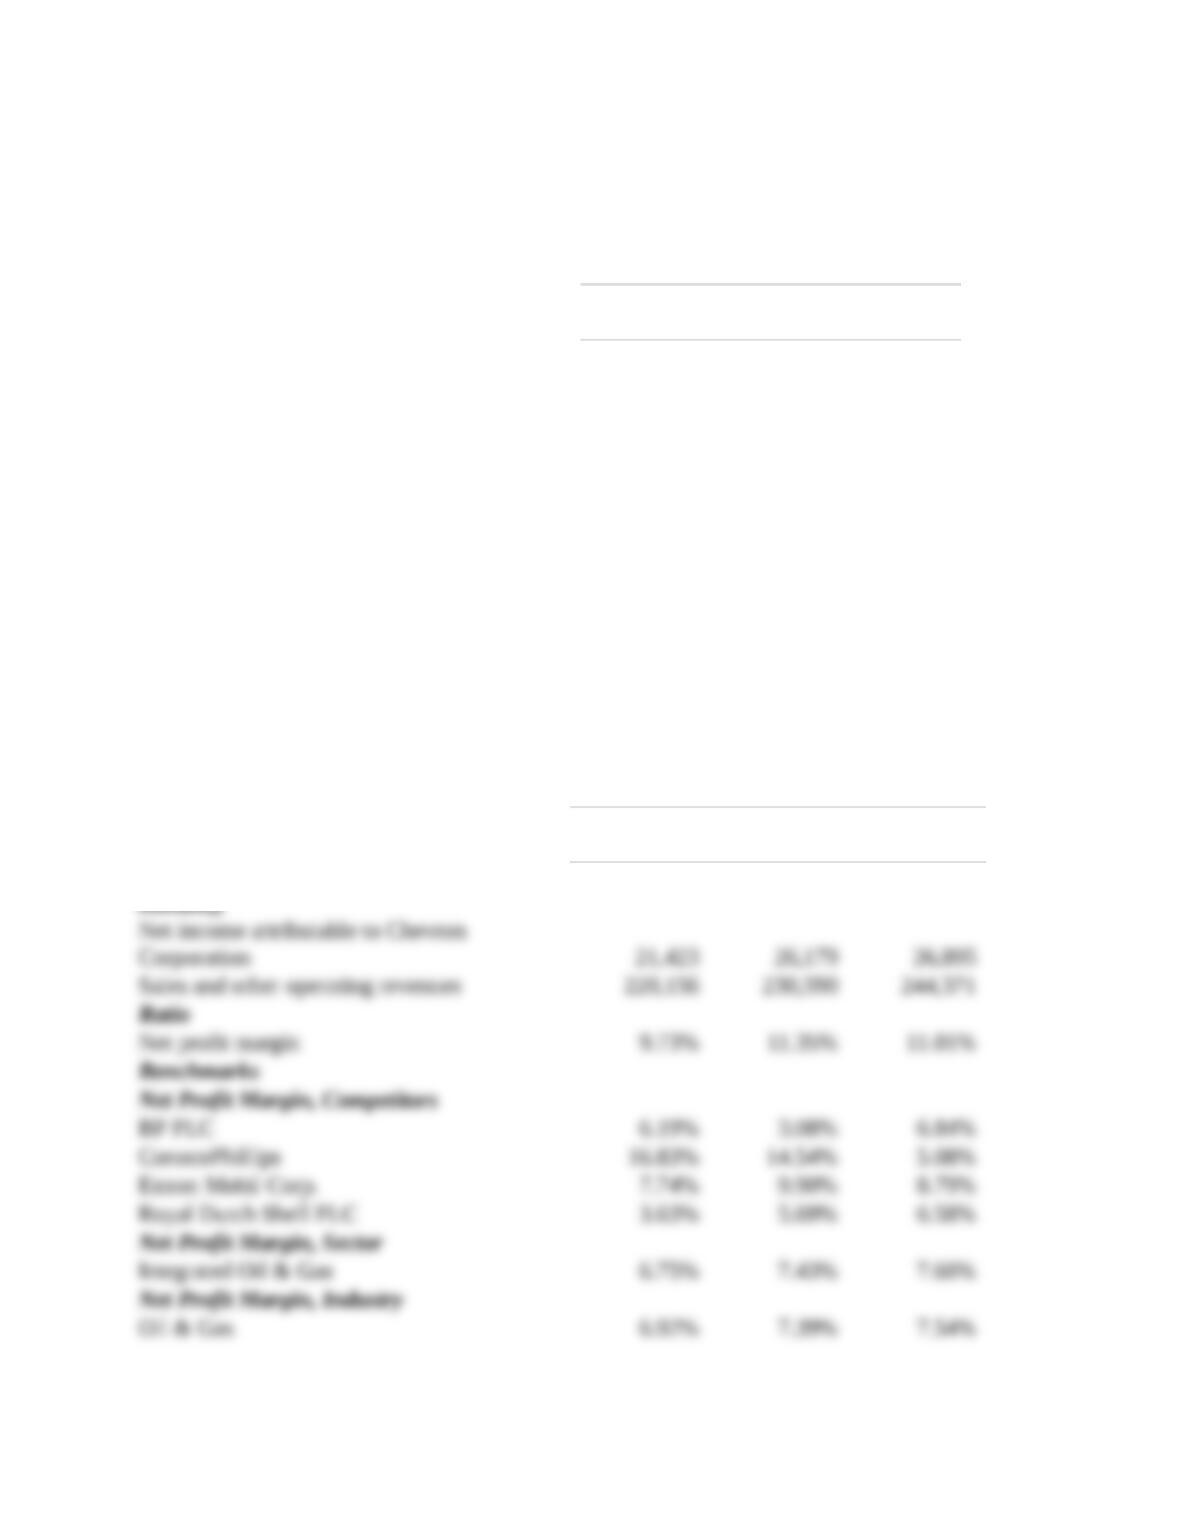
Chevron Corp., Net Profit Margin
Dec 31,
2013
Dec 31,
2012
Dec 31,
2011
Selected Financial Data (USD $ in