QBM 101 Business Statistics
Department of Business Studies Faculty
of Business, Economics & Accounting
HELP University
SUBJECT OUTLINE:
and graphing data;
➢Module 1: Introduction; organizing
numerical
descriptive measures
➢Module 2: Probability, discrete random
variables; continuous random variables and
the normal distribution
➢Module 3: Sampling distributions;
estimation; hypothesis testing
➢Module 4: Simple linear regression
CHAPTER 7: SAMPLING (chọn mẫu) DISTRIBUTIONS
➢7.1 Sampling distribution (phân phối mẫu),
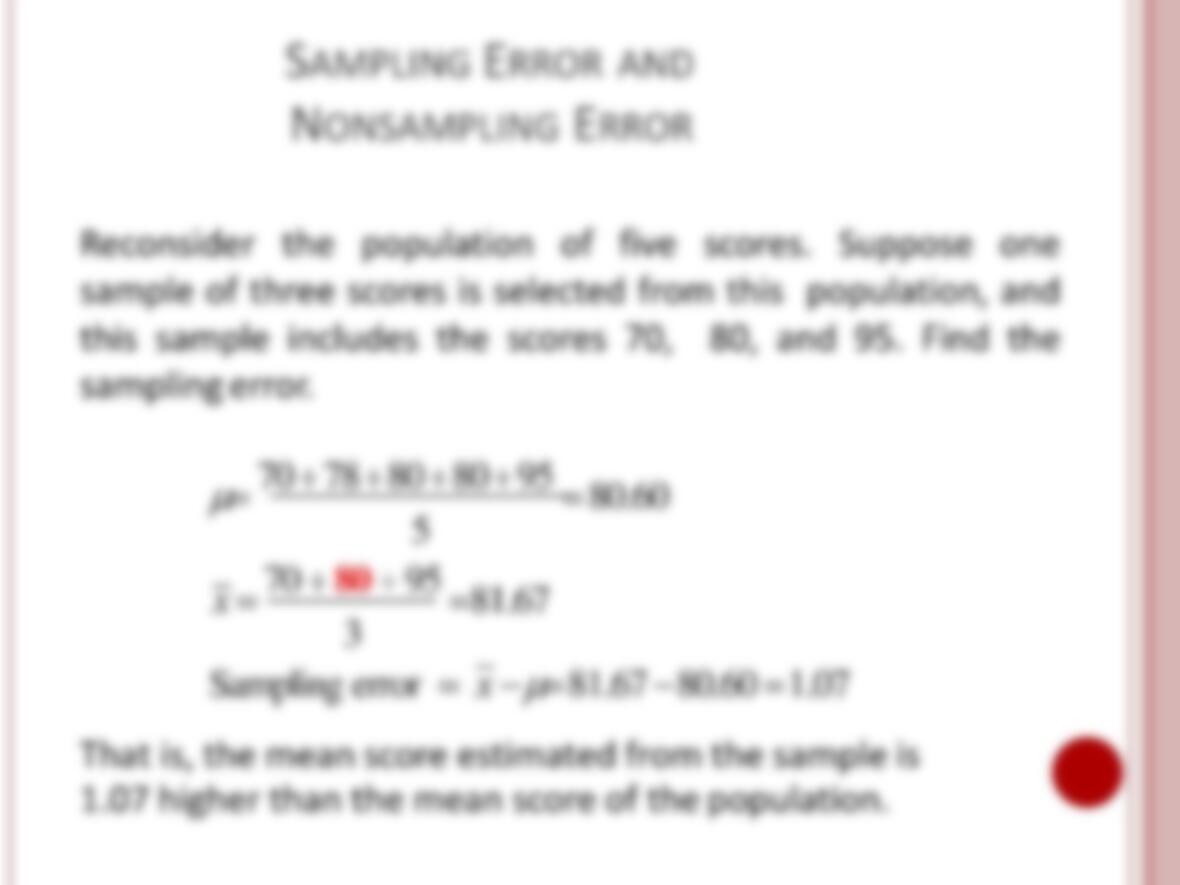
sampling error, and non sampling error
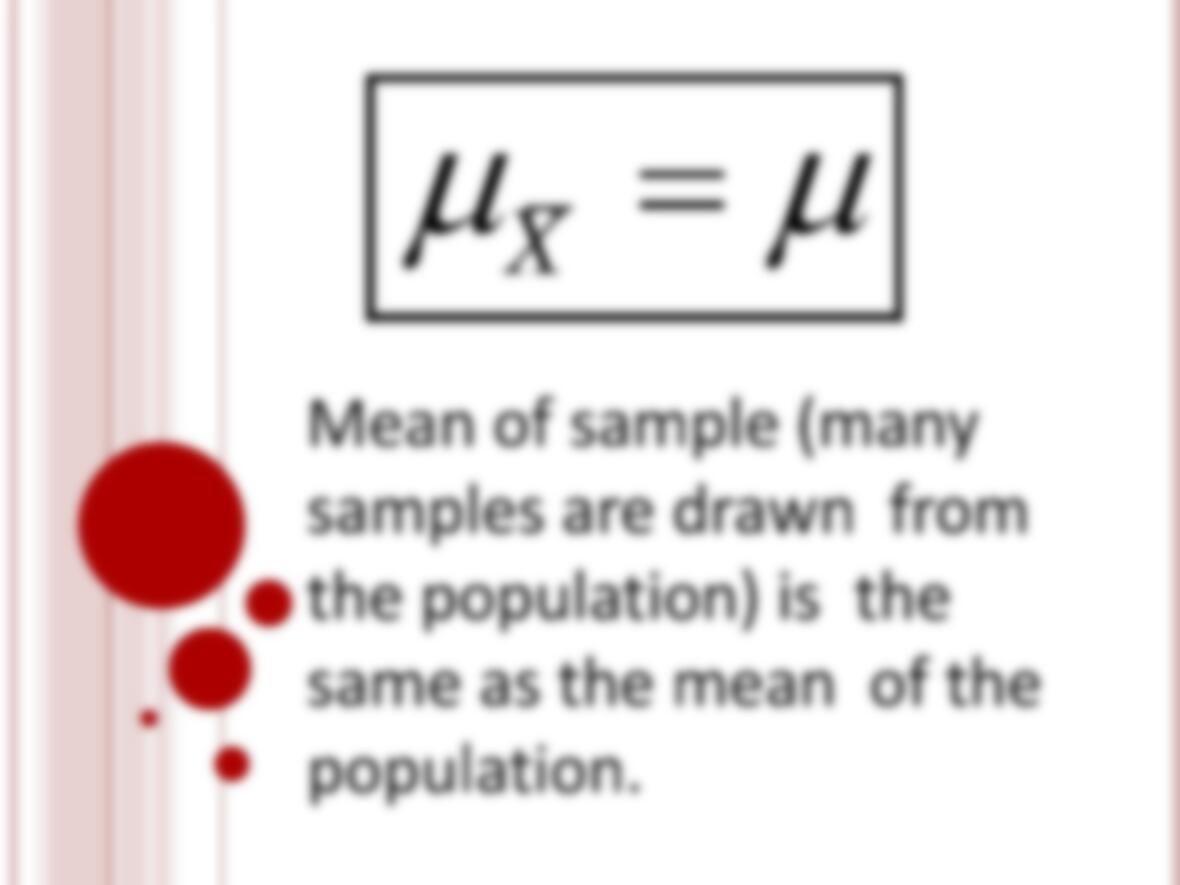
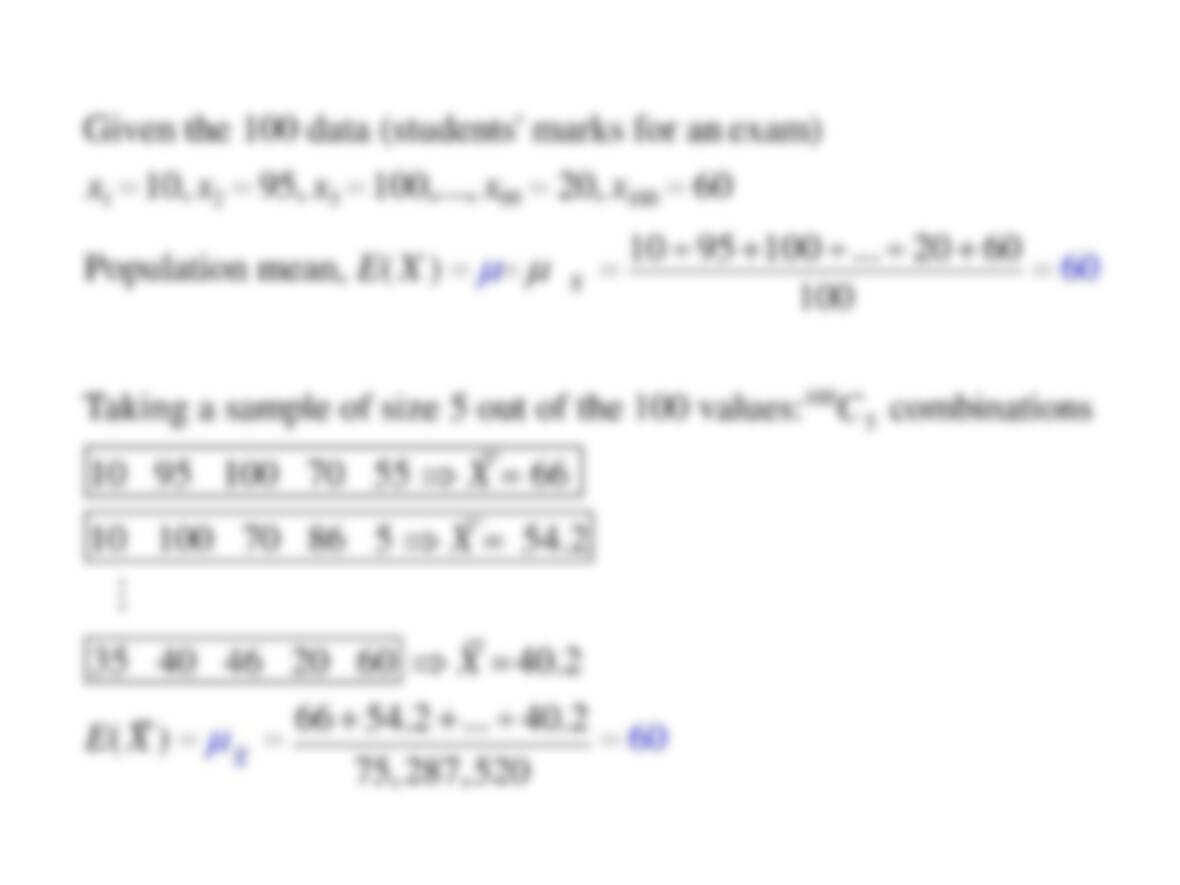
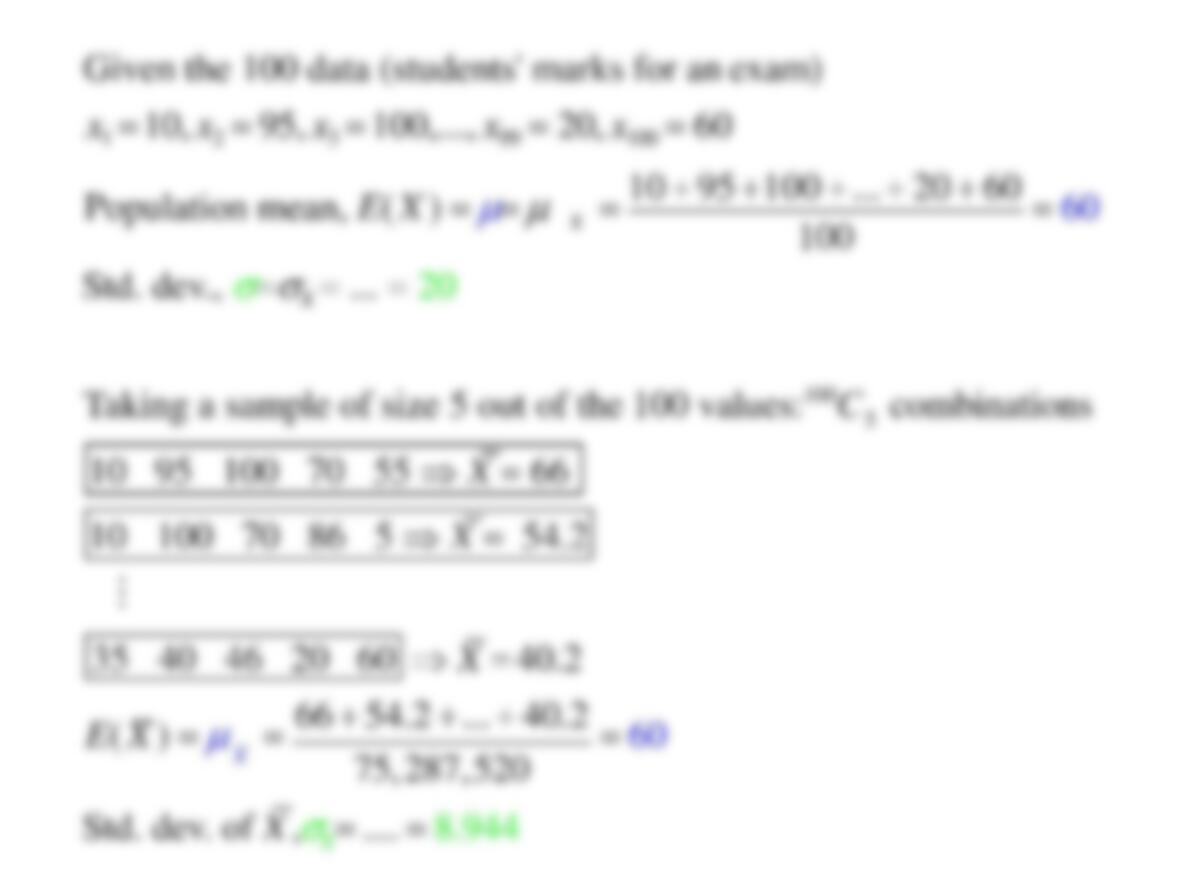
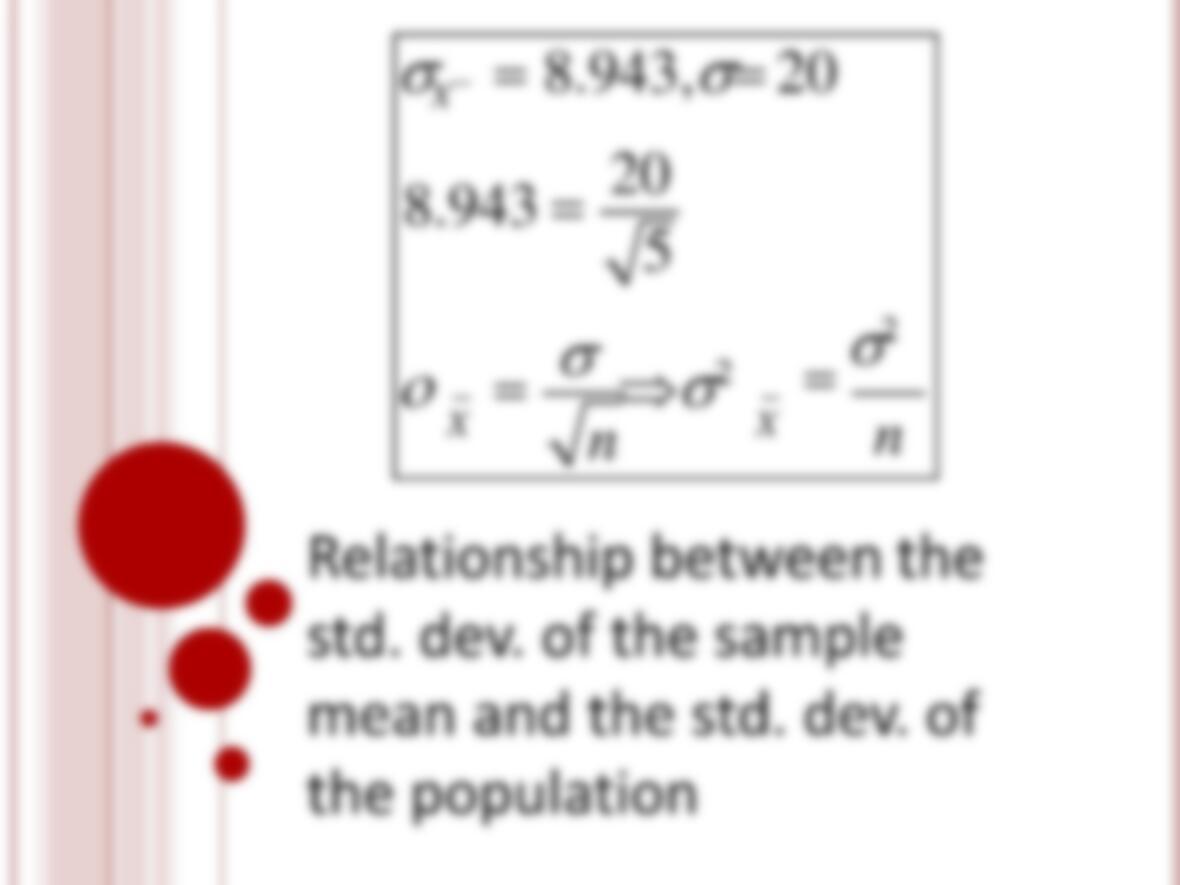
➢7.2 Mean and standard deviation of sample
mean
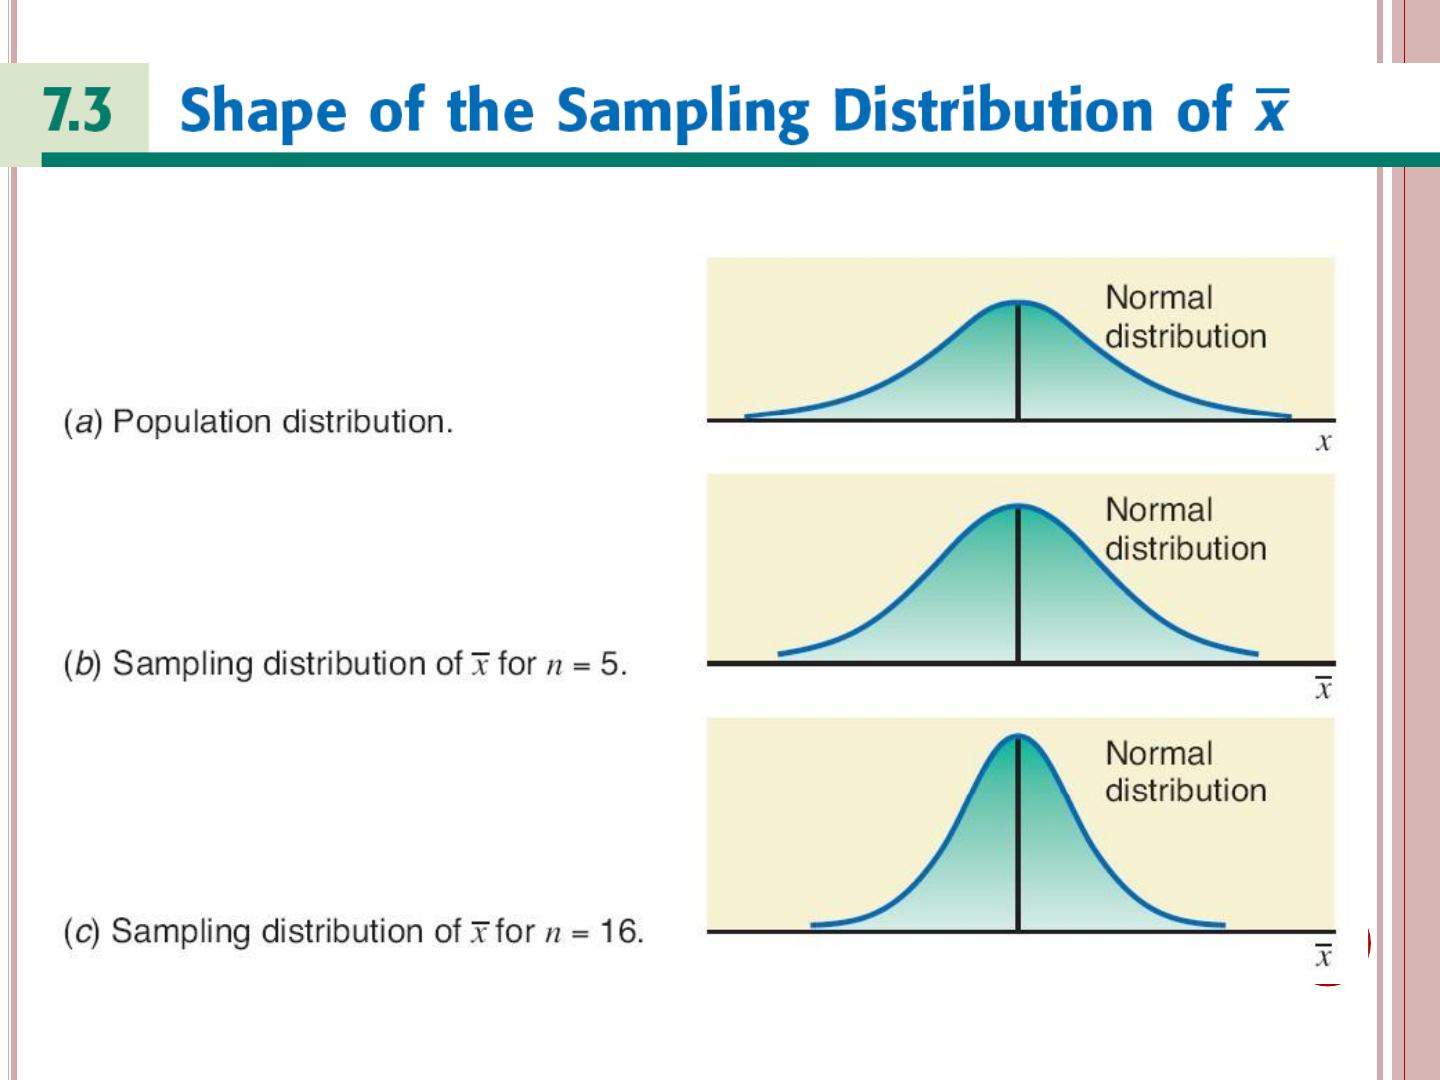
➢7.3 Shape of the sampling distribution of sample
mean
➢7.4 Applications of the sampling distribution of
sample mean
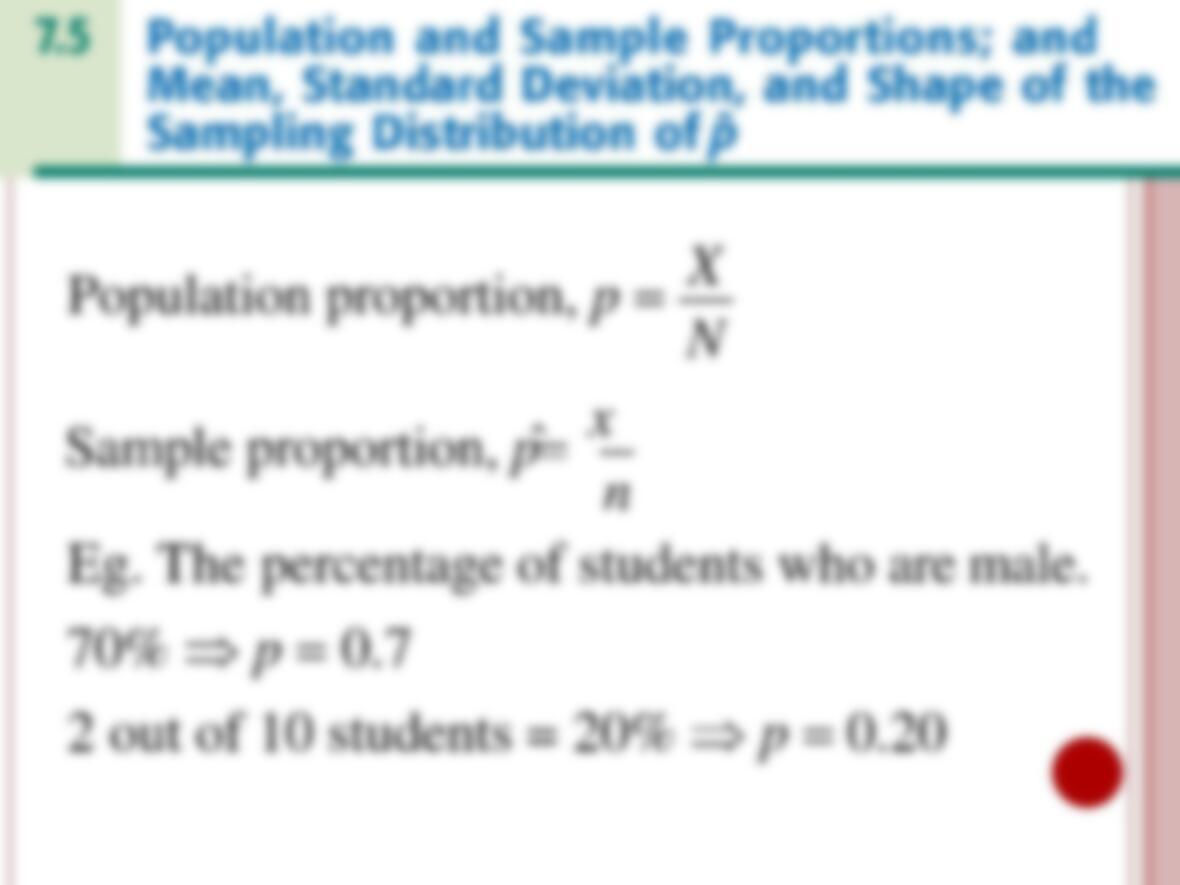
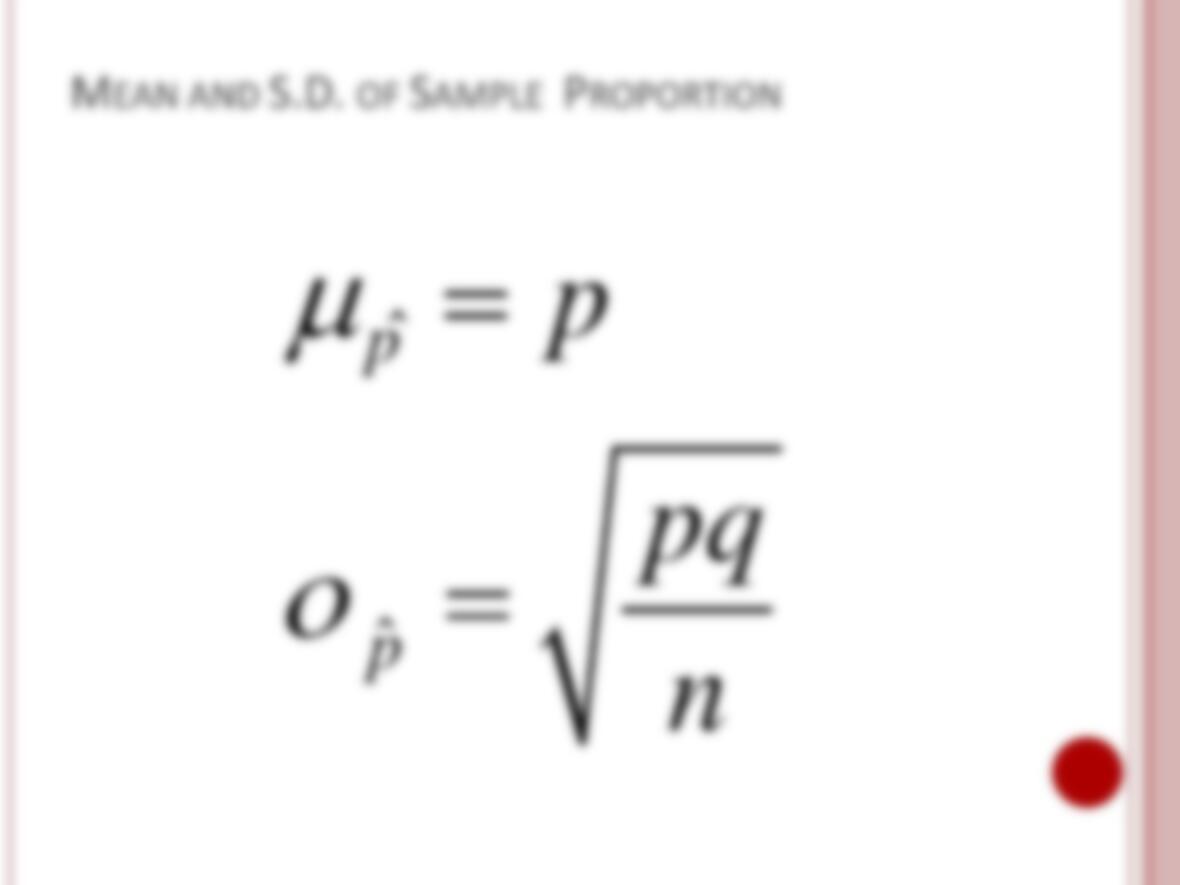
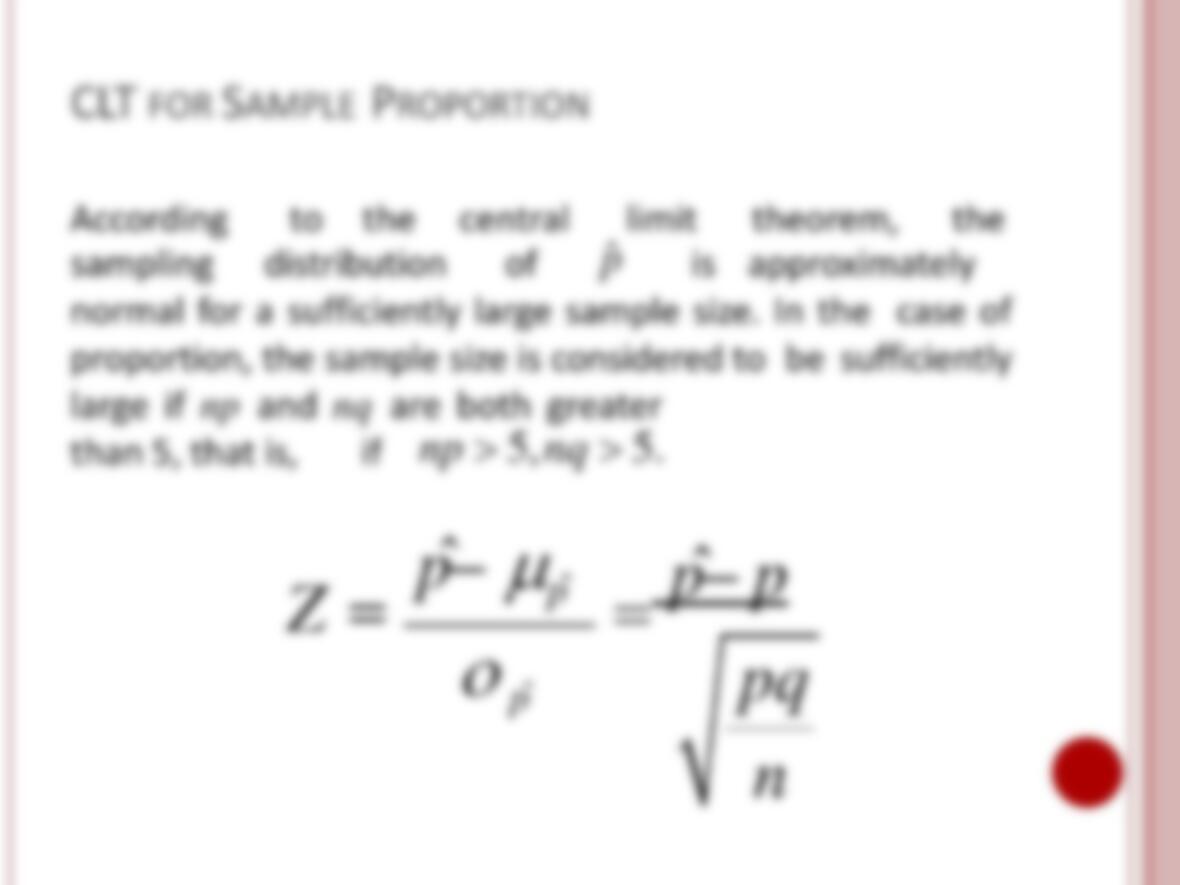
➢7.5 Population and sample proportions: and mean,
standard deviation, and shape of the sampling
distribution of sample proportion
➢7.6 Applications of the sampling distribution of
sample proportion (tỉ lệ)
Population versus sampling distribution
Suppose there are only five students in an
advanced statistics class and the midterm
scores of these five students are
70 78 80 80 95
Let Xdenote the score of a student.
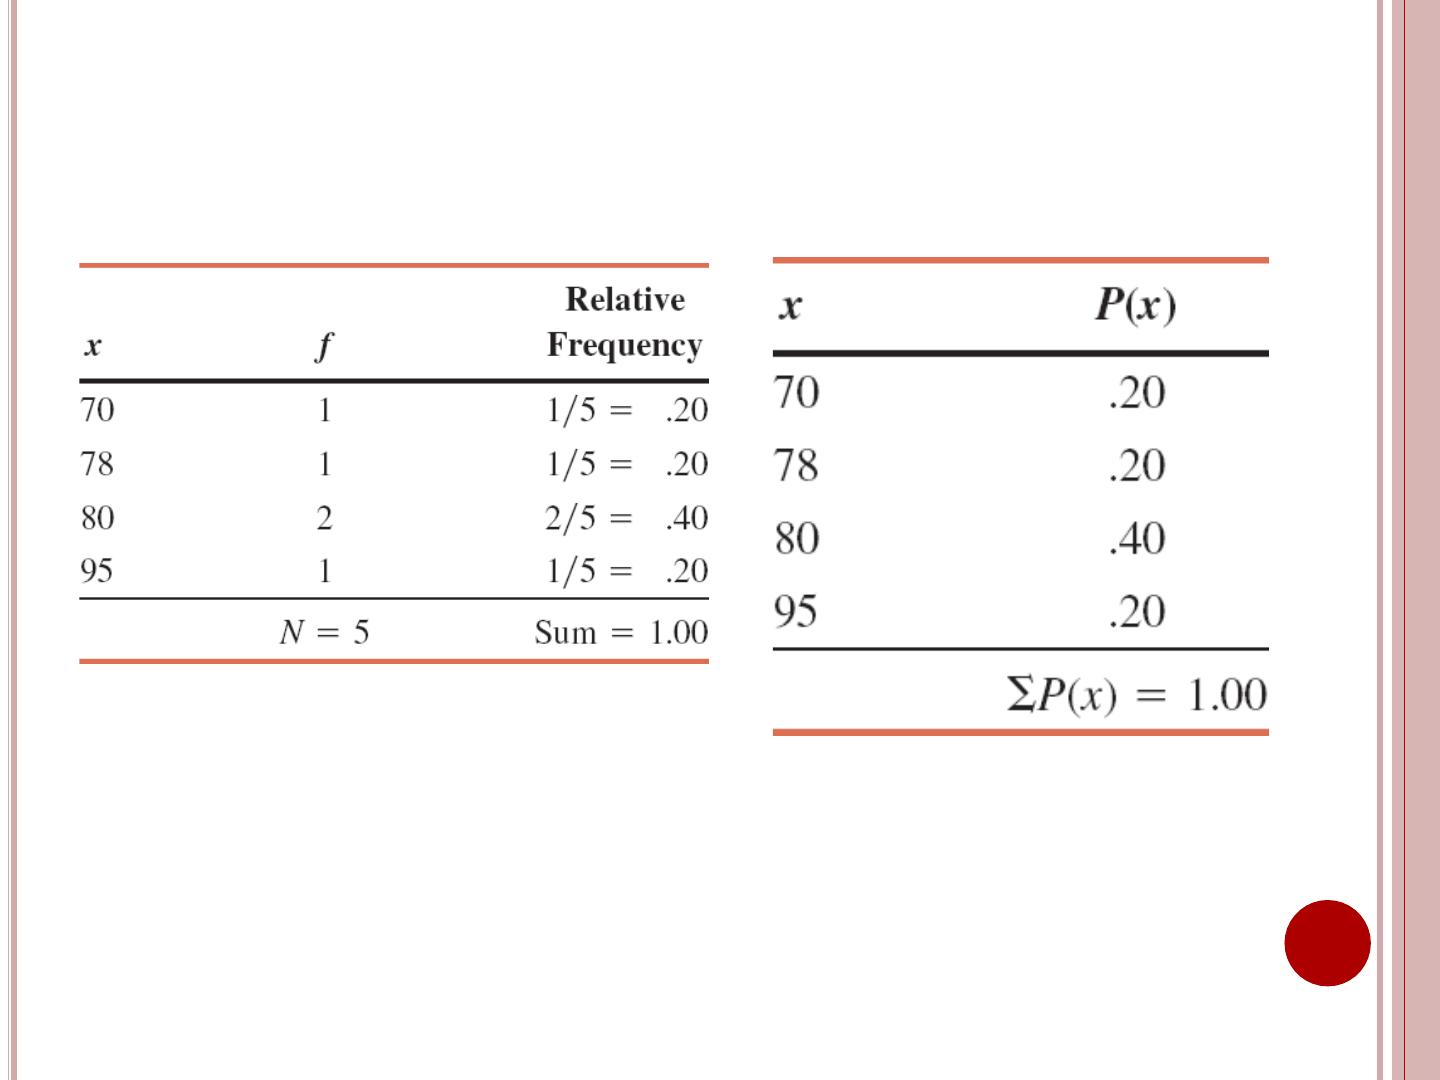
POPULATION DISTRIBUTION
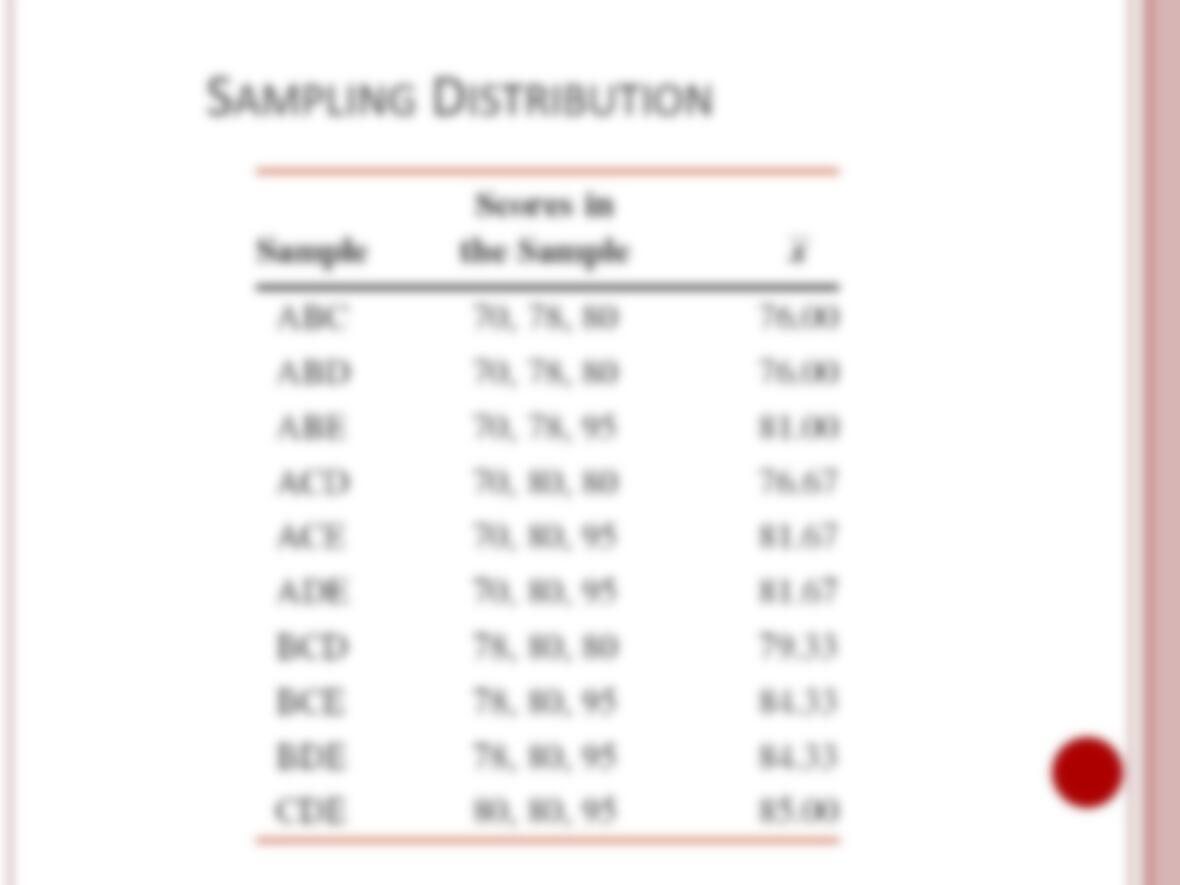
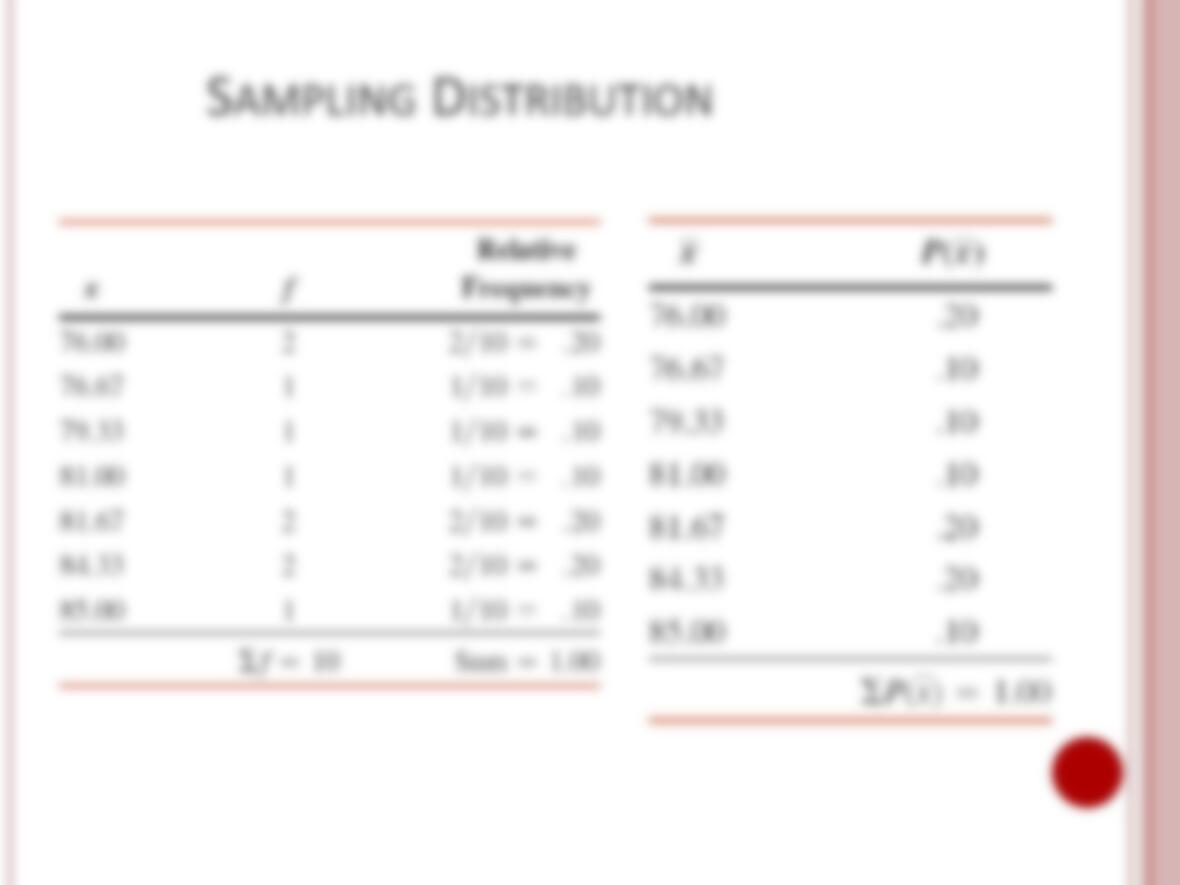
SAMPLING DISTRIBUTION
Reconsider the population of midterm scores of five
students.
Consider all possible samples of three scores each that
can be selected, without replacement, from that
population.
The total number of possible samples is
5! =54321=10
3!(5−3)! 32121
5 3
C=
SAMPLING DISTRIBUTION
Suppose we assign the letters A, B, C, D, and E to the scores of the
five students so that