Plotting
Introduction to Computing
plot (x,y)
➢is used to plot a function y=f(x),
➢plots the x values on the horizontal axis and the y values on
the vertical axis.
xlabel (‘text’) and ylabel (‘text’): put labels on horizontal and
vertical axis.
title (‘text’): puts a title at the top of the plot.
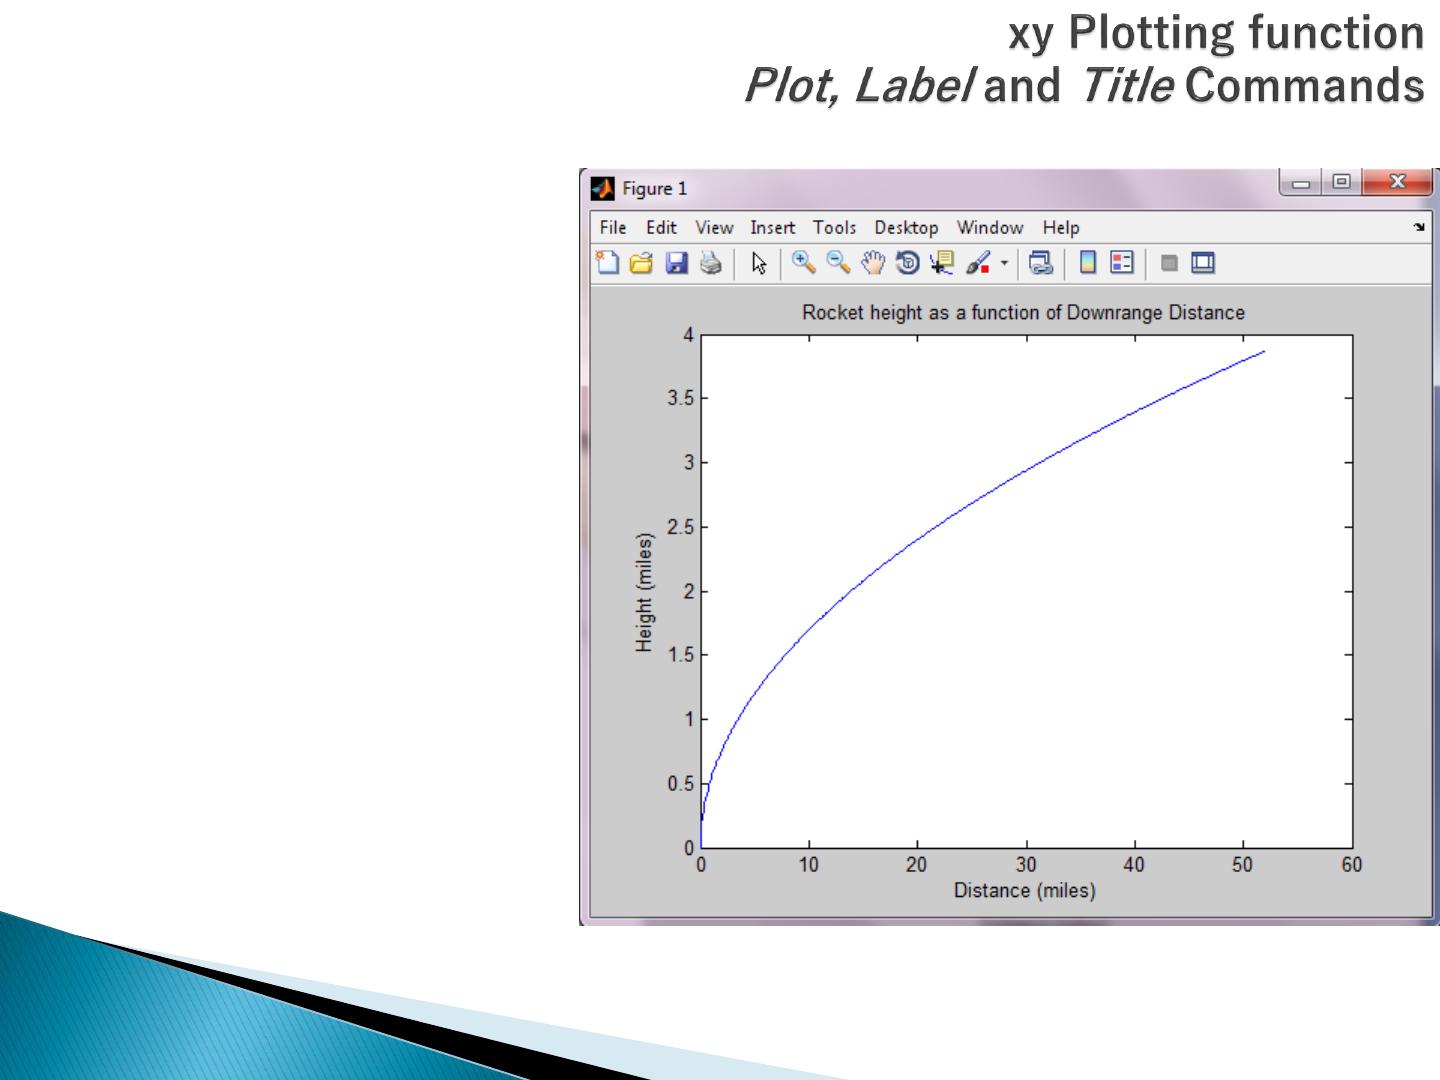
>> x=[0:0.1:52];
>> y=0.4*sqrt(1.8*x);
>> plot(x,y)
>> xlabel(‘Distance (miles)’)
>> ylabel(‘Height (miles)’)
>> title(‘Rocket height as a
function of Downrange Distance’)
Practice: Draw y=sin(x) , z=2cos(x) and t=y+z with 0x1800
grid: displays gridlines at the tick marks corresponding to the
tick labels.
grid on: add gridlines
grid off: stop plotting gridlines
axis: override the Matlab selections for the axis limits.
axis ([xmin xmax ymin ymax]): sets the scaling for the x- and
y- axes to the minimum and maximum values indicated, not use
commas to separate the values.
Practice:
Given y=sin (x) , z=2cos(x) and t=y+z . Draw t using grid, axis.
(the limit on x and y are optional.)
The axis command has the following variants:
➢axis square: selects the axes’ limits so that the plot will be
square.
➢axis equal: selects the scale factors and tick spacing to be
the same on each axis. This makes plot(sin(x),cos(x)) look like
a circle, instead of an oval.
➢axis auto: returns the axis scaling to its default autoscaling
mode in which the best axes limits are computed automatically.
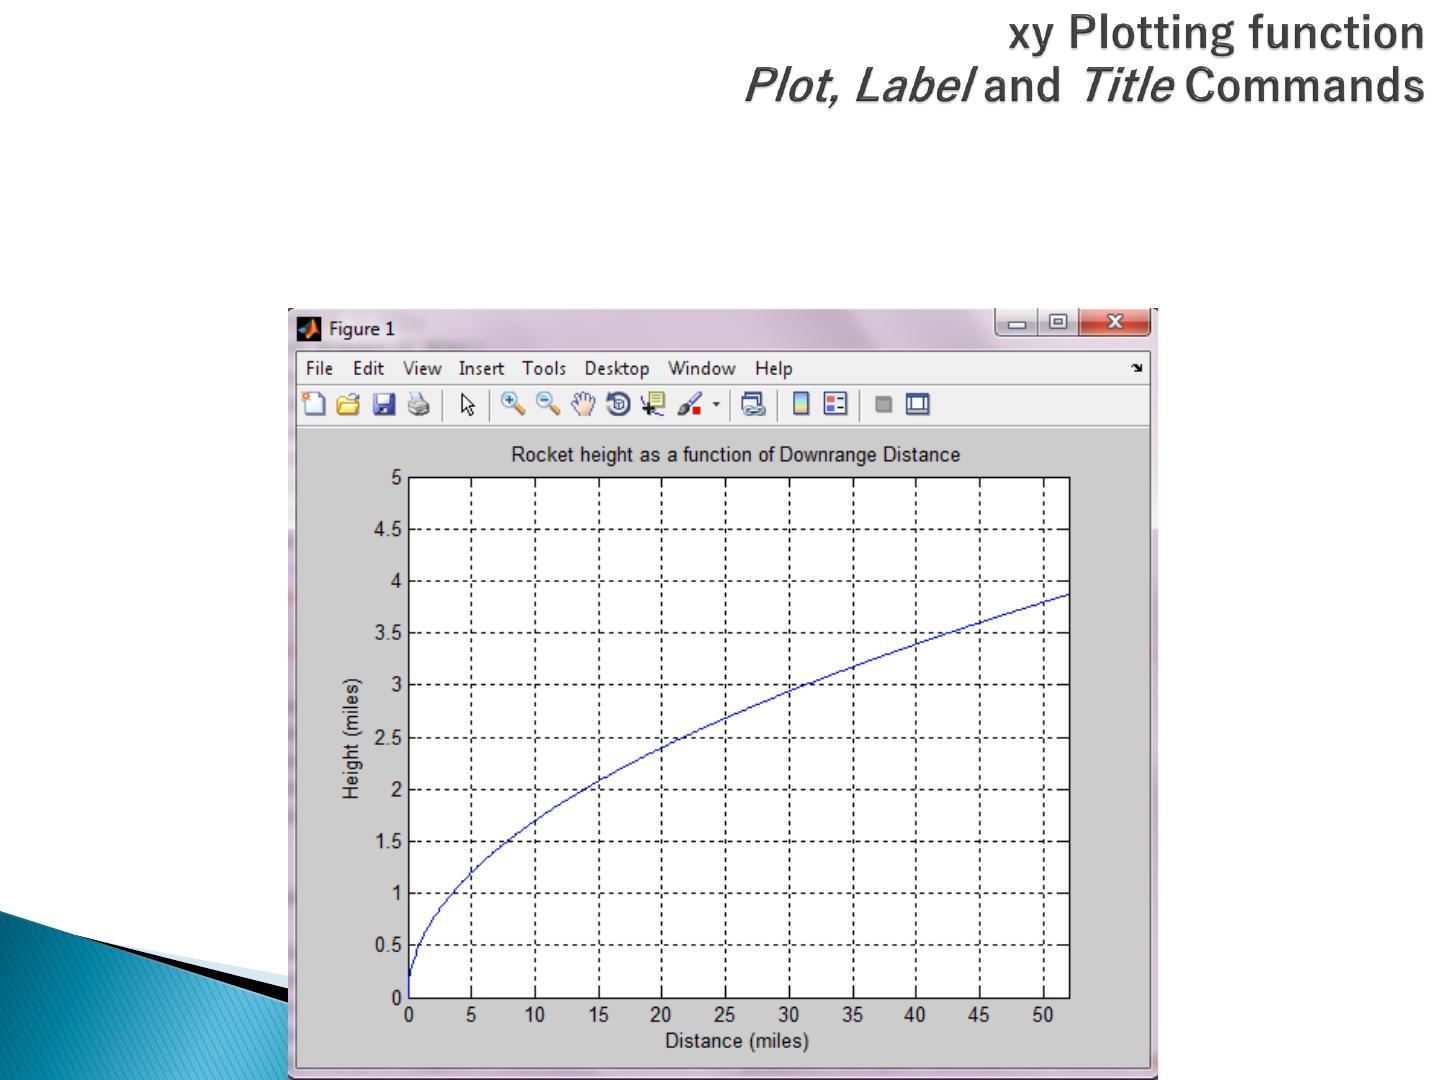
>> x=[0:0.1:52];
>> y=0.4*sqrt(1.8*x);
>> plot(x,y), xlabel(‘Distance (miles)’), ylabel(‘Height (miles)’), title(‘Rocket height as
a function of Downrange Distance’), grid on, axis ([0 52 0 5])
fplot(‘string’, [xmin xmax])
‘string’: a text string, describes the function to be plotted
[xmin xmax]: specifies the minimum and maximum values of
the independent variable.
box