Chapter 3 Systems Documentation Techniques
大纲:
1. Data flow diagram (DFD), a graphical description of data sources, data flows,
transformation processes, data storage, and data destinations
2. Flowchart, which is a graphical description of a system. There are several types of flow
charts, including:
o a. Document flowchart, which shows the flow of documents and information between
departments or areas of responsibility
o b. System flowchart, which shows the relationship among the input, processing, and
output in an information system
o c. Program flowchart, which shows the sequence of logical operations a computer
performs as it executes a program.
3. Business Process diagrams, which is a graphical description of the business processes
used by a company
Why document systems?
• Accountants must be able to read documentation and understand how a system works
(e.g. auditors need to assess risk)
• Sarbanes-Oxley Act (SOX) requires management to assess internal controls and
auditors to evaluate the assessment
• Used for systems development and changes
Data Flow Diagrams (DFD)
data flow diagram (DFD) – A graphical description of the flow of data within an organization,
including data sources/destinations, data flows, transformation processes, and data storage.
Focuses on the data flows for:
• Processes
o process – The action that transforms data into other data or information.
• Sources and destinations of the data
o data source – The entity that produces or sends the data that is entered into a
system.
o data destination – The entity that receives data produced by a system.
• Data stores
o data store – The place or medium where system data is stored.
DFD are virtually simple, can be used to represent the same process at a high abstract or
detailed level.
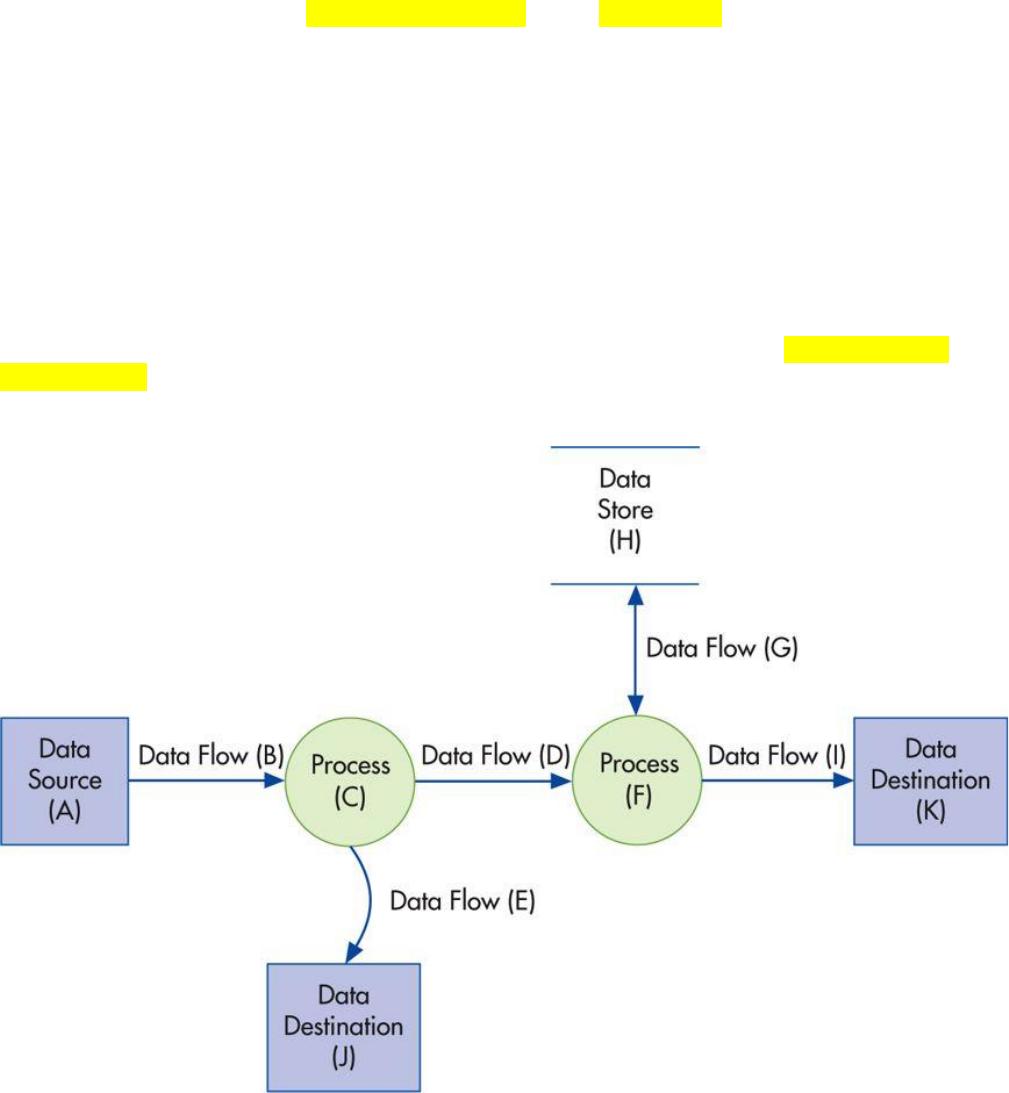
Basic Data Flow Diagram Elements
Basic guidelines for creating a DFD
• Understand the system that you are trying to represent
• A DFD is a simple representation meaning that you need to consider what is relevant and
what needs to be included.

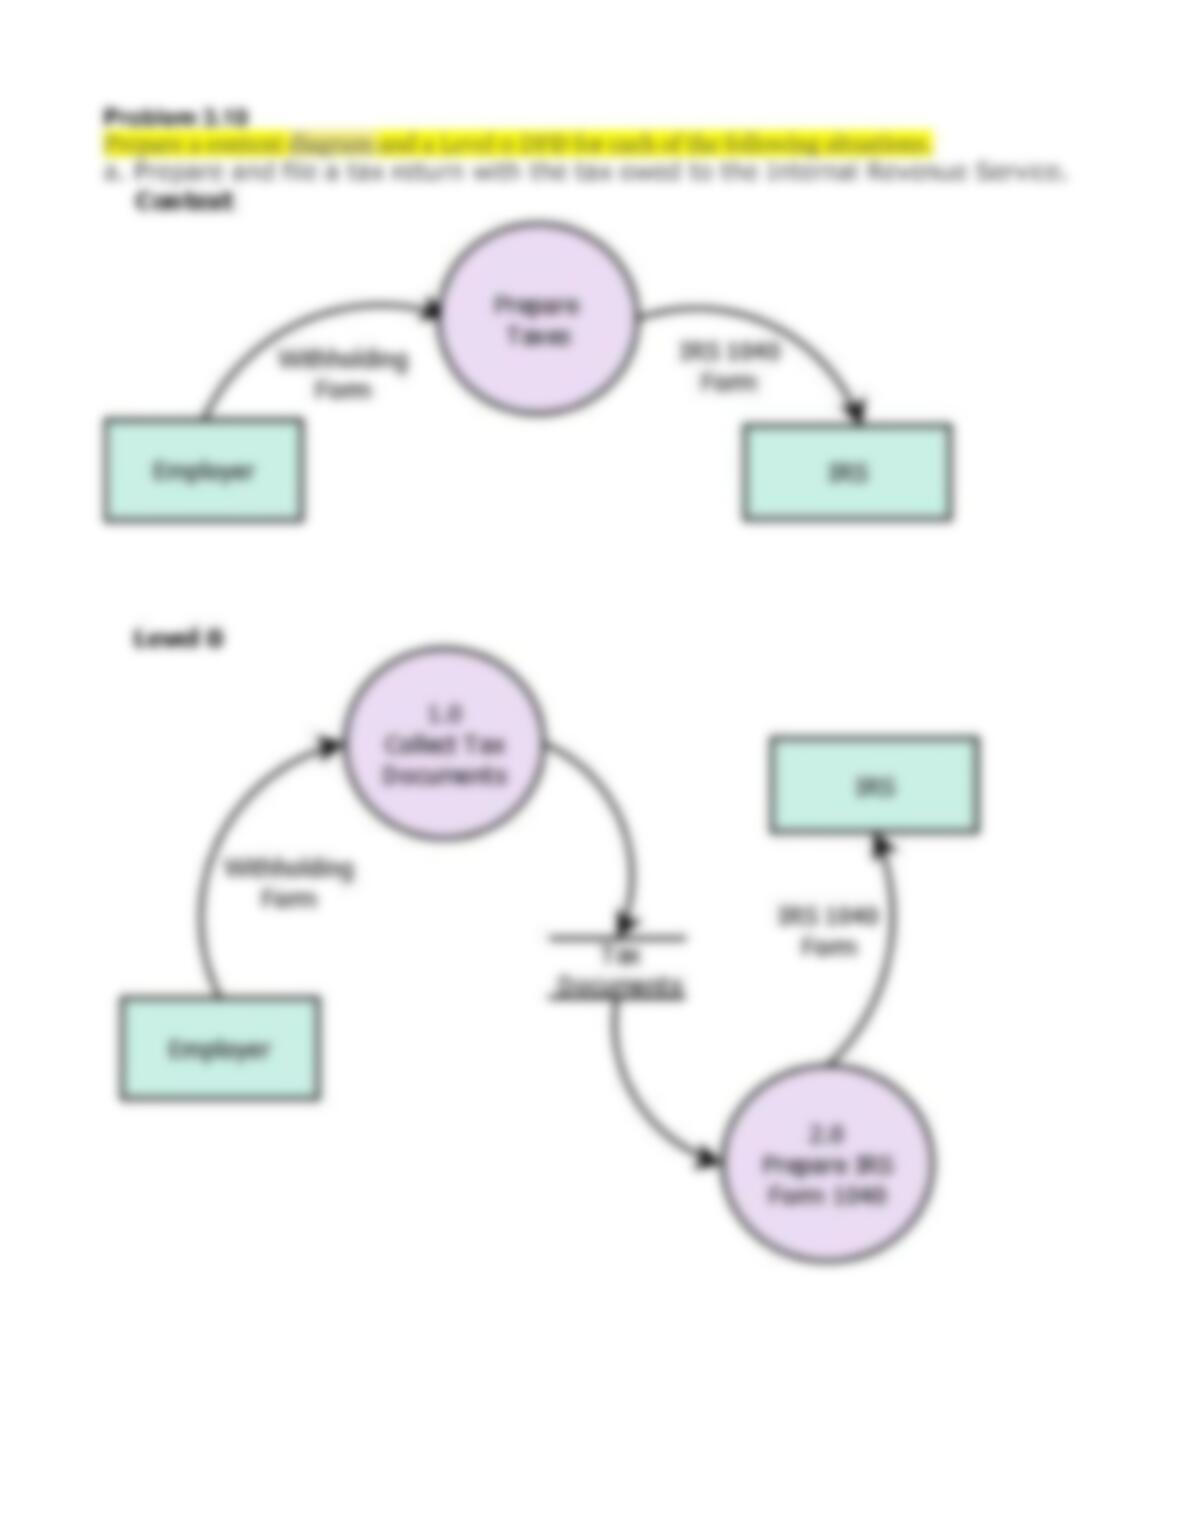
• Start with a high level (context diagram) to show how data flows between outside entities
and inside the system. Use additional DFD’s at the detailed level to show how data flows
within the system.
context diagram – Highest-level DFD; a summary-level view of a system, showing the
data processing system, its input(s) and output(s), and their sources and destinations.
• Identify and group all the basic elements of the DFD
• Name data elements with descriptive names, use action verbs for processes (e.g. update,
edit, prepare, validate)
• Give each process a sequential number to help the reader navigate from the abstract to the
detailed levels
• Edit/review/refine your DFD to make it easy to read and understand
Flowcharts
flowchart – An analytical technique that uses a standard set of symbols to describe pictorially
some aspect of an IS in a clear, concise, and logical manner.
Describe an information system showing:
• Inputs and outputs
• Information activities (processing data)
• Data storage
• Data flows – The movement of data among processes, stores, sources, and destinations.
• Decision steps
Key strengths of flowcharts are that they can easily capture control via decision points, show
manual vs. automated processes.
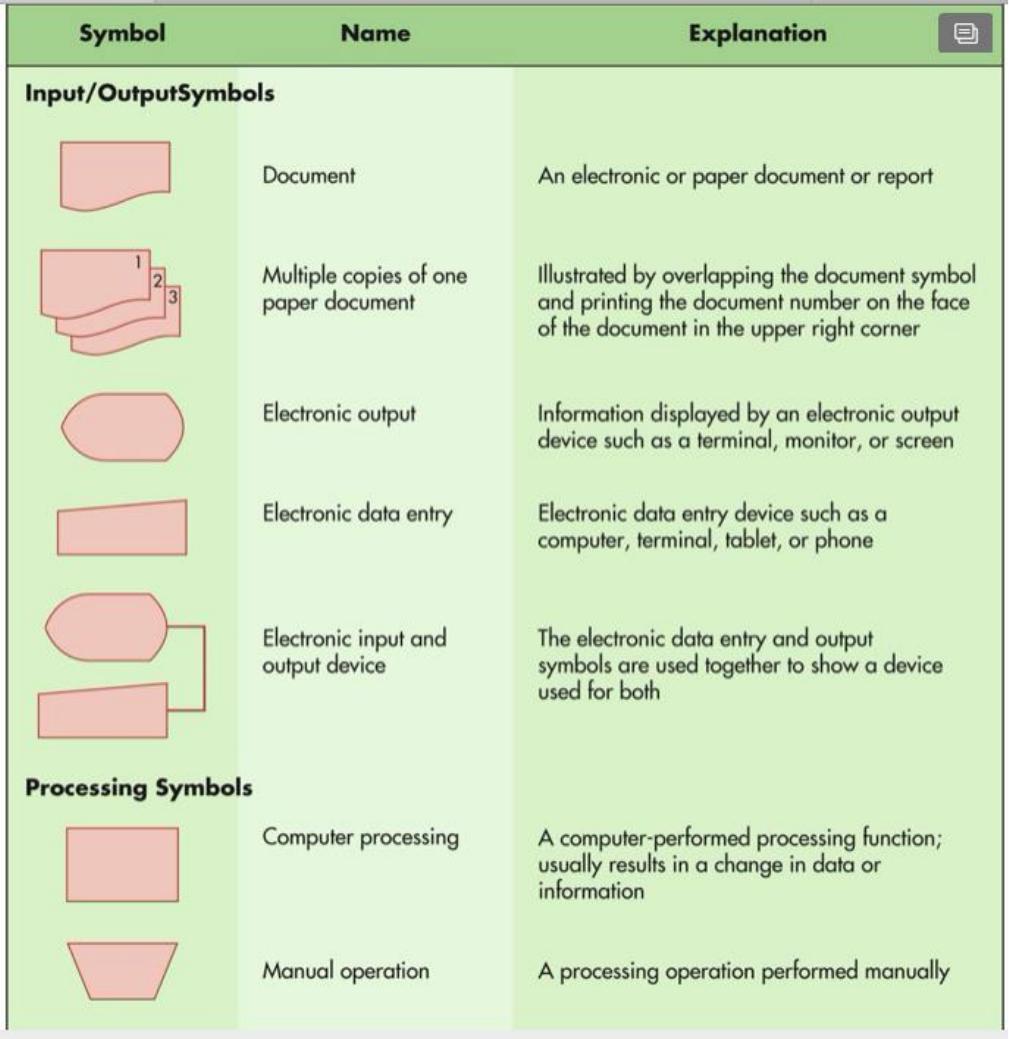
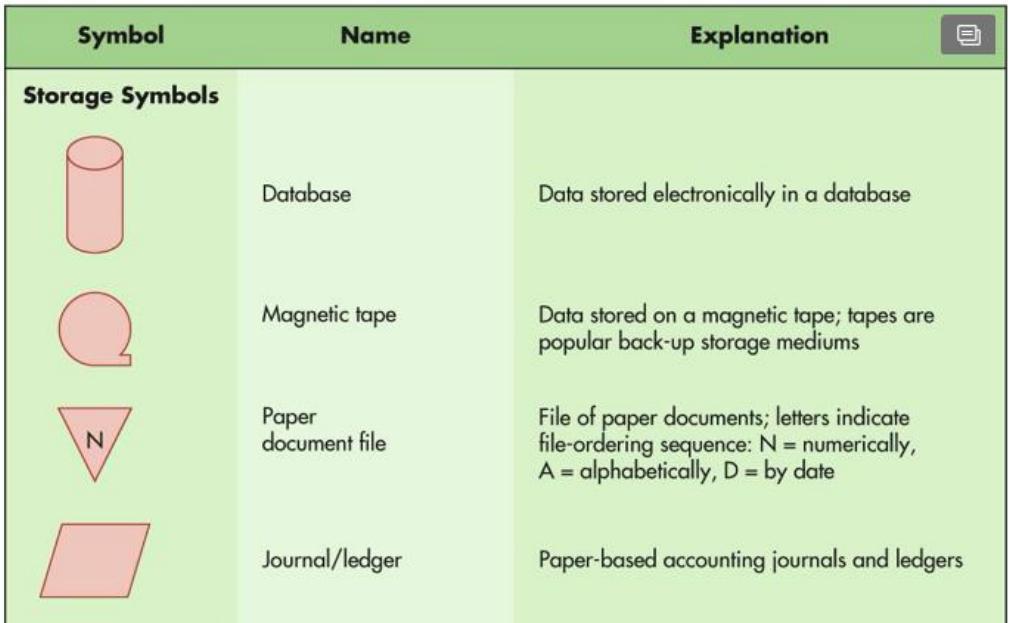
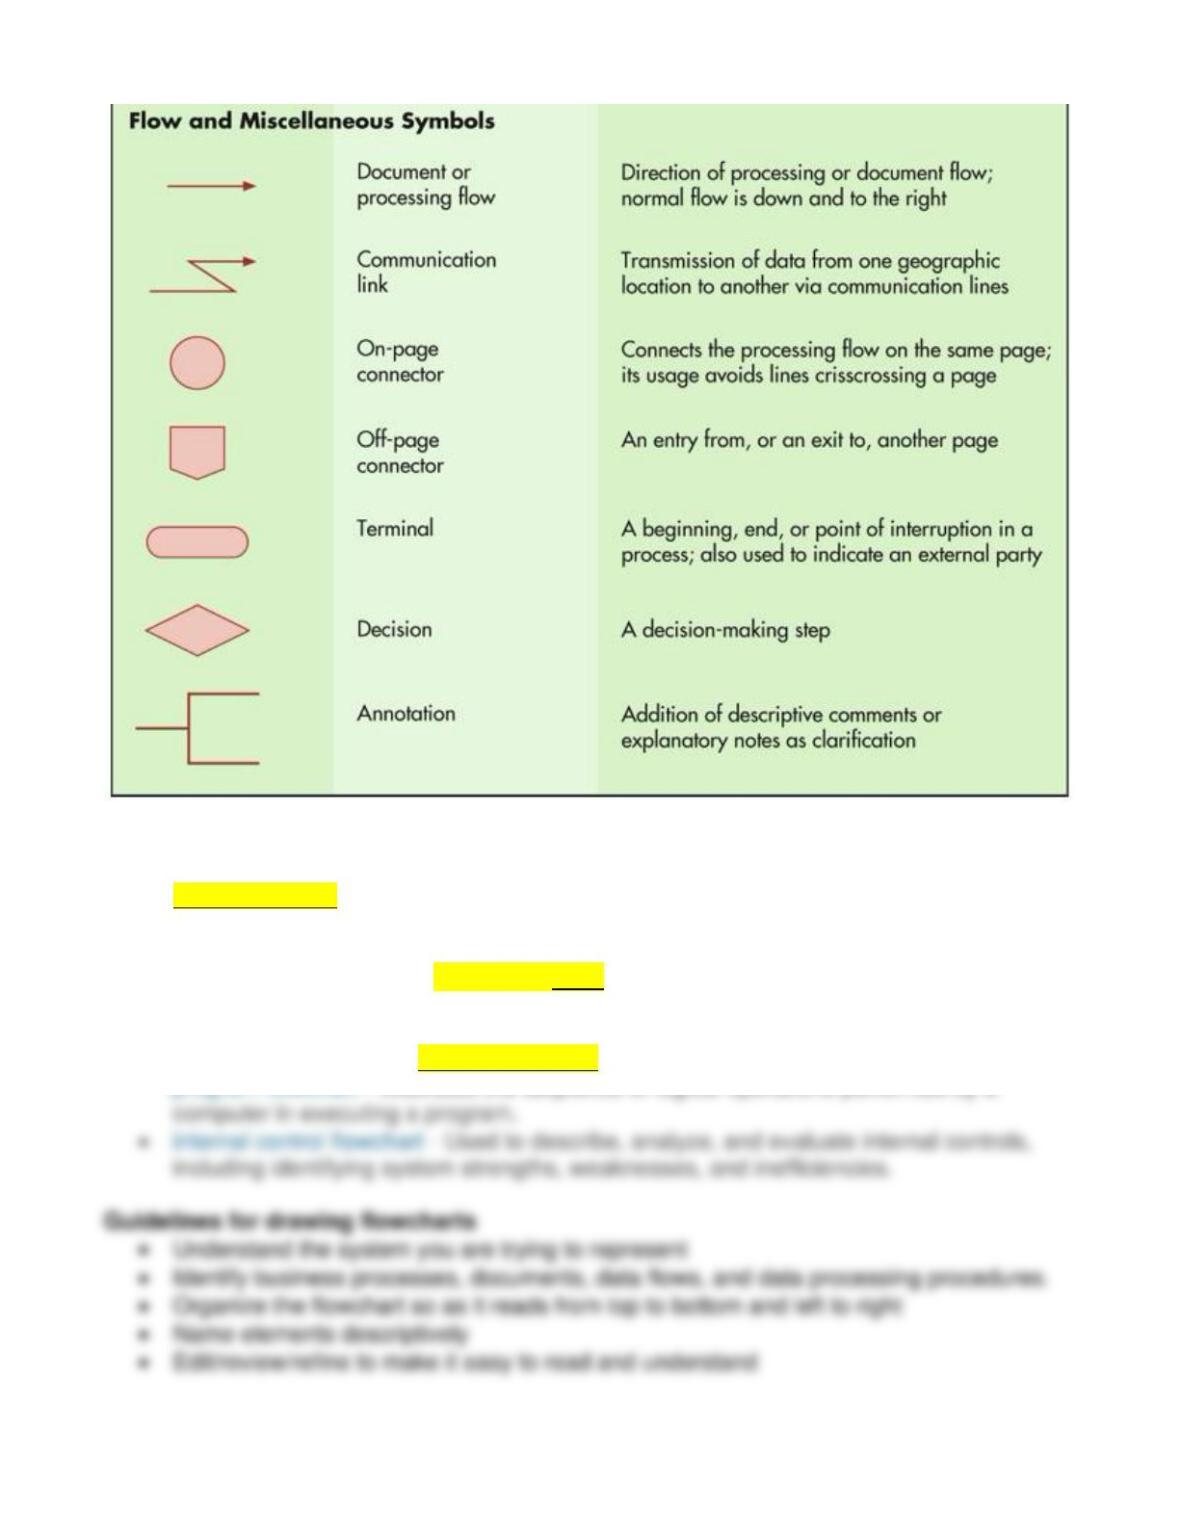
Flowcharts Symbols
1. Input/output symbols show input to or output from a system.
2. Processing symbols show data processing, either electronically or by hand.
3. Storage symbols show where data is stored.
4. Flow and miscellaneous symbols indicate the flow of data, where flowcharts begin or end,
where decisions are made, and how to add explanatory notes to flowcharts.
Types of flowcharts
• Document: shows the flow of documents and data for a process, useful in evaluating
internal controls
document flowchart – Illustrates the flow of documents and data among areas of
responsibility within an organization.
• System: depicts the data processing cycle for a process
system flowchart – Depicts the relationships among system input, processing, storage,
and output.
• Program: illustrates the sequence of logic in the system process