CHAPTER 12 INVENTORY MANAGEMENT
1. Importance of Inventory and its Types
Inventory is any stored resource used to satisfy need. Cash in a bank, blood supply in a hospital, water in a reservoir, and
finished products in a warehouse are good examples of inventory. The objective of inventory management is to strike a
balance between inventory investment and customer service.
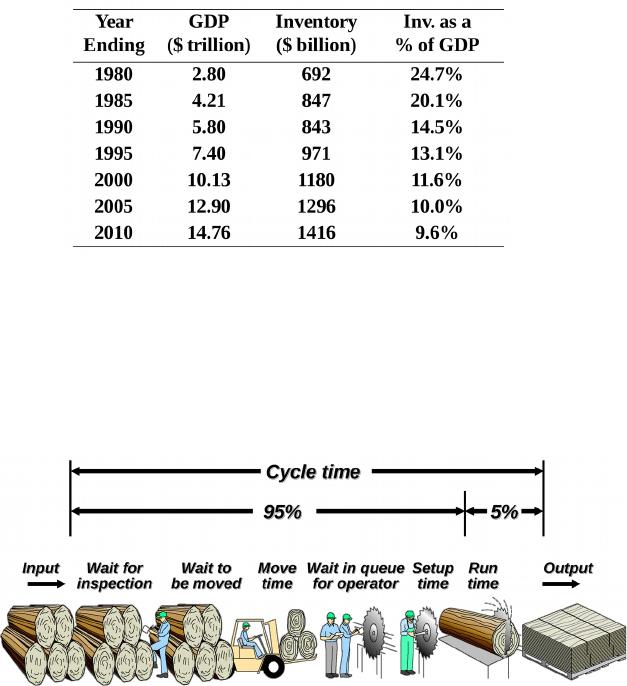
Inventory is one of the most expensive assets of many companies, representing as much as 50 percent of total invested
capital. The importance of inventory in the economy of the United States can be seen from the following table:
U.S. GDP and Inventories
Types of Inventory:
(1) Raw material inventory: This inventory has been purchased but not processed.
(2) Work-in-process inventory: This inventory includes components or raw materials that have undergone some change but
are not completed. WIP exists because of the time it takes for a product to be made (called cycle time). Reducing cycle
time reduces inventory.
(3) Maintenance/repair/operating supply (MRO) inventory: This inventory is devoted to maintenance/repair/operating
supplies necessary to keep machinery and processes productive. They exist because the need and timing for
maintenance and repair of some equipment are unknown.
(4) Finished-goods inventory: This inventory includes completed product waiting shipment. Finished goods may be
inventoried because future customer demands are unknown.
2. Managing Inventory
In practice, it is not uncommon that an operations manager is in charge of hundreds of different inventory items. ABC
analysis is used to divides on-hand inventory into three classifications according to the annual dollar volume.
oClass A – high annual dollar volume
oClass B – medium annual dollar volume
oClass C – low annual dollar volume
The idea is to establish inventory policies that focus resources on the few critical inventory parts and not the many trivial
ones. It is not realistic to monitor inexpensive items with the same intensity as very expensive items.
Procedure of ABC analysis
2
Step 1: Determine annual usage/sales for each item
Step 2: Determine the percentage of the total usage/sale by item
Step 3: Rank the items from highest to lowest percentage
Step 4: Classify the items into ABC categories
▶ Class A: 15% of item accounts for 70% – 80% of sales.
▶ Class B: 30% of items accounts for 15% – 25% of sales
▶ Class C: 55% of items accounts for 5% of sales
Item
Percent of
Number of
Items Stocked
Annual Volume
(unit)
Unit Cost = Annual Dollar
Volume
Percent of
Annual Dollar
Volume
Clas
s
#10286 17.5% 1,000 $90.00 $90,000 38.8% 72
%
A
#11526 500 154.00 77,000 33.2% A
#12760
33.9%
1,550 17.00 26,350 11.3% 23
%
B
#10867 350 42.86 15,001 6.4% B
#10500 1,000 12.50 12,500 5.4% B
#12572
48.6%
600 14.17 8,502 3.7%
5%
C
#14075 2,000 .60 1,200 0.5% C
#01036 100 8.50 850 0.4% C
#01307 1,200 0.42 504 0.2% C
#10572 250 0.60 150 0.1% C
8,550 $232,057 100.0%
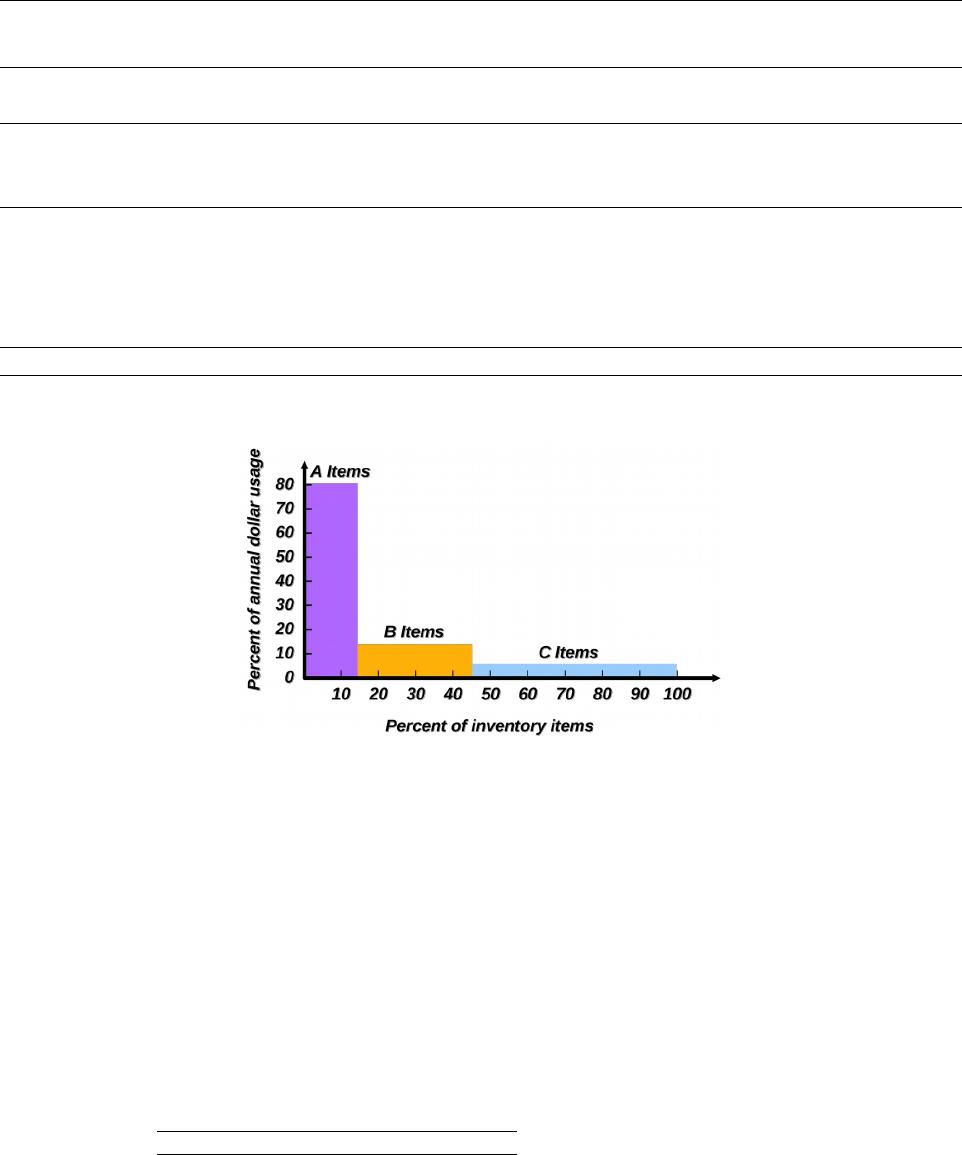
A graphic representation of ABC analysis can be shown as below:
Other criteria than annual dollar volume may be used
oHigh shortage or holding cost
oAnticipated engineering changes
oDelivery problems
oQuality problems
Policies employed may include
oMore emphasis on supplier development for A items
oTighter physical inventory control for A items
oMore care in forecasting A items
Example 12.1: Omega Corporation is a small manufacturer of computer connectors in
Raleigh, North Carolina. The materials which go into a connector are summarized
below:
Material Annual usage Unit cost ($)
A-2 3,870 0.25
3
B-7 1,550 0.66
C-1 990 7.01
D-9 2,150 12.30
E-4 775 8.90
F-6 7,000 0.13
G-5 1,285 5.74
H-3 1,900 15.06
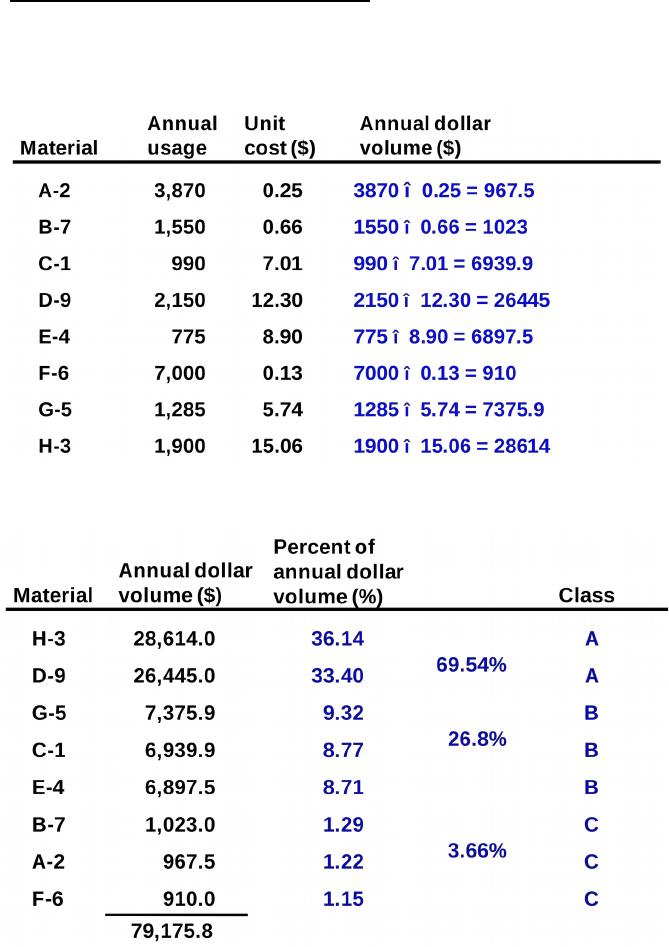
Perform an ABC analysis on the eight inventory items carried by LLB.
[Solution]
Step 1: calculate the annual dollar volume
Step 2, 3 & 4: Determine the percentage, Rank the items from highest to lowest percentage & Classify the items into ABC
categories
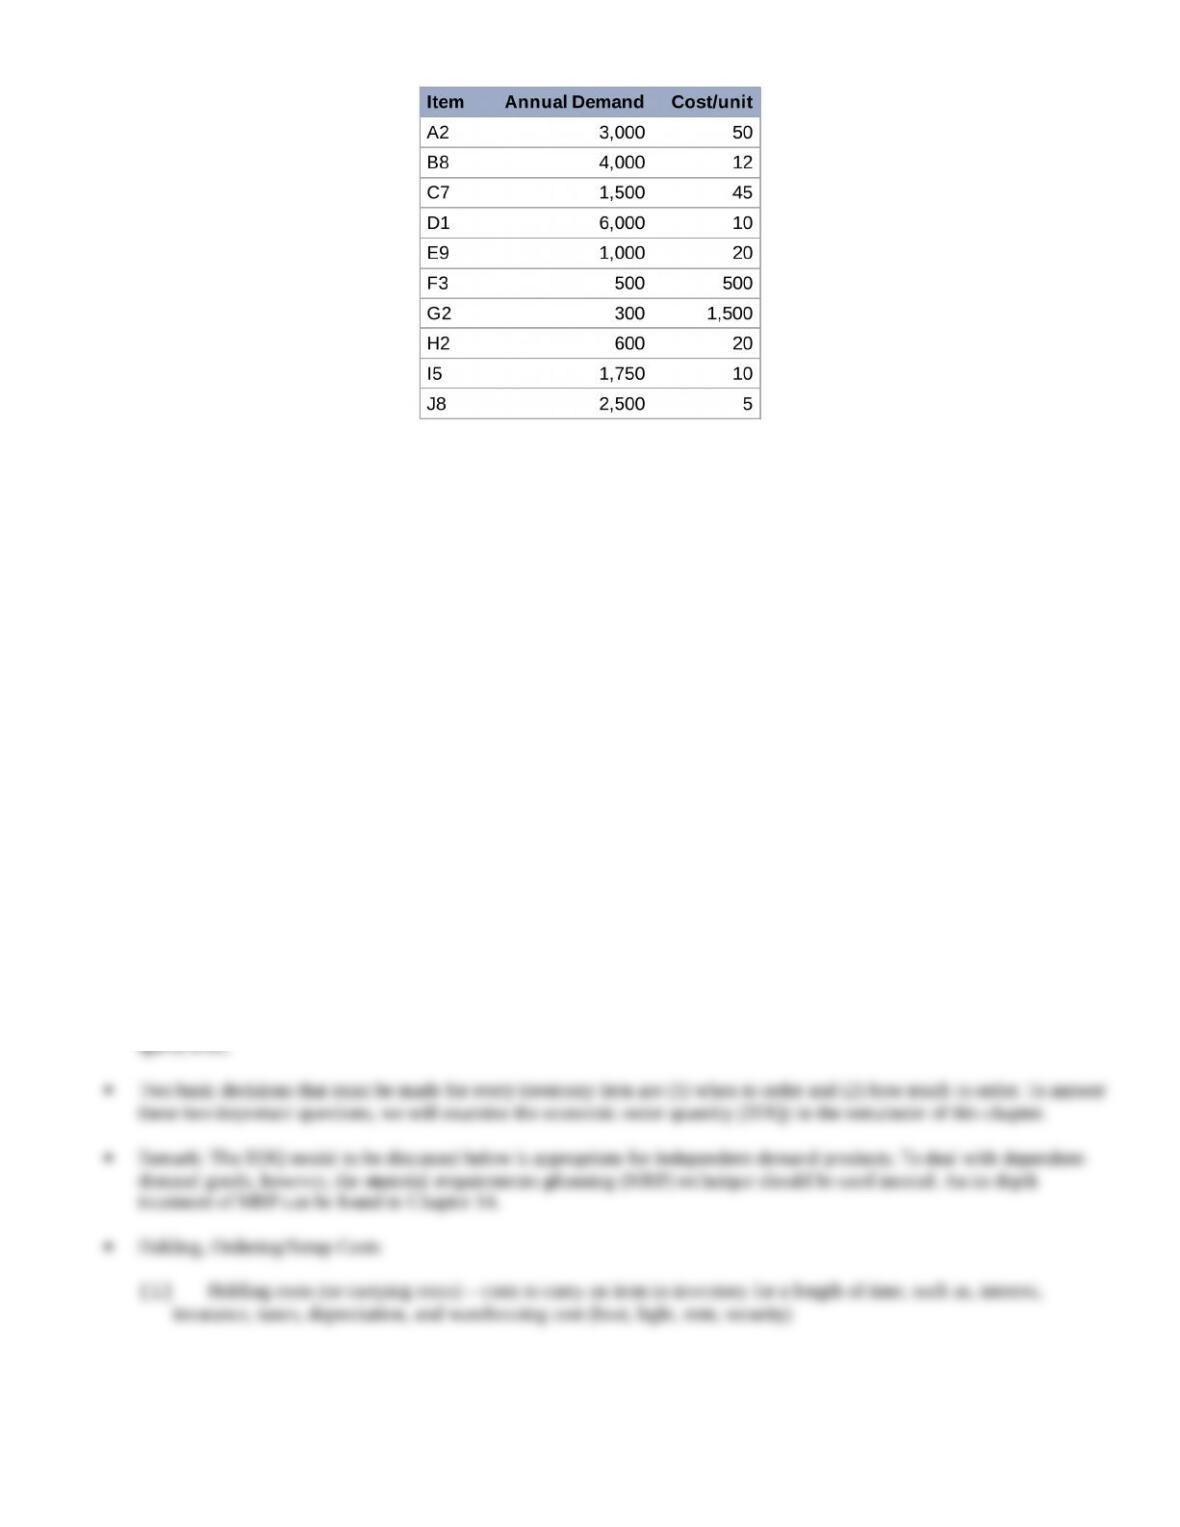
EX 1 in class (Problem 12.2, Page 507): Boreki Enterprises has the following 10 items in inventory. Theodore Boreki asks
you, a recent OM graduate, to divide these items into ABC classifications
4
Cycle Counting: Items are counted and records updated on a periodic basis. It is often used with ABC analysis
oA items should be counted frequently
oC items will be counted least frequently
3. EOQ Model
The current chapter focuses on the management of inventory items for which the demand is independent of other items. For
instance, the demand for microwave ovens is generally independent of that for bookshelves. On the other hand, there are
numerous situations in which the demand for a product depends on that for another product. A handy example is that an
automaker‘s demand for tires depends on the demand for the automobiles since each car requires five (four regular plus one