UV0455
This note was prepared by Robert M. Conroy, Associate Professor of Business Administration. This note was
written as a basis for class discussion rather than to illustrate effective or ineffective handling of an administrative
situation. Copyright © 1990 by the University of Virginia Darden School Foundation, Charlottesville, VA. All
rights reserved. To order copies, send an e-mail to dardencases@virginia.edu. No part of this publication may be
reproduced, stored in a retrieval system, used in a spreadsheet, or transmitted in any form or by any means—
electronic, mechanical, photocopying, recording, or otherwise—without the permission of the Darden School
Foundation. Rev. 5/91.
CAPITAL STRUCTURE AND FIRM VALUE
The 1980s were the decade of debt. Numerous articles and commentators have discussed
the growing use of debt by American nonfinancial corporations. These companies nearly doubled
their debt from 1982 through 1988. Deals such as the $11 billion purchase of Kraft by Phillip
Morris and the leveraged buyout of RJR Nabisco for $17.6 billion, which involved huge amounts
of borrowing, focused attention on the issue of debt. As corporate debt became an important issue,
we saw the following kinds of headlines:
“Has the Debt Binge Gone too Far?” Fortune, April 25, 1988;
“Learning to Live with Leverage, New Risks, New Rewards–and
Bigger Failures?” Business Week, November 7, 1988.
The question was framed in terms of whether debt is excessive. The real questions from a
finance point of view, however, are: What is the impact on firm value from the substitution of debt
for equity? Is there a difference in the values of two firms that differ only in capital structure? Is
there such a thing as an optimal capital structure that maximizes the market value of the firm? The
answers to these questions are still unresolved.
This note summarizes some of the basic issues related to capital structure. Although no
“truth” about capital structure exists, some concepts are available to help us understand the
tradeoffs involved when deciding to use debt.
Historical Perspective
In order to determine if current debt levels are abnormally high and to begin to think in
terms of what is an appropriate level of debt, we need some historical perspective on corporate debt
levels. These levels may be viewed in two ways. The most basic is to use book values; the second
is to calculate debt ratios in terms of market values. These two approaches only occasionally give
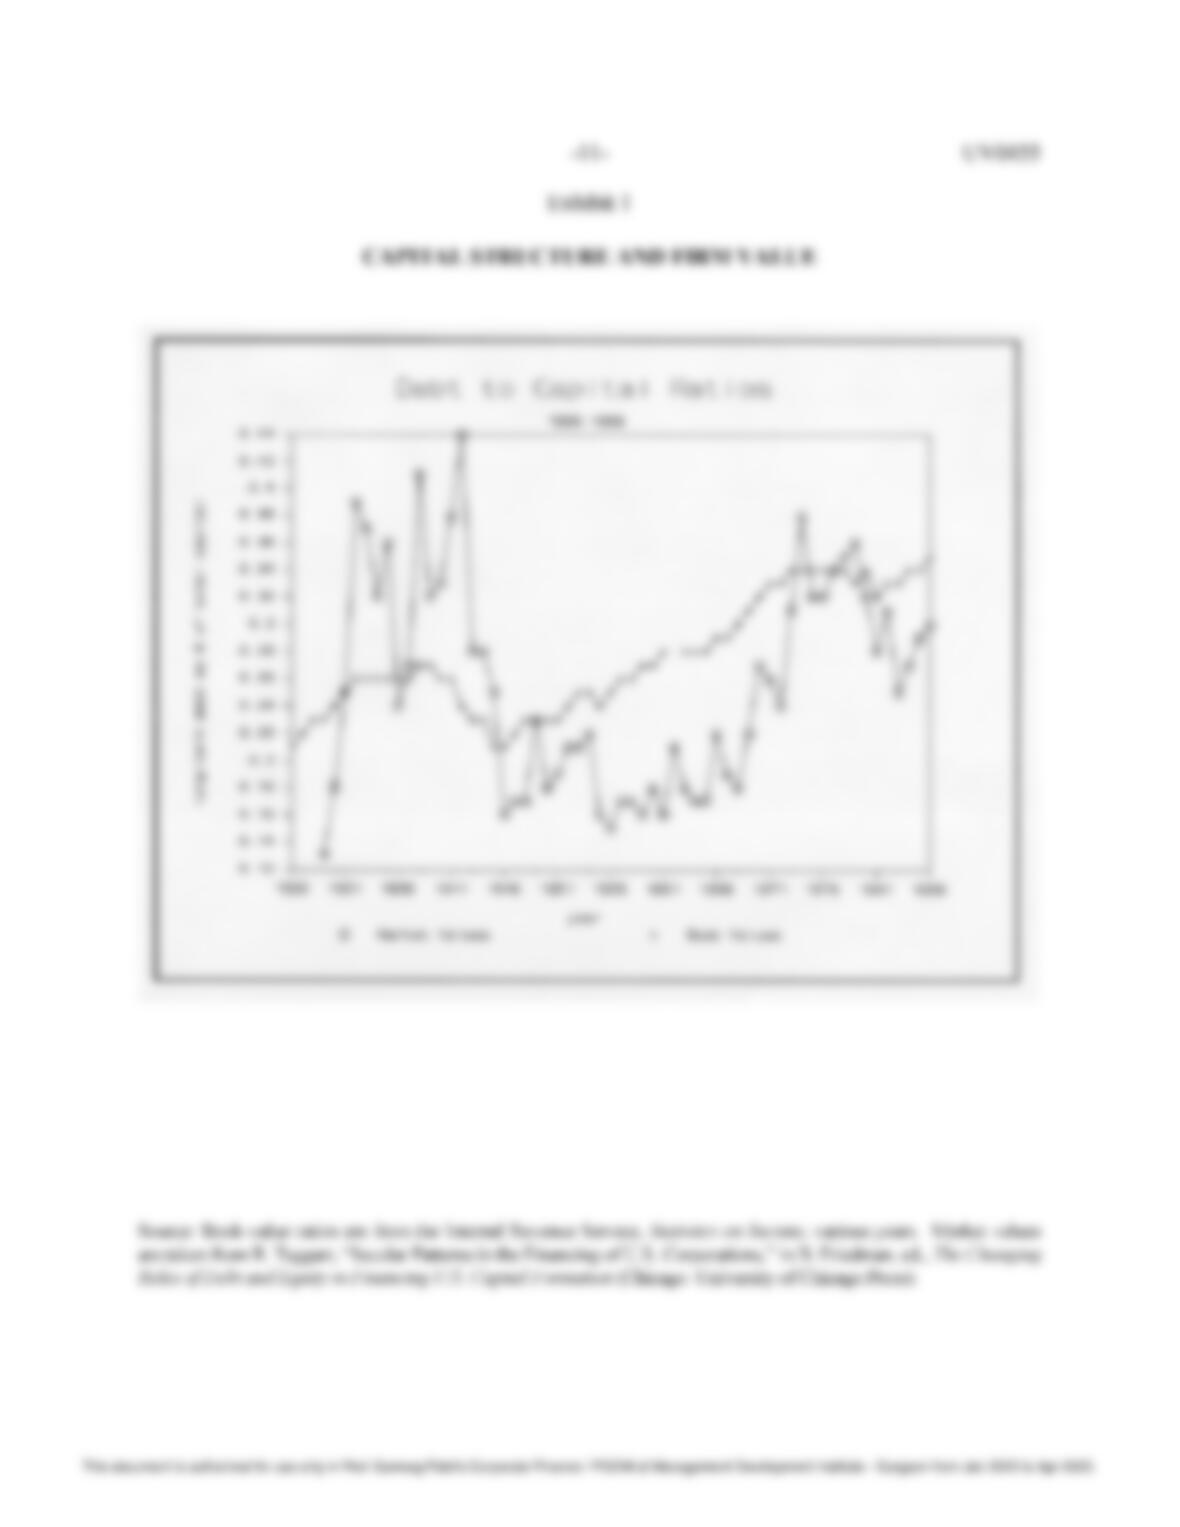
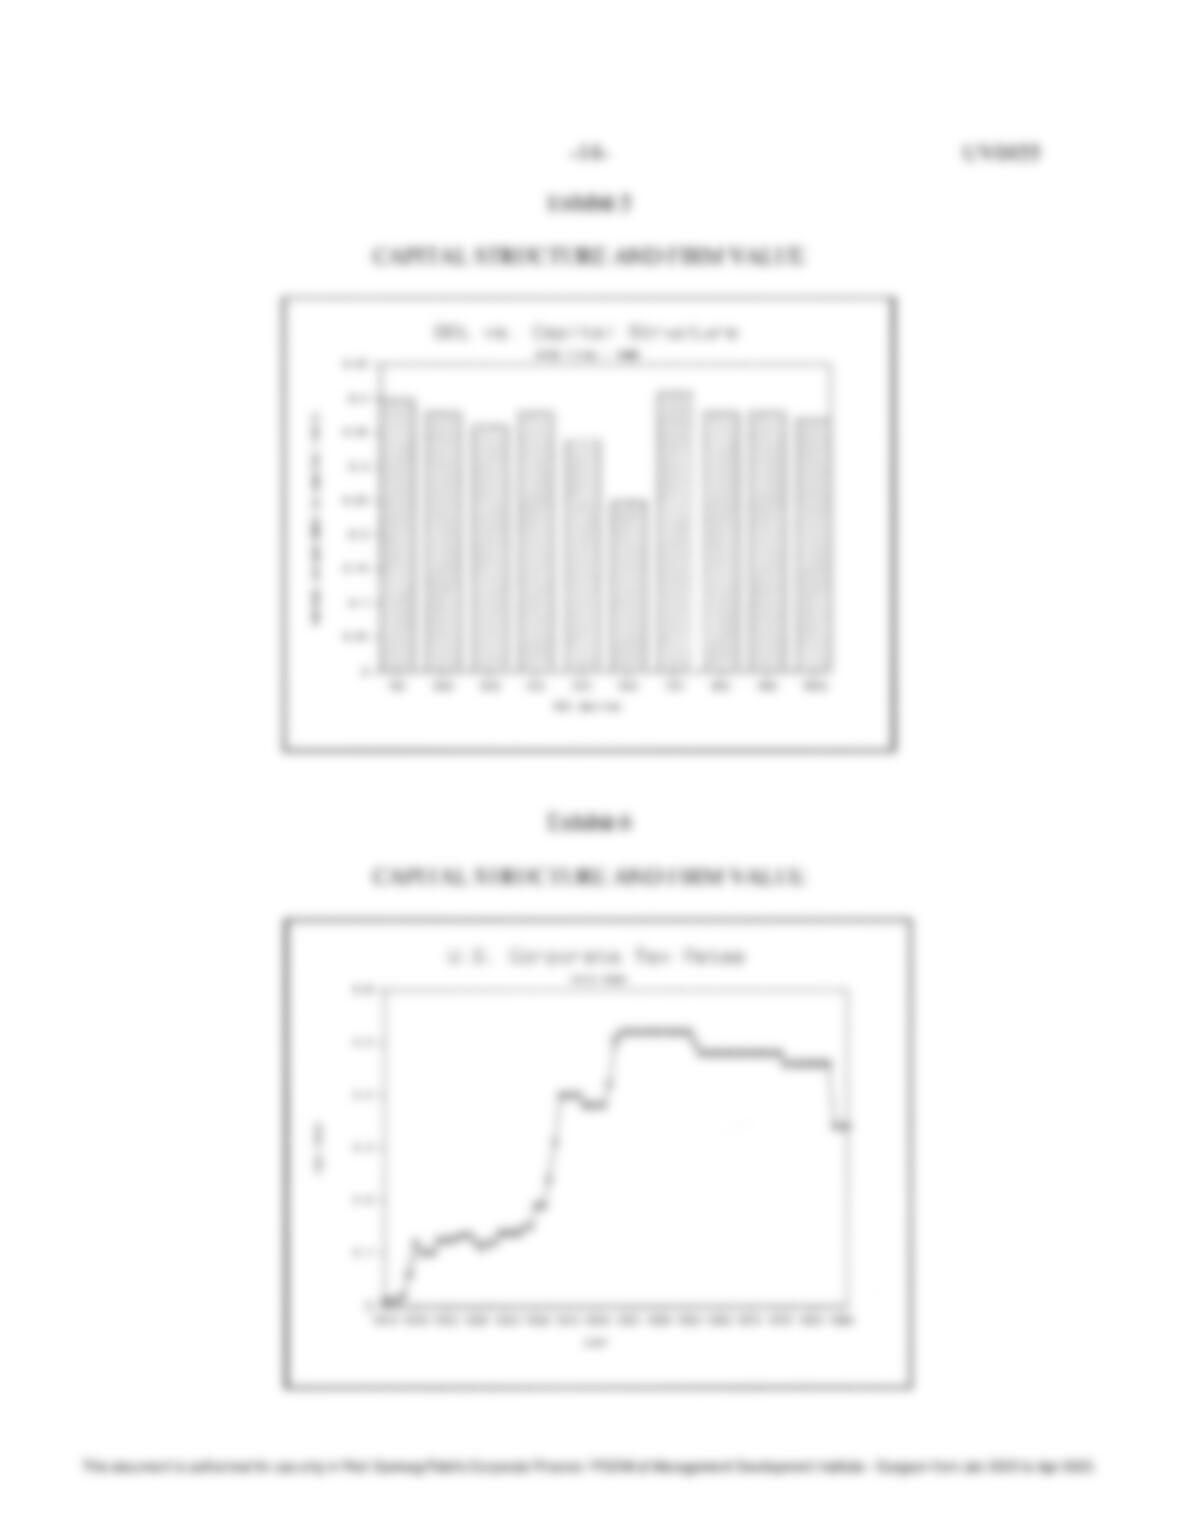
us the same answer. Exhibit 1 shows both book- and market-value ratios of long-term debt to total
This document is authorized for use only in Prof. Samveg Patel’s Corporate Finance / PGDM at Management Development Institute – Gurgaon from Jan 2023 to Apr 2023.
-2- UV0455
capital, where total capital is defined as long-term debt, preferred stock, and equity. This exhibit
clearly shows that market-value and book-value debt-to-capital ratios are most of the time not the
same. In some periods, book-value ratios exceed market-value ratios; in other periods, the opposite
is true.
If we focus only on book values, we can see that debt levels were relatively high during the
1930s. They declined during World War II but have risen fairly consistently since the end of the
war. Since 1970, however, the trend seems to have leveled off when compared with some earlier
periods, although the debt level is at an historical high. In terms of market values, we find wide
variations in debt-to-capital ratios over the last 60 years. One thing to note is the correlation
between the stock market and the debt-to-capital ratios. Major stock market declines occurred
from 1929 through the early 1930s and then again in the mid-1970s. It is during these same
periods that we see the market-value debt-to-capital ratios at their highest levels. Overall, we can
see that, although 1986 found book-value ratios of debt levels at an historical high point, market
values were still lower than those found in the early 1970s. Long-term debt levels are apparently at
relatively high levels both in terms of book and market values.
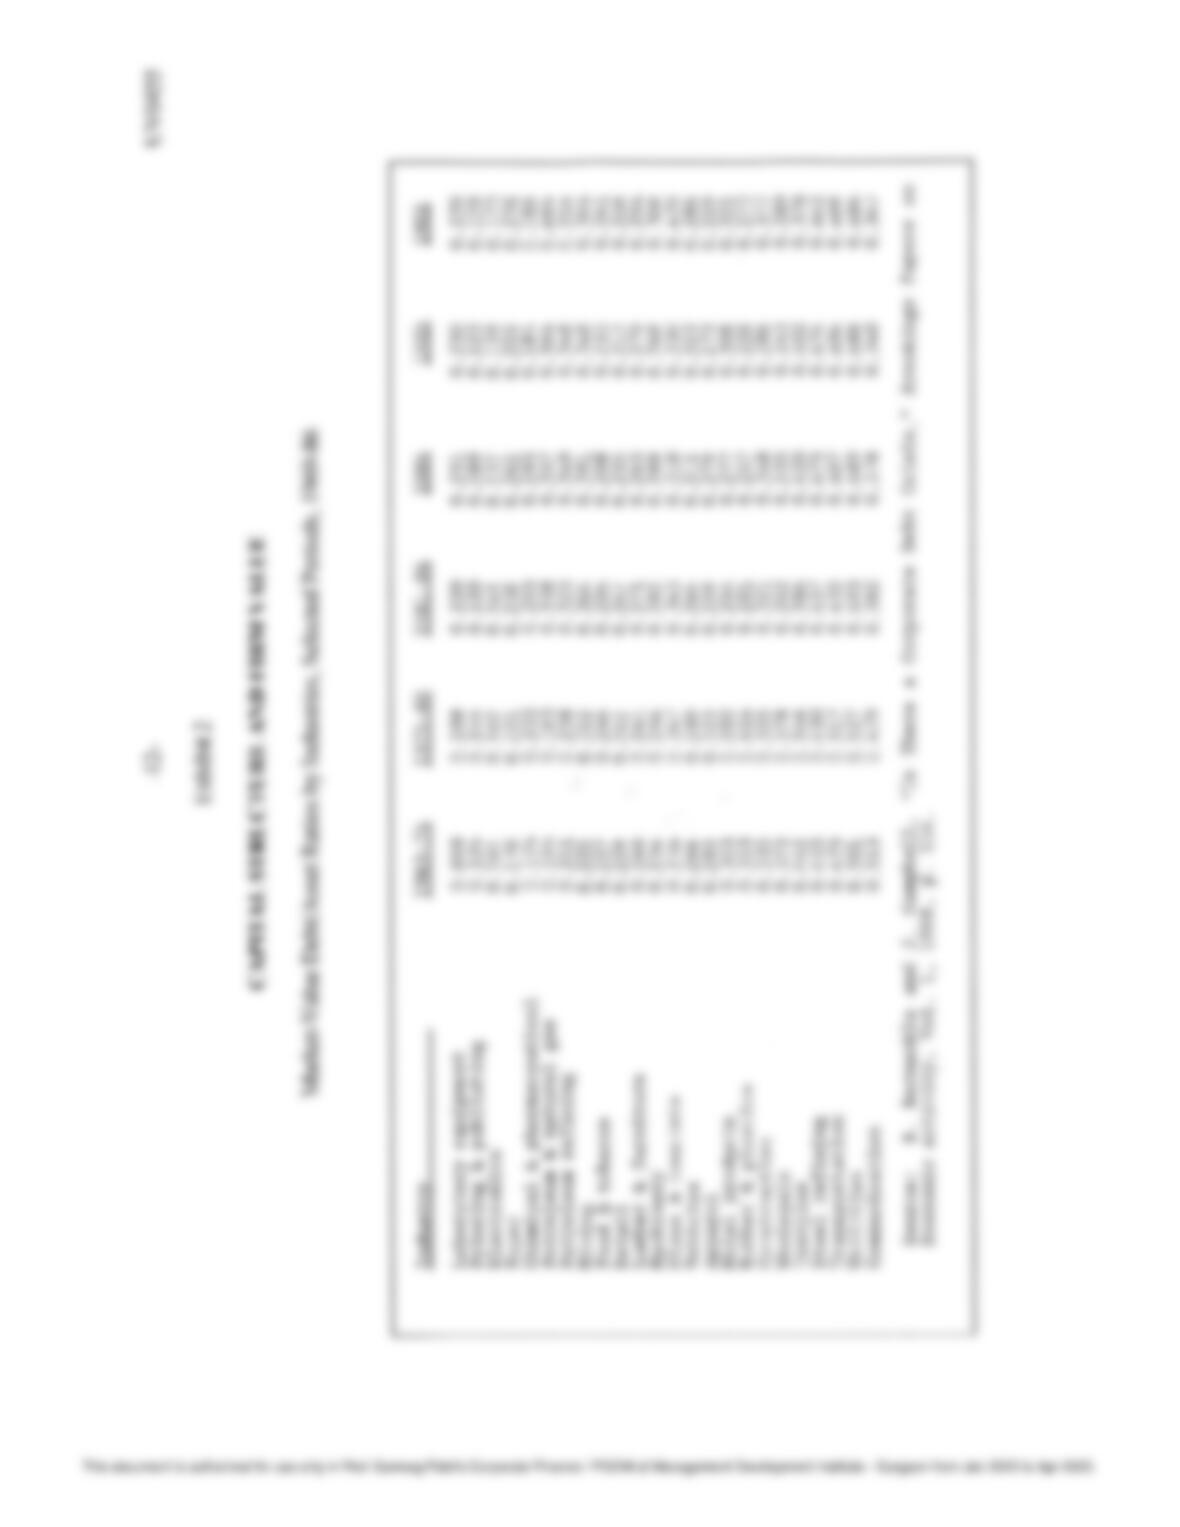
Exhibit 2 presents market-value-based estimates of debt-to-asset ratios for different
industries over various time periods. We can see differences across industries–printing &
publishing with a low debt-to-asset ratio of 15.9% in 1986, and utilities with a high debt-to-asset
ratio of 48.6% in 1986. The ratios also vary over time. For example, the debt to asset ratio of
textiles goes from 44.2% during 1969-74 up to 54.6% in 1975-80 and then down to 38.4% in 1981-
86. Overall, the variability across industries is great; the variability over time is less.
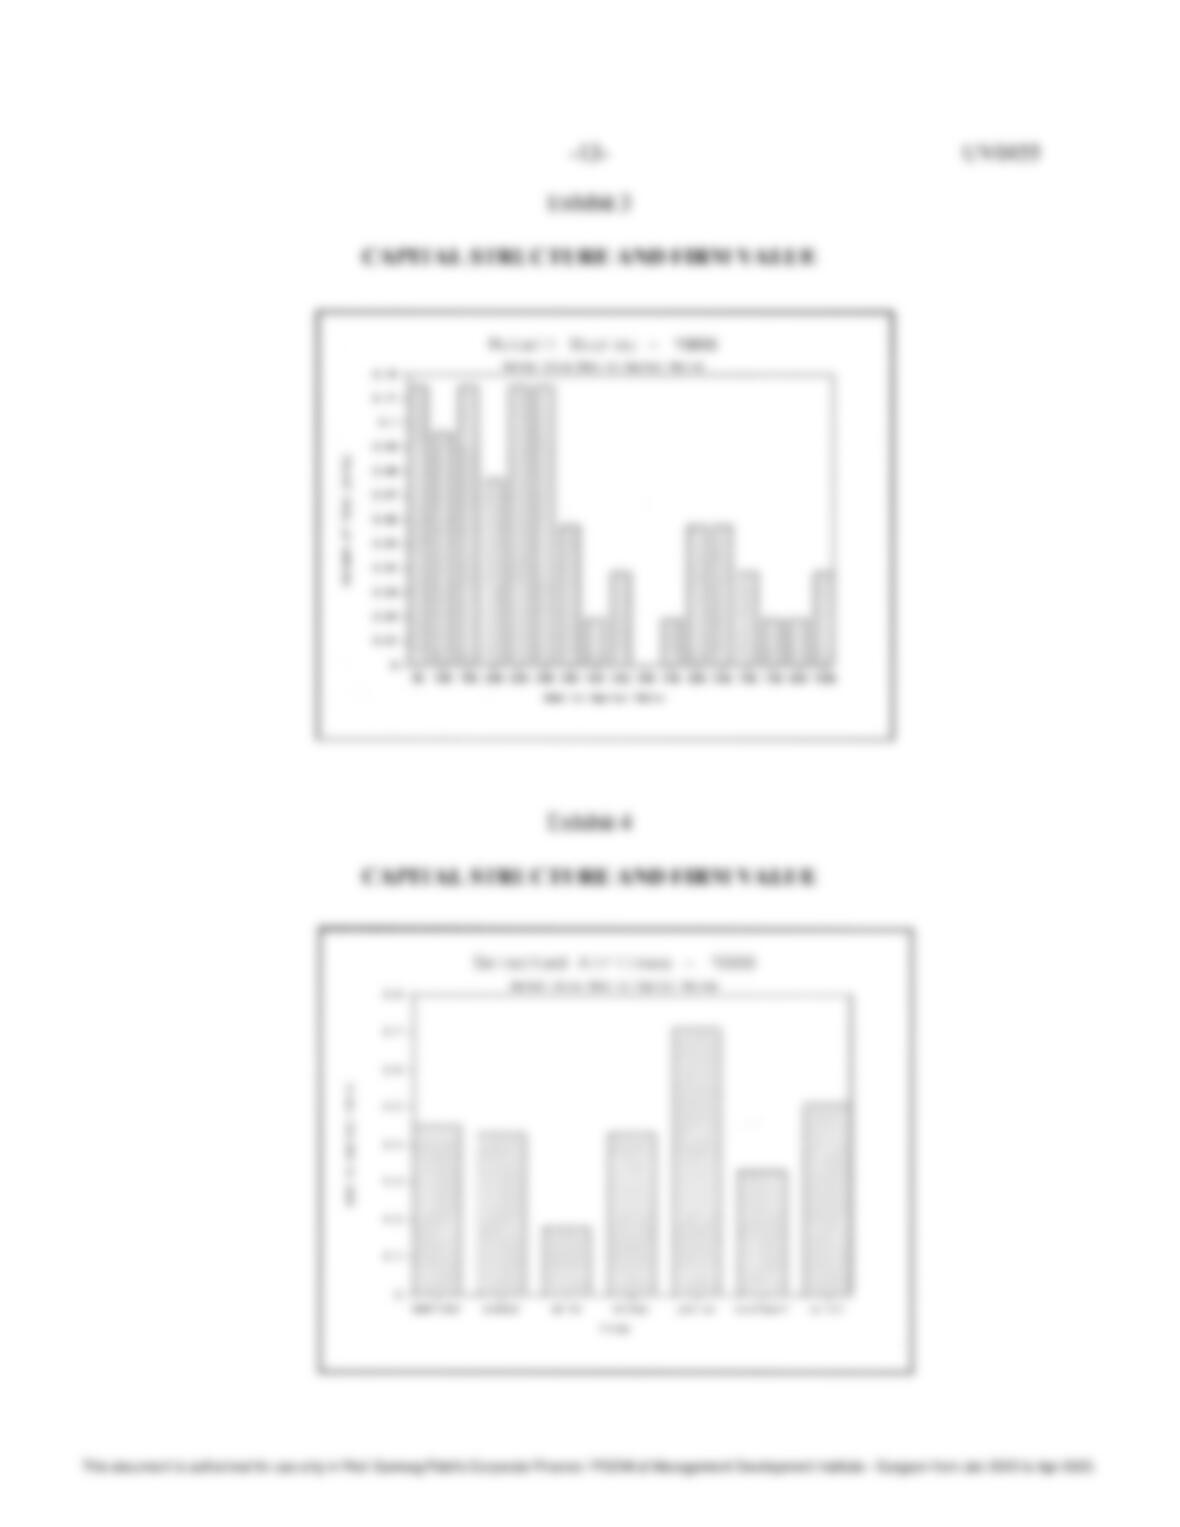
Exhibits 3 and 4 show the distribution of market-value-based estimates of debt-to-capital
ratios within two selected industries for 1988. Exhibit 3, the distribution for retail stores, exhibits
some clustering at the lower end, but the debt-to-capital ratios are still fairly uniformly distributed
between 5% and 40%. For the 7 airlines shown in Exhibit 4, the debt-to-capital ratios are less
varied than for the retail stores. Of the 7, 4 have ratios in a narrow range of 40% to 50%. The two
exceptions are Delta and Pan Am, which are at the extremes of about 18% and about 71%,
respectively. Some questions can thus be raised about the capital structures of these firms. Does
Delta have too little debt? Does Pan Am have too much? We do not have enough information to
answer these questions, but clearly notions about industry averages do play an important role in
determining what is an appropriate level of debt.
What should one conclude from this historical perspective? First, capital structures do
change over time, whether they are measured in terms of book value or market value. In addition,
industries differ. Some industries, such as utilities, have relatively high debt ratios. Others, such as
printing and publishing, have low debt ratios. Even within industries, differences show up. These
differences make identifying how much debt is too much or what is an optimal capital structure
very difficult. There are, however, some basic relationships that affect the capital-structure
decision and, through it firm value.
This document is authorized for use only in Prof. Samveg Patel’s Corporate Finance / PGDM at Management Development Institute – Gurgaon from Jan 2023 to Apr 2023.

-3- UV0455
Business Risk and Debt
One important determinant of the use of debt is the type of business in which the firm
engages. Because debt in the form of interest is paid out from earnings before interest and taxes
(EBIT), lines of business where the EBIT is highly variable should tend to use less debt. One
frequently used measure of EBIT variability is degree of operating leverage (DOL), defined as
follows:
%ΔEBIT
DOL = %ΔSales
It provides a simple expression relating percentage changes in sales to percentage changes in EBIT,
where %ΔSales x DOL = %ΔEBIT. DOL translates percentage changes in sales to percentage
changes in EBIT. The larger DOL is, the more sensitive EBIT is to changes in sales.
An alternative way of calculating DOL is
Sales – Variable costs_________
DOL = Sales – Variable costs – Fixed costs
This way of calculating DOL shows what DOL measures. If fixed costs are zero, then
degree of operating leverage is one. As fixed costs increase, DOL increases. Therefore, businesses
with relatively high proportions of their total costs fixed tend to have high degrees of operating
leverage. Small changes in their sales can have large impacts on EBIT. We would expect these
firms to have relatively lower levels of debt. Exhibit 5 shows the debt-to-capital ratios for firms
listed on the New York Stock Exchange (NYSE) for different deciles of DOL.1 Based on our
discussion, we would expect the debt-to-capital ratio to decline as DOL increases. What we see
instead is an almost constant level of debt-to-capital ratios across the different deciles of DOL,
which implies that DOL does not play a role in the debt decision.
Does this mean DOL and debt-to-capital ratios have no relationship? The answer is no, but
Exhibit 5 does point up the difficulty in actually calculating a meaningful estimate of DOL from
income statements and trying to relate it to debt. The concept of operating leverage is still valid,
but as we can see, it is difficult to validate empirically.
1 DOL is calculated as the average DOL of the last 4 years, t = 1, 2, 3, and 4, where DOLt is estimated as follows:
%ΔEBITt
DOLt = %ΔSalest
This document is authorized for use only in Prof. Samveg Patel’s Corporate Finance / PGDM at Management Development Institute – Gurgaon from Jan 2023 to Apr 2023.
-4- UV0455
Financial Risk and Debt
A helpful way to understand the relationship of business risk to financial risk is the concept
of financial leverage. Because equity is paid after the fixed payment to the debtholders, the use of
debt can drastically alter the volatility of what is left for the equity. The portion of income
available to equity is net profit after tax (NPAT). One frequently used measure of NPAT
variability is degree of financial leverage (DFL), defined as follows:
%ΔNPAT
DFL = %ΔEBIT
This simple expression relates percentage changes in EBIT to percentage changes in NPAT, where
%ΔEBIT x DFL = %ΔNPAT. The larger DFL is, the more sensitive NPAT is to changes in EBIT.
An alternative way of calculating DFL is
Sales – Variable costs – Fixed costs______
DFL = Sales – Variable costs – Fixed costs – Interest
This calculation method shows what DFL measures. If a firm has no debt (i.e., interest costs are
0), the degree of financial leverage is 1. Note that, unlike operating leverage, which to a large