Calculating the Length of a Curved Road
Introduction
The purpose of this investigation is to attempt to calculate the length of a curved road.
This topic piqued my interest as I began to delve further into calculus. I often create
mathematical puzzles that apply to my travels to keep me occupied. There have been countless
incidents where I have been on road trips that seemed to never end. With straight and narrow
roads, I could somewhat determine the next destination, though the twisted and curved roads
seemed to go on forever. While on a winding road during a northern trip, I realized that there
must be a way to calculate the distance between the starting and finishing point. As soon as I
considered the idea, I began to do research. I started by considering everything that I would need
in order to be able to perform these calculations. I would need a graph with coordinates
representing the street, which would help me to find an equation by using exponential regression.
In order to add more personality into the investigation, I decided to choose a street that is
local to me. While searching for a curved road, I made sure to seek one that would closely
resemble a standard exponential function so that the graph of the equation would be able to
closely match the coordinates of the street. The street I used is named Stoner Street, located in
Akron, Ohio. When deciding on coordinates for the street, I created my own graph and own
coordinates rather than using latitude and longitude in order to eliminate the possibility of
negative coordinates, which will help minimize errors and allow the exponential equation to
come out cleaner.
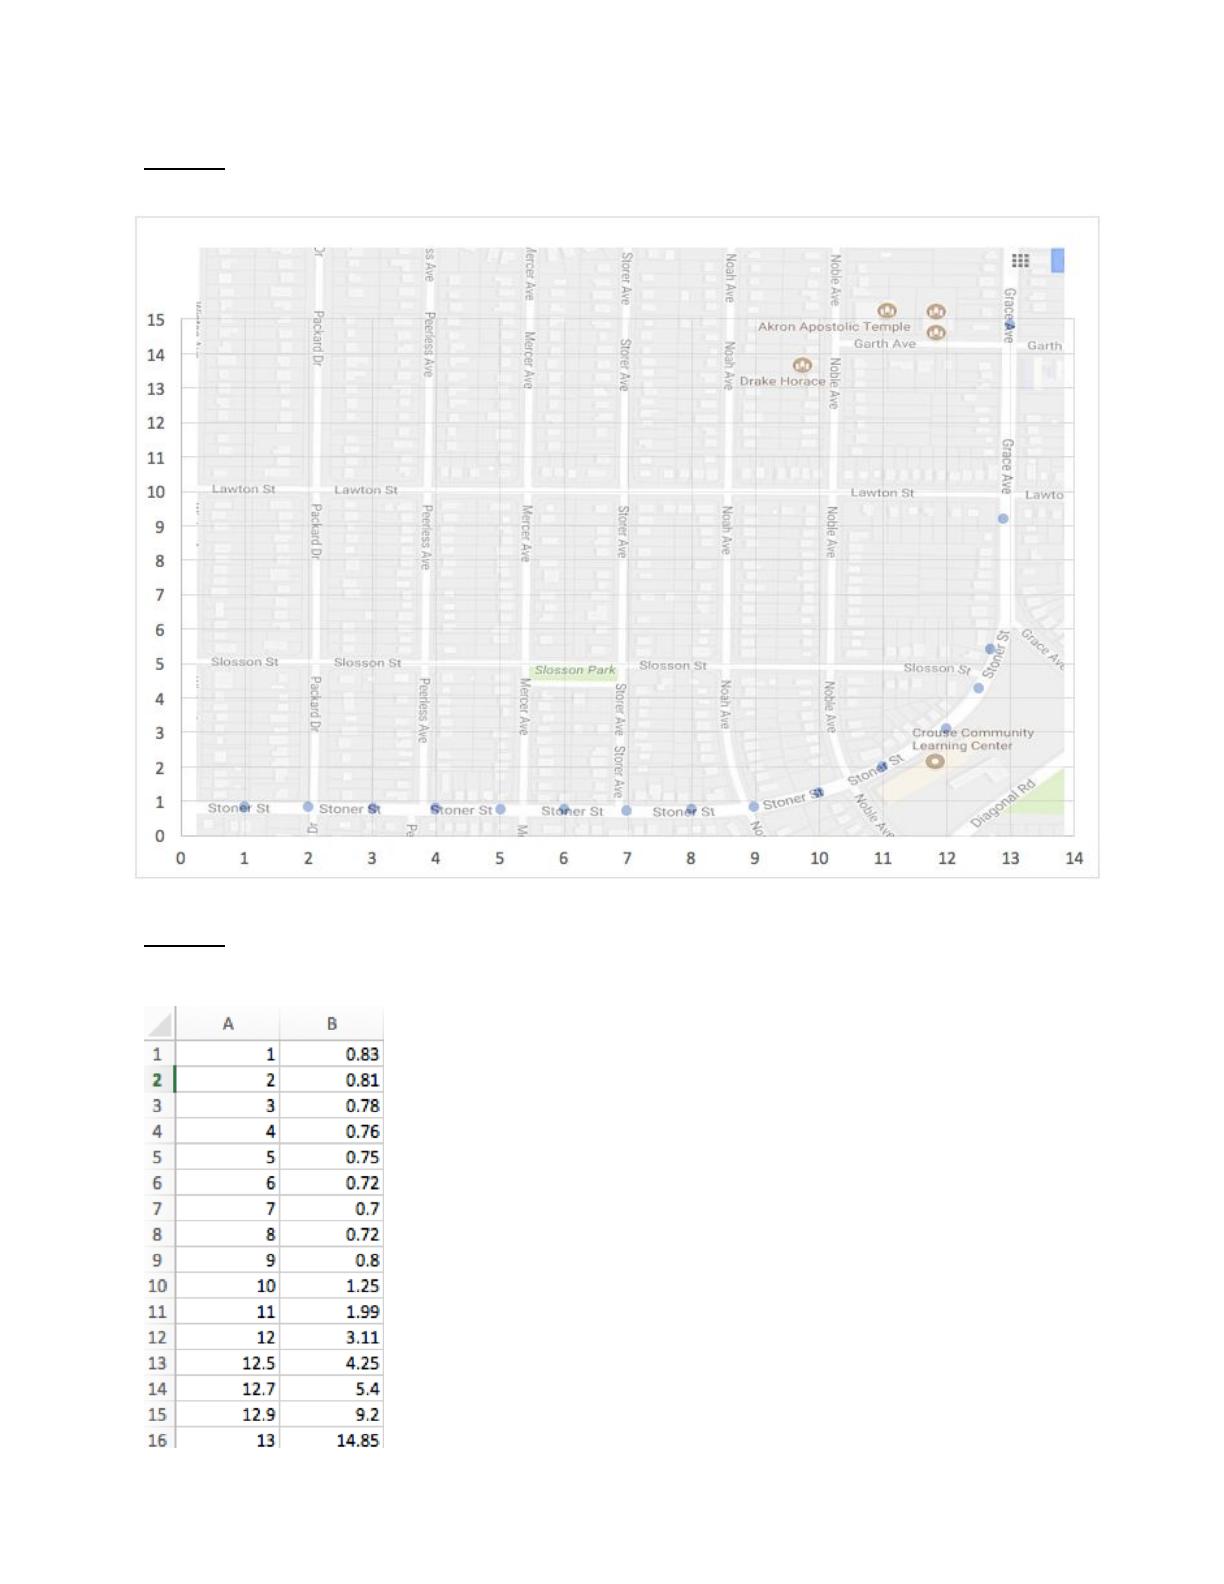
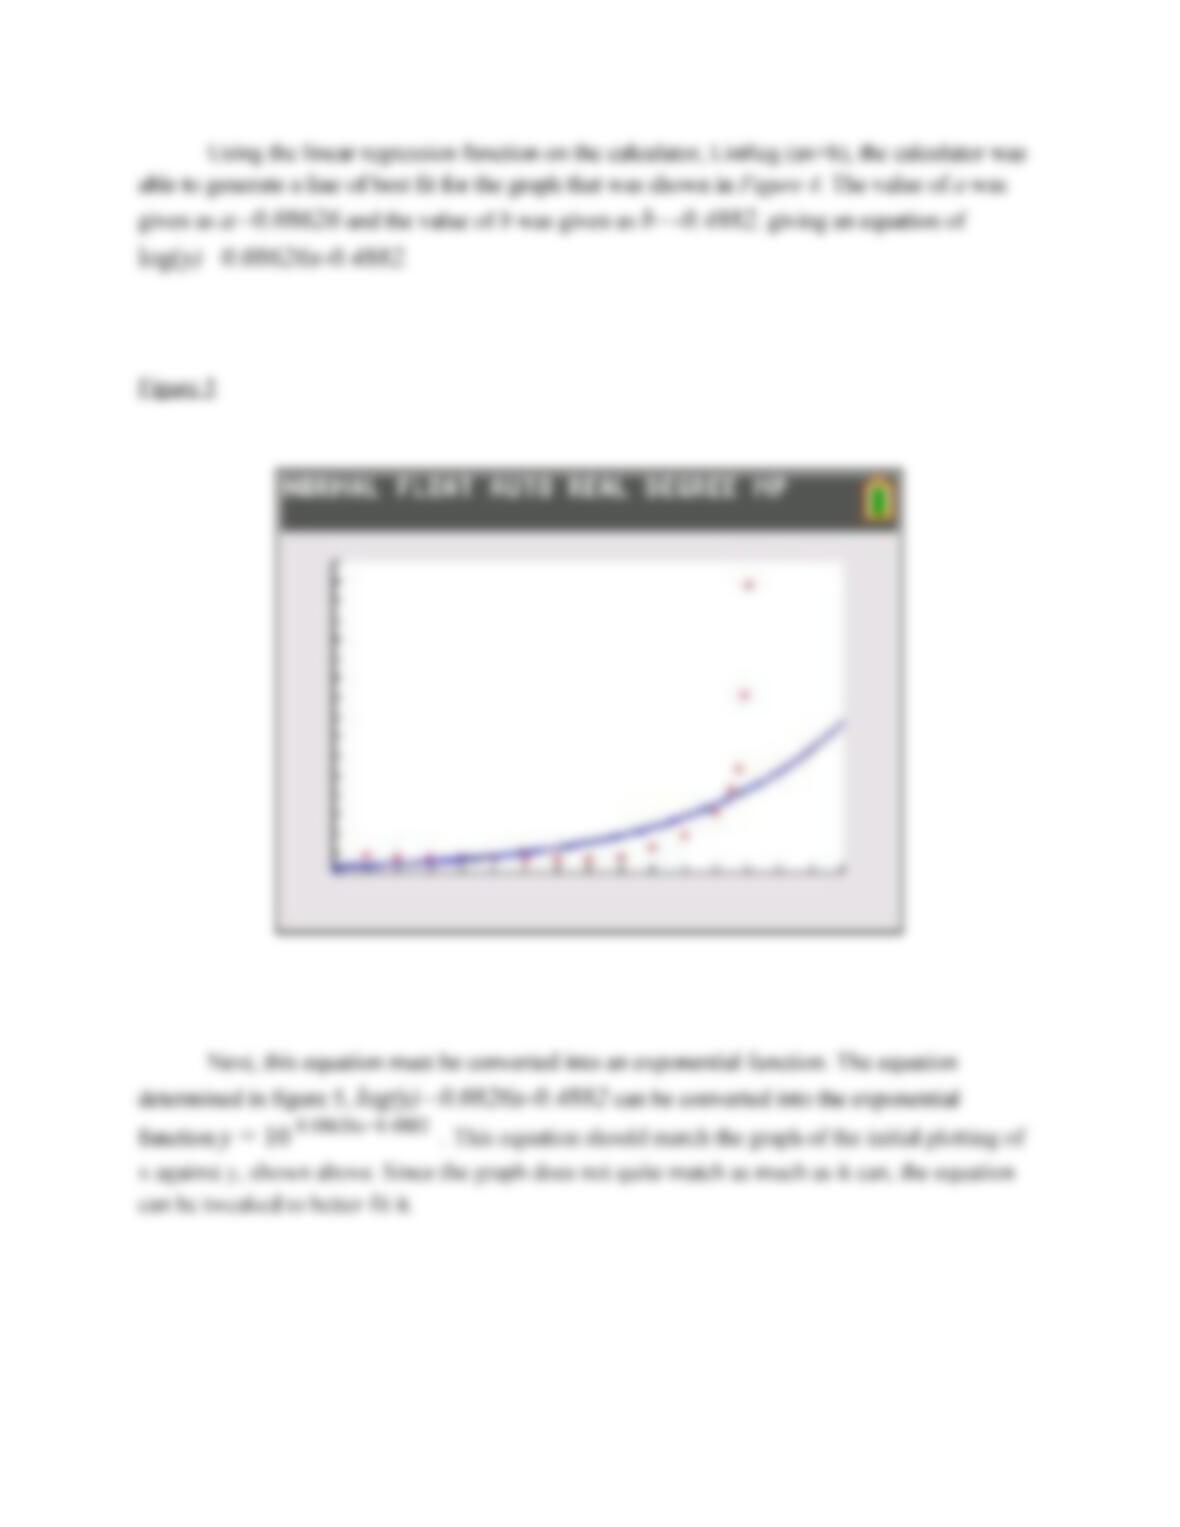
Figure 1
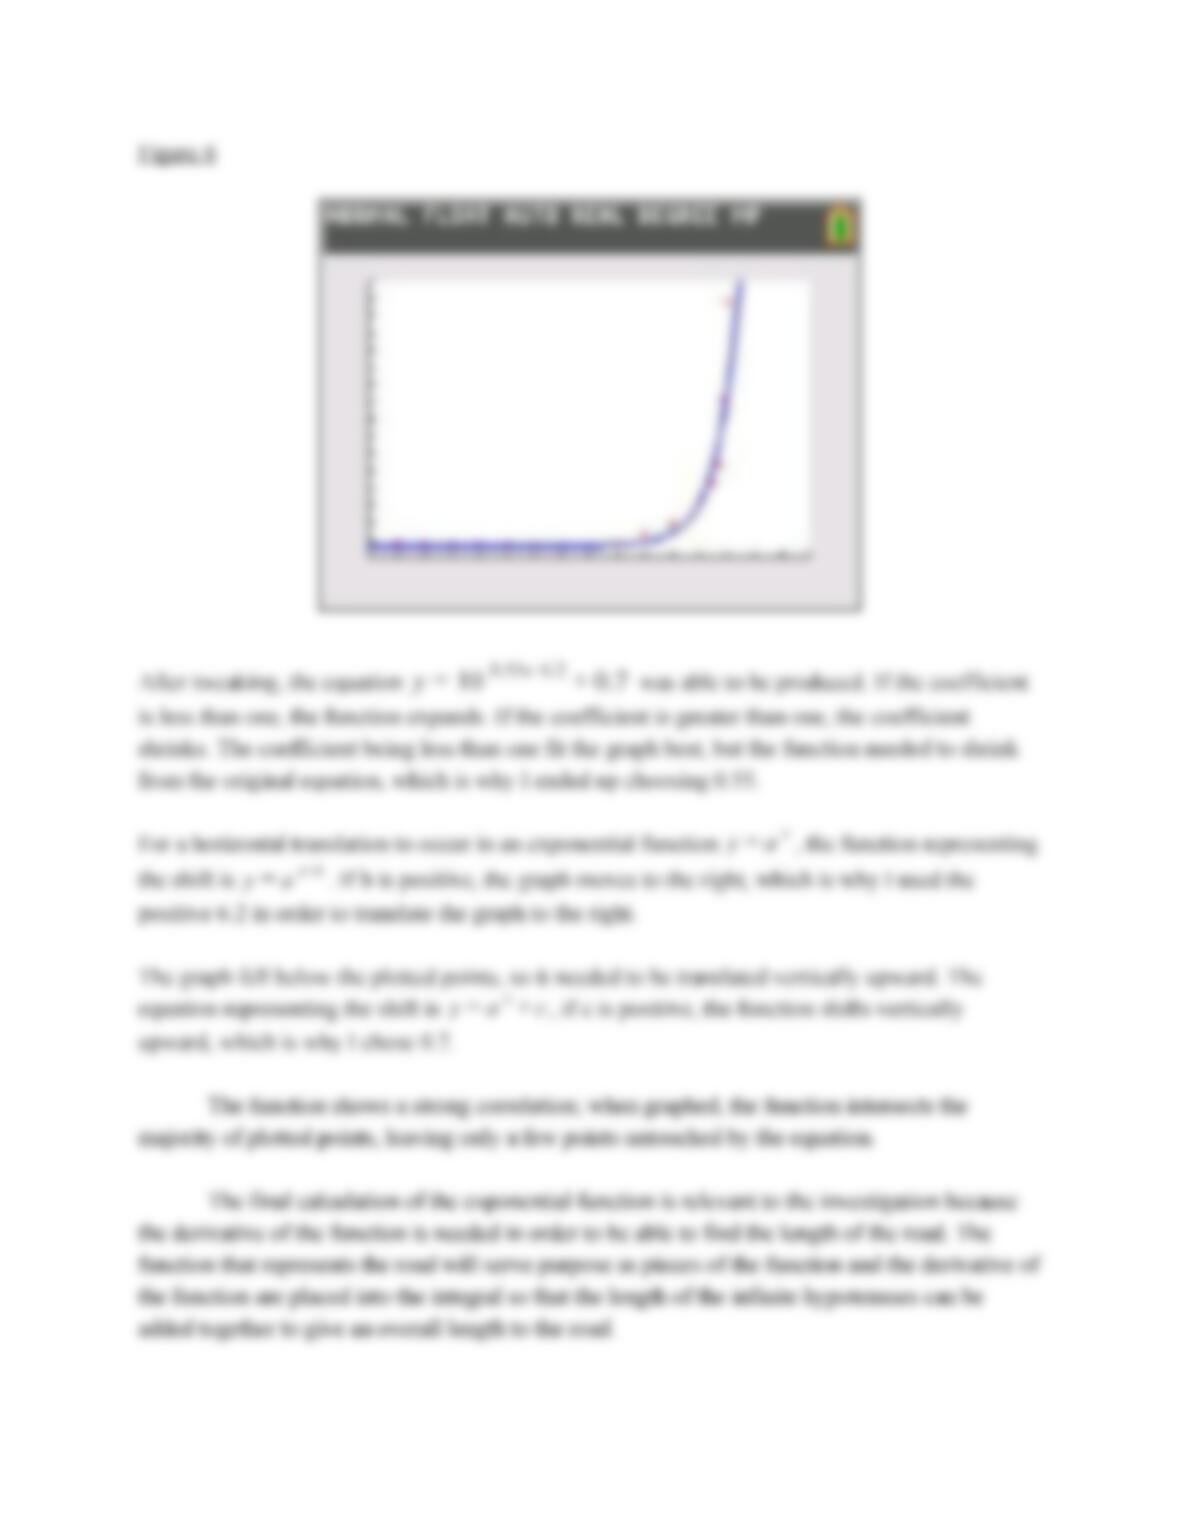
Figure 2
The figure above was modeled by creating a basic graph and
layering over it a screenshot of the street, taken from Google Maps.
I went through a process of trial-and-error while tweaking the
plotted points to fit the graph. These points were then used to create
a table of coordinates, shown to the left, which would be used in the
process of exponential regression. Each increment is worth 185 feet.
A total of sixteen points were plotted between the dimensions of
zero and fourteen on the x-axis corresponding to the dimensions
between zero and fifteen on the y-axis. I decided to include many
points between twelve and thirteen in order to more accurately show
the exponential growth.
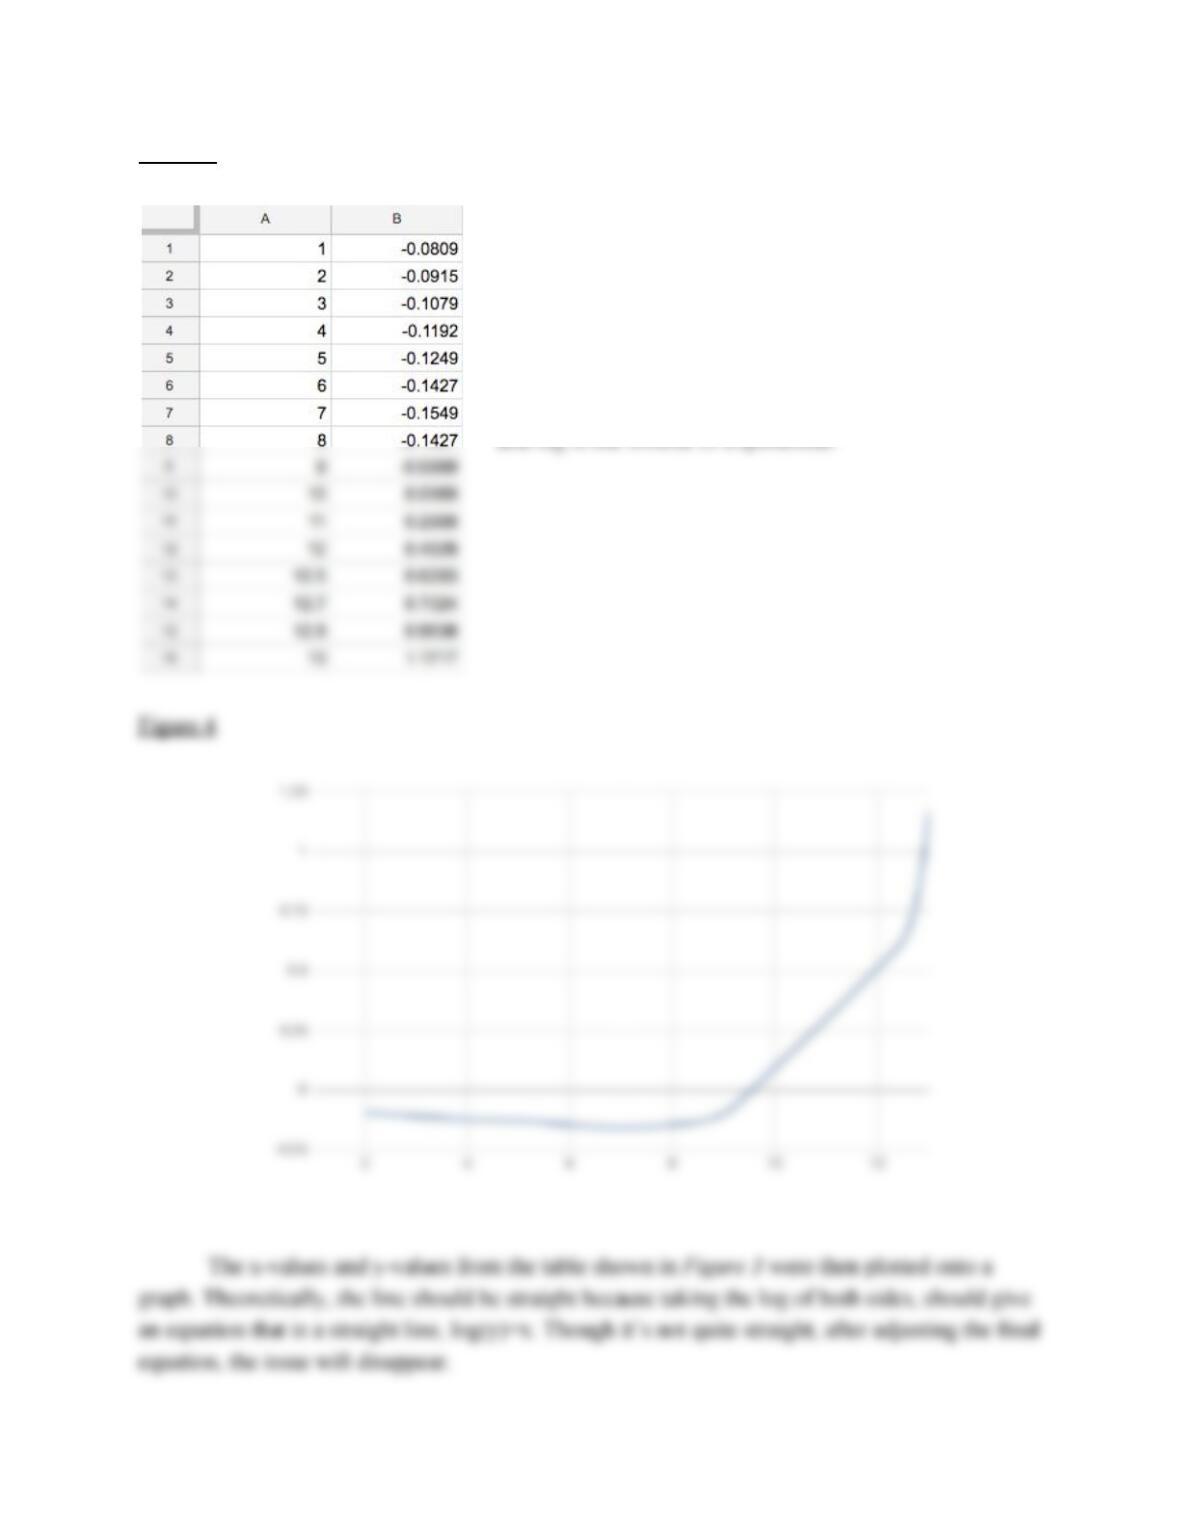
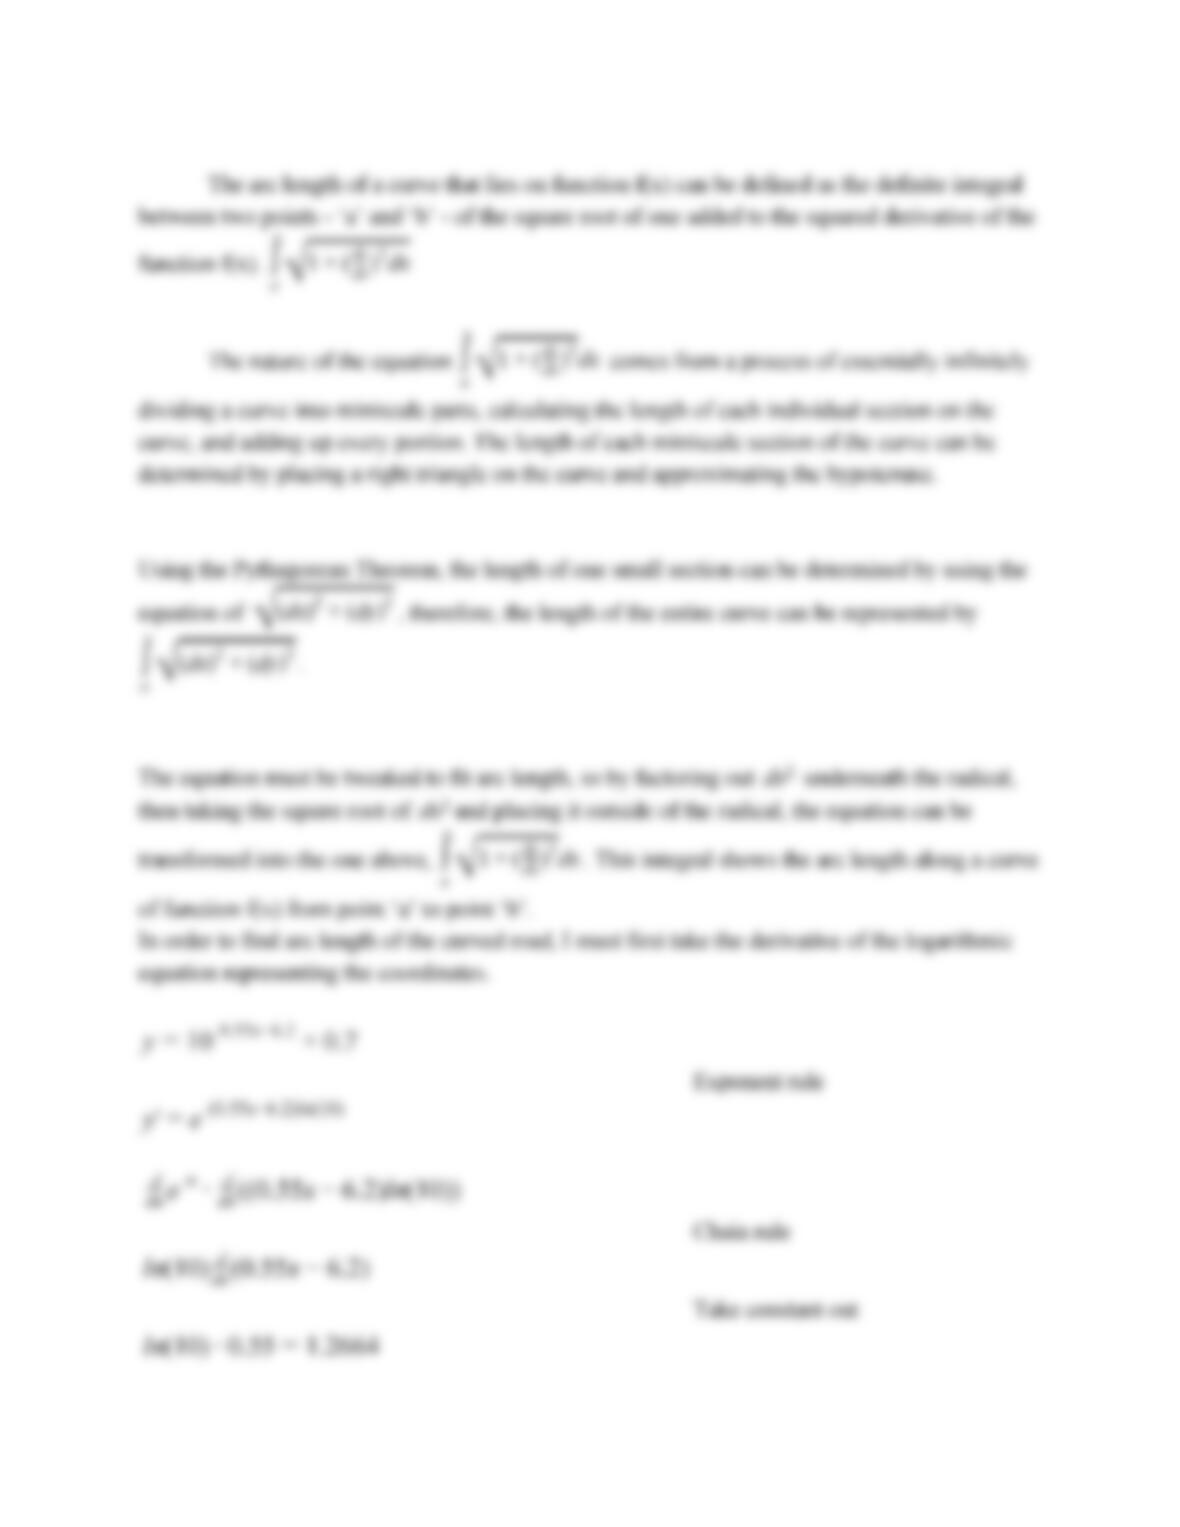
Figure 3
The logarithms from the the y-values from Figure 2
are
shown in the data table to the left.
The logarithms of the y-values were taken because the
data shows an exponential curve in the form of y=10^x,