Comprehending the impact of policy changes on the distribu–
tion of income first requires a good portrayal of that distribution.
ere are various ways to accomplish this, including graphical
and mathematical approaches that range from simplistic to more
intricate methods. All of these can be used to provide a complete
picture of the concentration of income, to compare and rank
dierent income distributions, and to examine the implications
of alternative policy options.
An inequality measure is often a function that ascribes a value
to a specific distribution of income in a way that allows direct and
objective comparisons across dierent distributions. To do this,
inequality measures should have certain properties and behave in
a certain way given certain events. For example, moving $1 from
a richer person to a poorer person should lead to a lower level of
inequality. No single measure can satisfy all properties though, so
the choice of one measure over others involves trade-os. e fol-
lowing measures dier with regards to the properties they satisfy
and information they present. None can be considered superior,
as all are useful given certain contexts. A well-balanced inequal-
ity analysis should look at several of these measures.
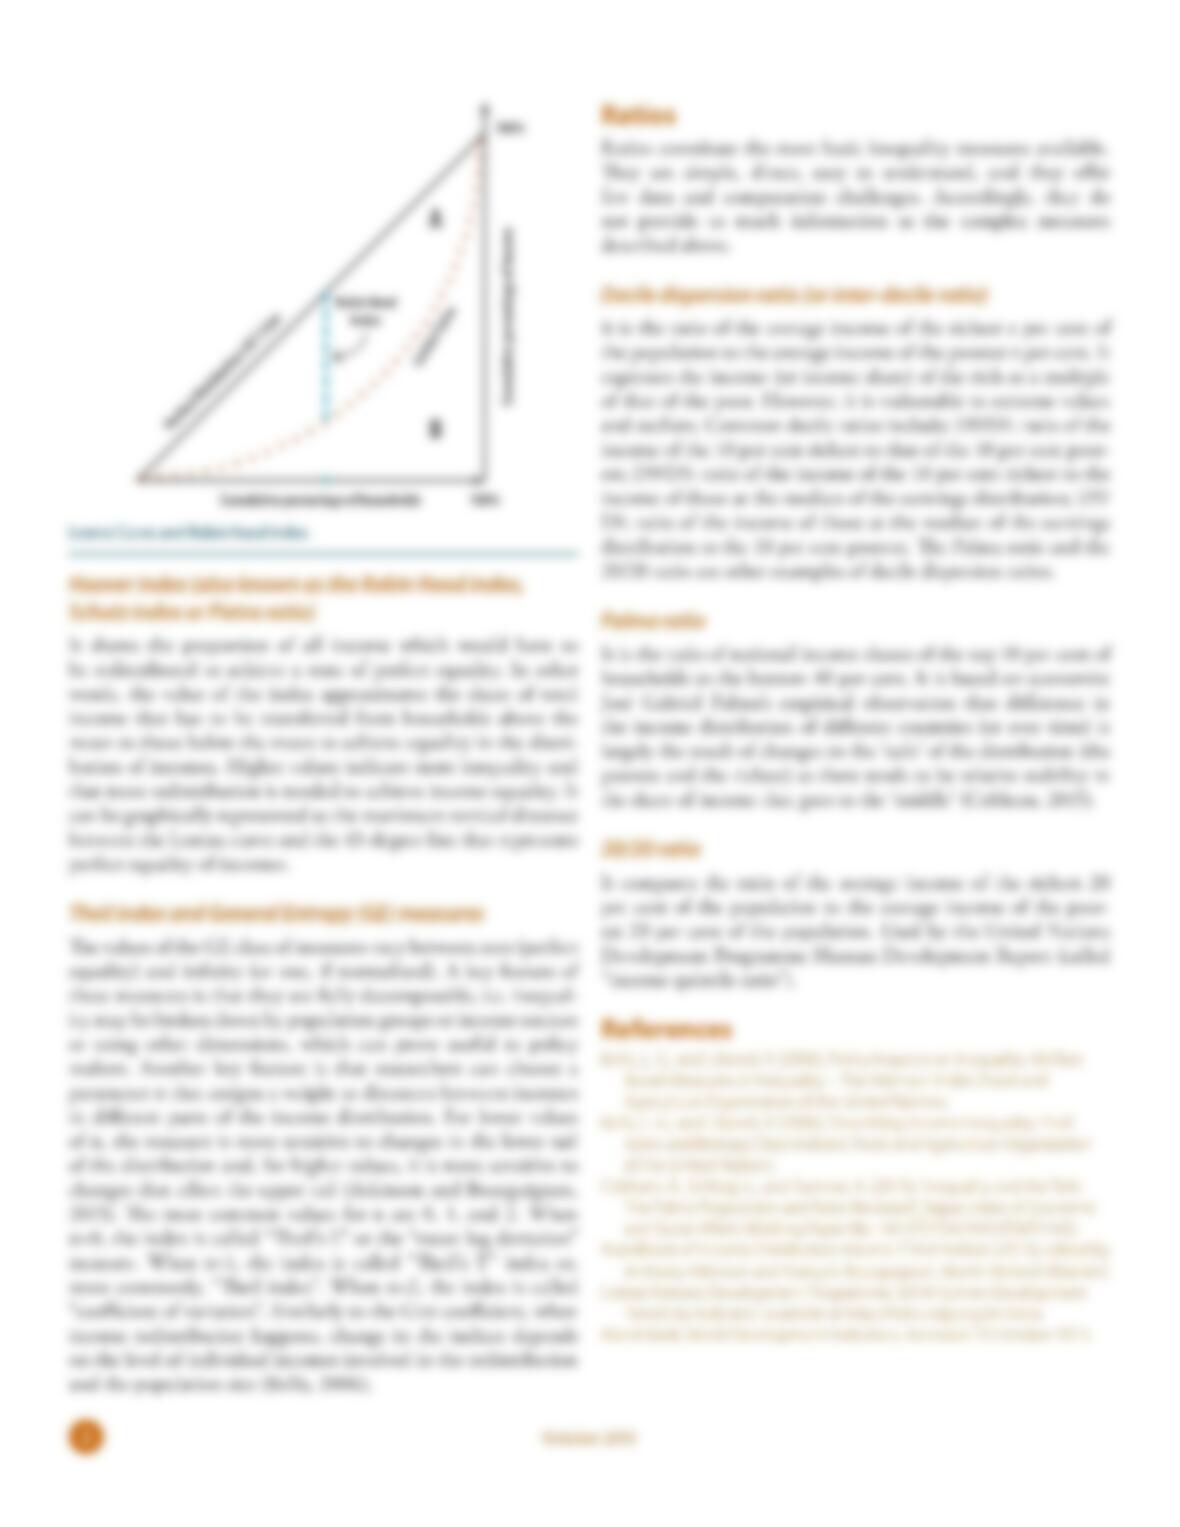
the ratio of the area between the two curves (Lorenz curve and
45-degree line) to the area beneath the 45-degree line. In the
figure above, it is equal to A/(A+B). A higher Gini coecient
represents a more unequal distribution. According to World
Bank data, between 1981 and 2013, the Gini index ranged
between 0.3 and 0.6 worldwide. e coecient allows direct
comparison of two populations’ income distribution, regardless
of their sizes. e Gini’s main limitation is that it is not easily
decomposable or additive. Also, it does not respond in the same
Development Strategy and Policy Analysis Unit w Development Policy and Analysis Division
Department of Economic and Social Affairs
Inequality Measurement
Development Issues No. 2
Summary
There are many measures of inequality that, when
combined, provide nuance and depth to our understanding
of how income is distributed. Choosing which measure to
use requires understanding the strengths and weaknesses
of each, and how they can complement each other to
provide a complete picture.
21 October 2015