PART II: THE ANALYTICAL
TOOL (PERT)
2.3. Tools and techniques for business
planning: PERT
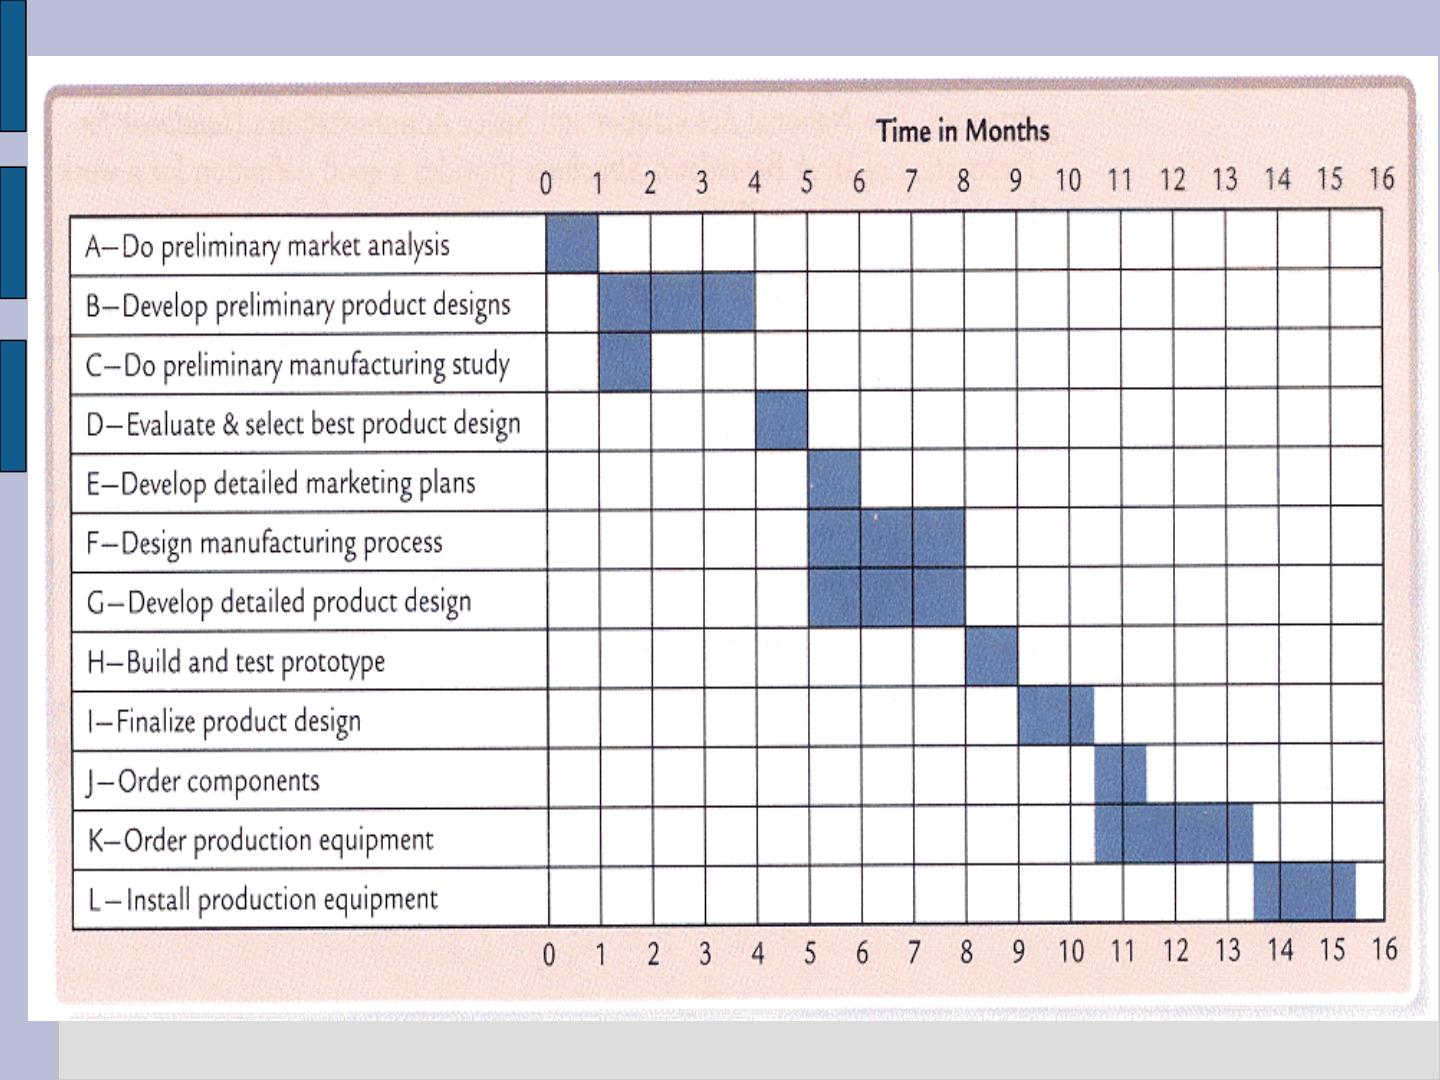
Planning and Gantt charts
2.3.1. PERT – introduction of the basics common for CPM,
PERT–TIME, PERT-COST
Historical background
PERT = Program Evaluation and Review Technique
In 1957, Polaris, managed to optimise the used time in its
missiles thanks to the PERT tool. Initially, this project was
planed to be completed in 5 years. The PERT, allowed to
complete it in 2.
Also in 1958, Du Pont created a similar technique. The
CPM = critical path method. The CPM was developed by
the engineer J.E Kelley, introduced the element ‘cost’. The
result was the PERT, which can be seen as project
programming at minimum cost.
Concept
The PERT method, is an informative tool for decision making. It
involves planning, programming and control of projects.
It is a convenient tool for large projects. For example, for
architecture-related projects. As larger projects need to manage a
wide scope in terms of plans. And this requires to coordinate a
large number of activities that must go in an optimising order.
The main goals of the PERT method, are to define the estimated
duration of a project. Also, to identify the ‘critical activities’.
Meaning, those that need to be controlled in deep. (If this activities
get delayed, the total execution of the project will get delayed too).
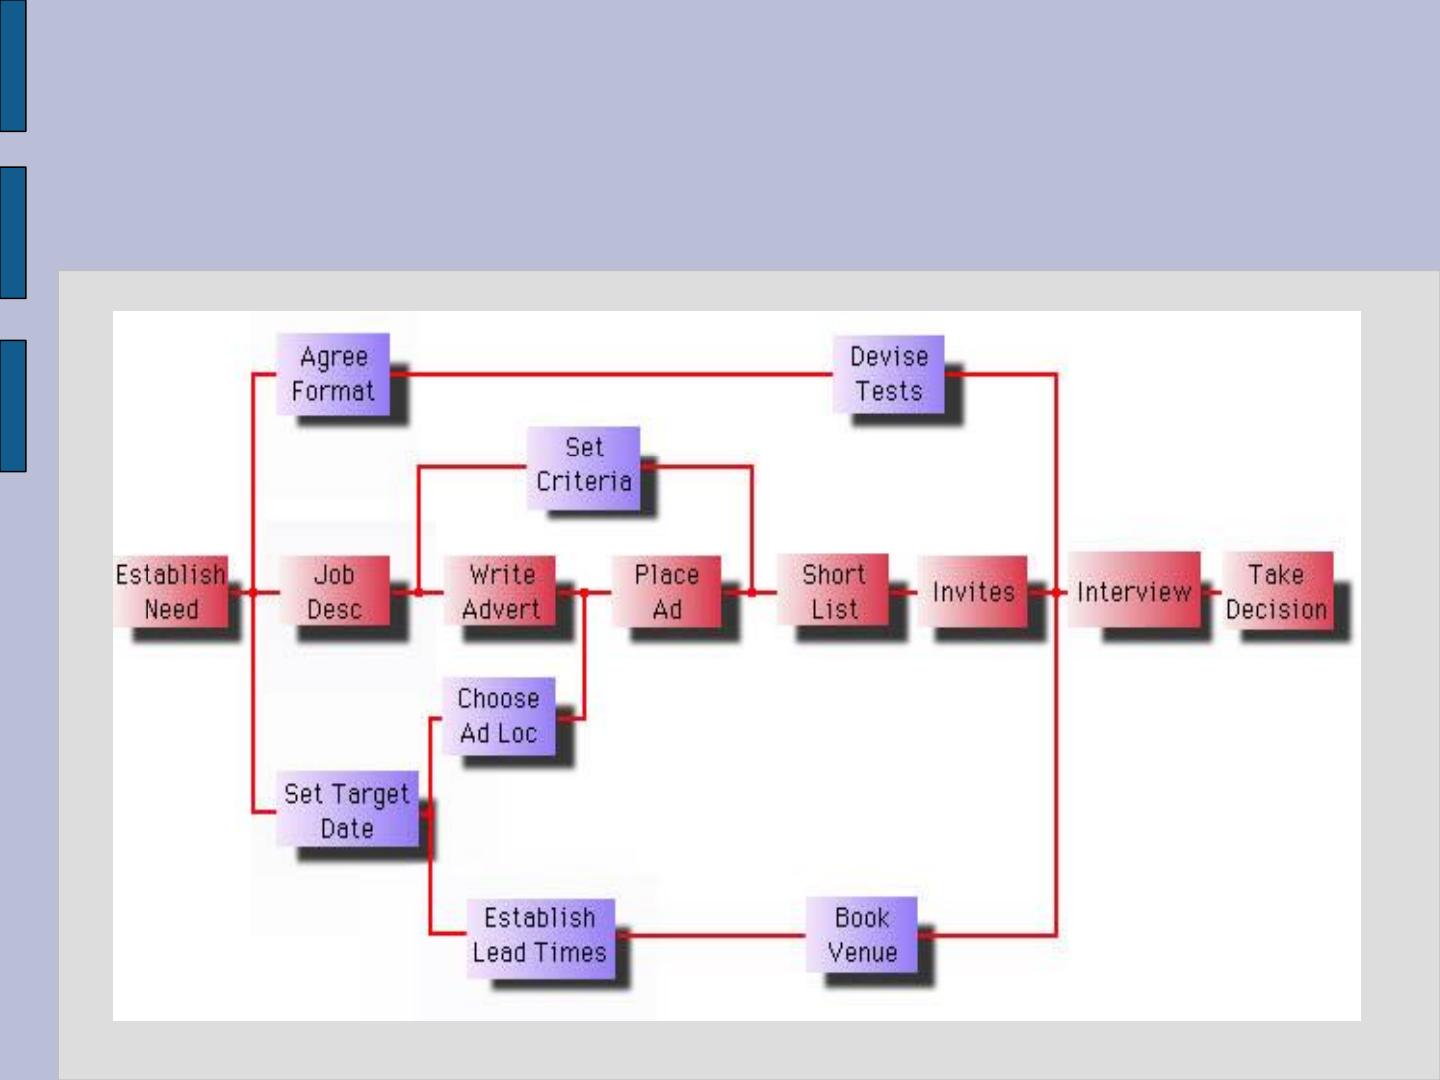
Theoretical example 1:
recruitment process for a new
marketing assistant
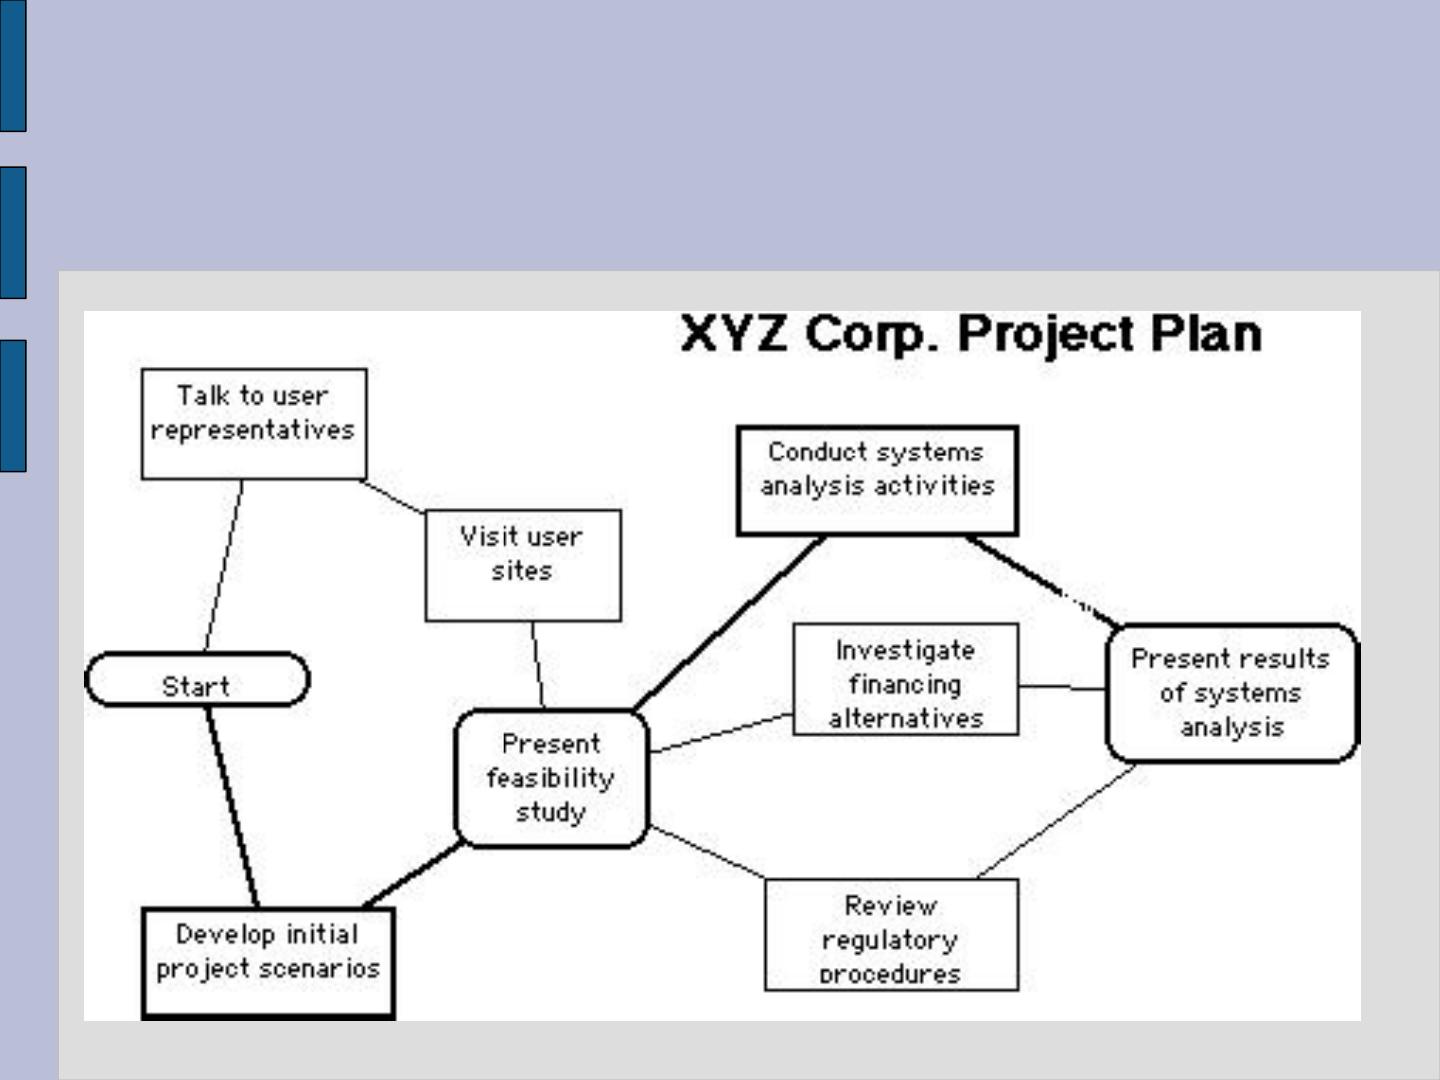
Theoretical example 1:
Development of new software in an
R+D department
DANONE is planning to introduce fat-free products in the South African market.
The following sub-goals or phases have been identified:
Stage A: to study the South-African population (2 months).
Stage B: to study the legal framework (1 month).
Stage C: to study the competence (1,5 months).
Stage D: to get contacts with the South-African organisations (2 months).
Stage E: to contact with particular export and import organisations (4 months).
Stage F: to train the employees that will be send to South-Africa (9 months).
Stage G: to reach for a physical space to settle the company (0,5 months).
TOTAL time: 20 months.
2.3.2. PERT- CPM:
Example 1: DANONE launching in South Africa
So… why would we need a tool for managing this
project?
If we perform one activity only after finishing another
one, we would need 20 months to finalise the project.
The PERT tool offers the possibility to undertake the
activities in parallel so that it is possible to reduce the
time employed.
As a result…we get an informational graph useful for
giving priority to the set of activities.
In our example…
Stage A: to study the South African population (2 months).
Stage B: to study the legal framework (1 month).
Stage C: to study the competence (1,5 months).
Stage D: to get contacts with the South African organizations (2 months).
Stage E: to contact with particular export and import organizations (4 months).
Stage F: to train the employees that will be send to South Africa (9 months).
Stage G: to reach for a physical space to settle the company (0,5 months).
(TOTAL time: 20 months)
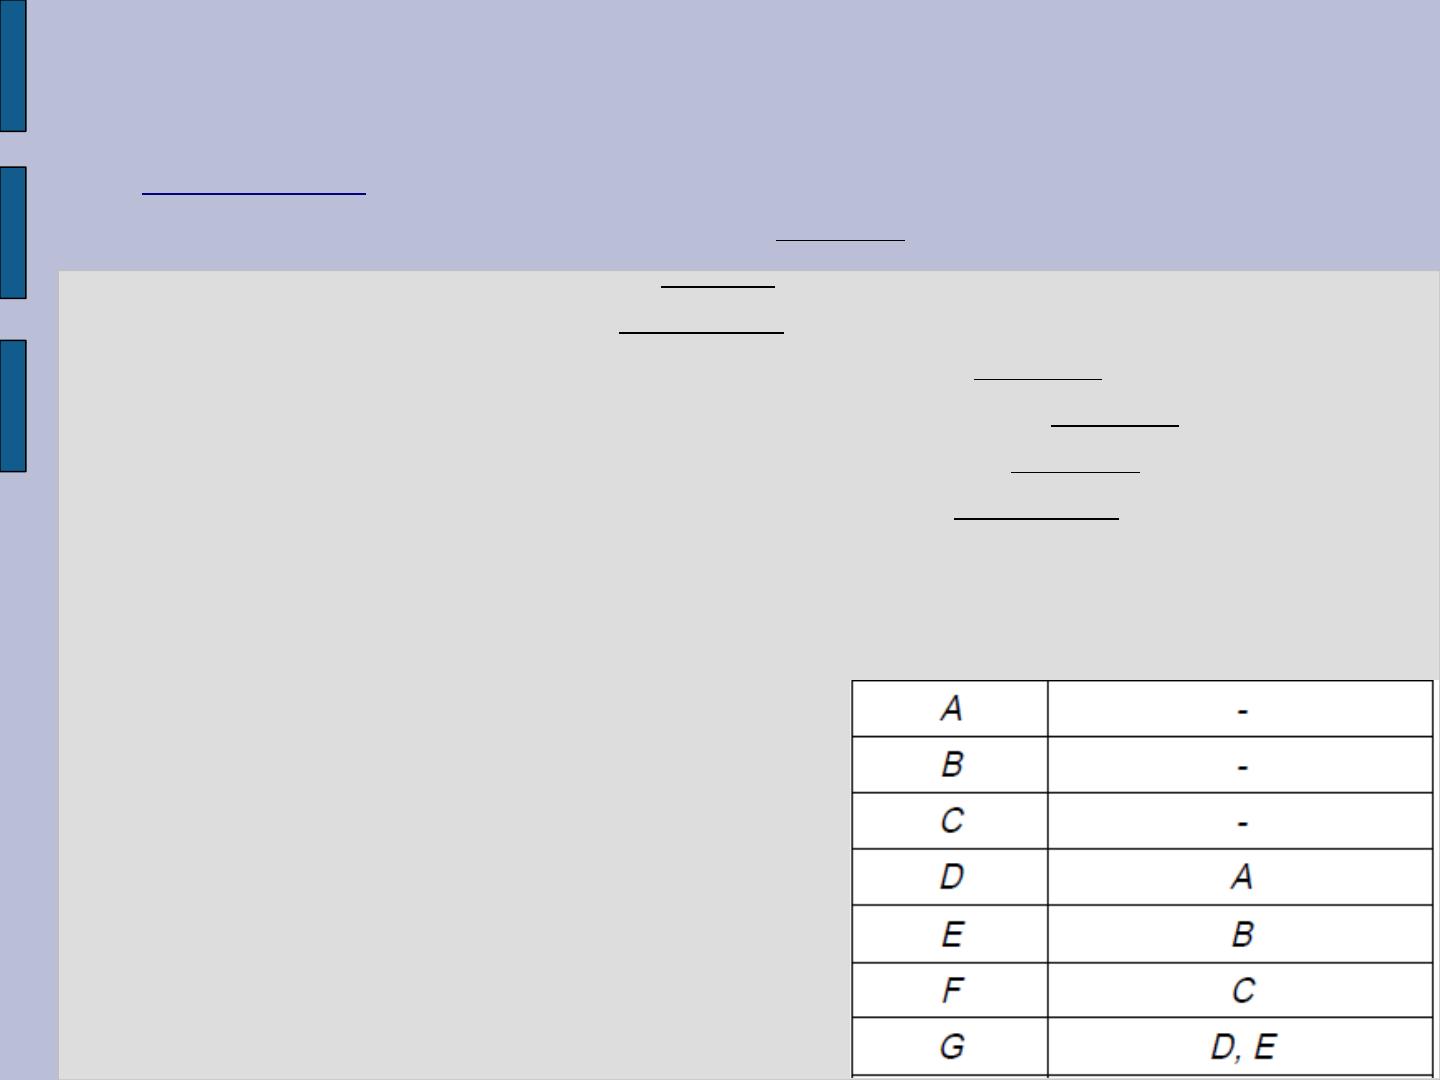
Which activities should be followed by another?
(We must set ‘intuitive’ relationships)
1) PERT-CPM: A systematic tool that gives information for decision
making.
–It involves three parts:
–a) planning: to decompose the project in different activities (A;B;C…)
–b) programming: to set the estimated time for developing an activity
–c) control:
–c-1) To use the diagram for written reports: in our examples, we will
be looking at static examples. In the real world, the actual progress
of a project will modify the chart.
–c-2) To understand ‘critical tasks’. (Will be those part of the ‘critical
path’).
–Key concepts:
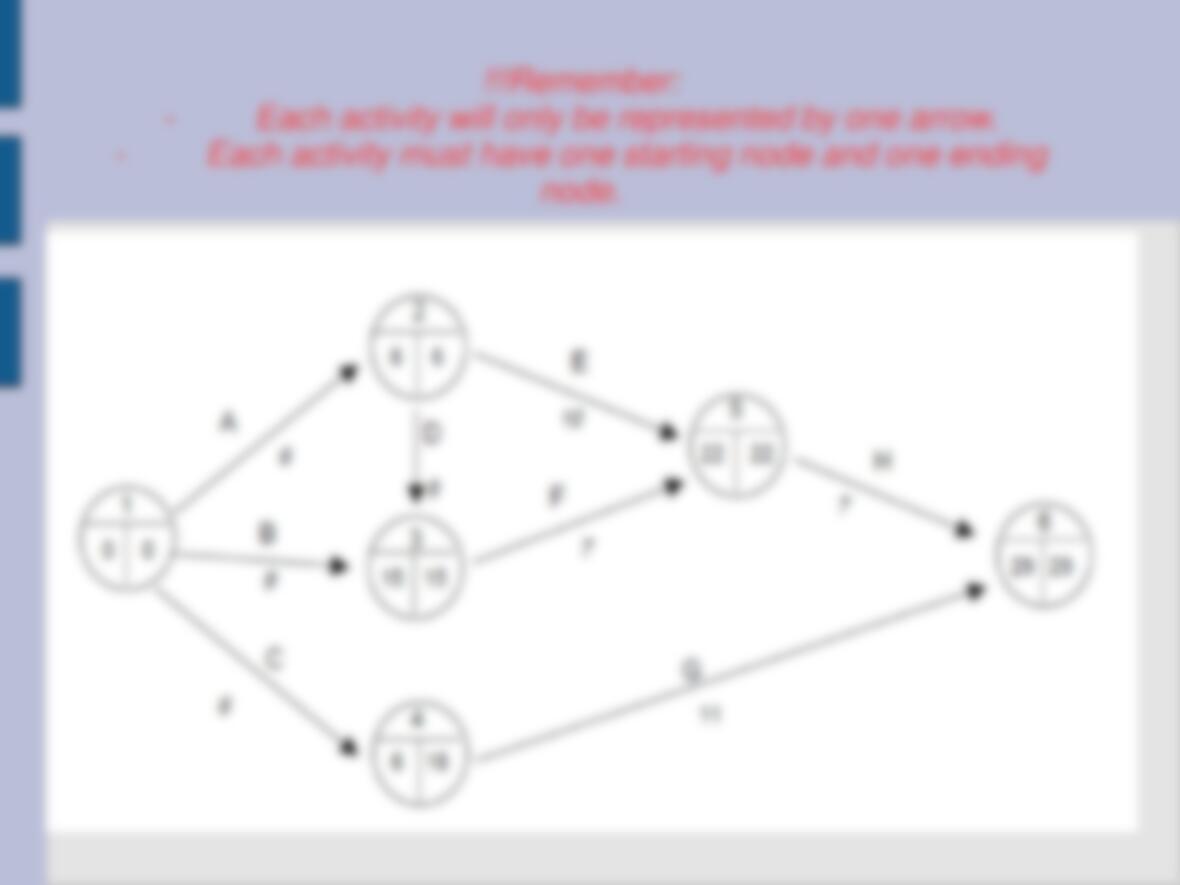
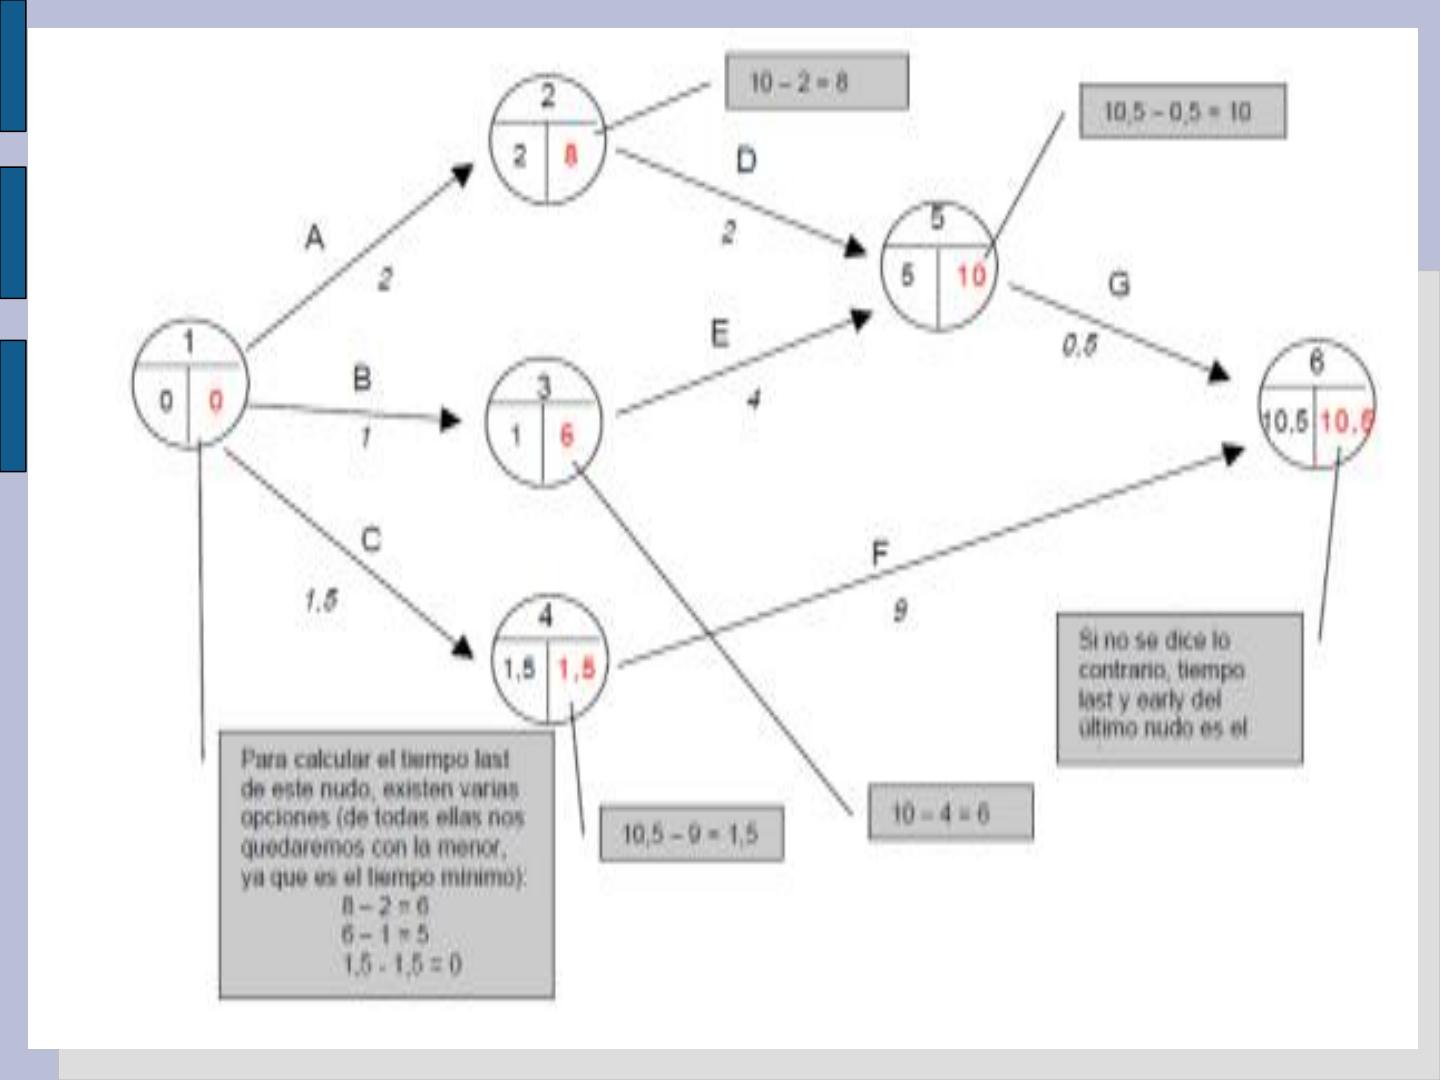
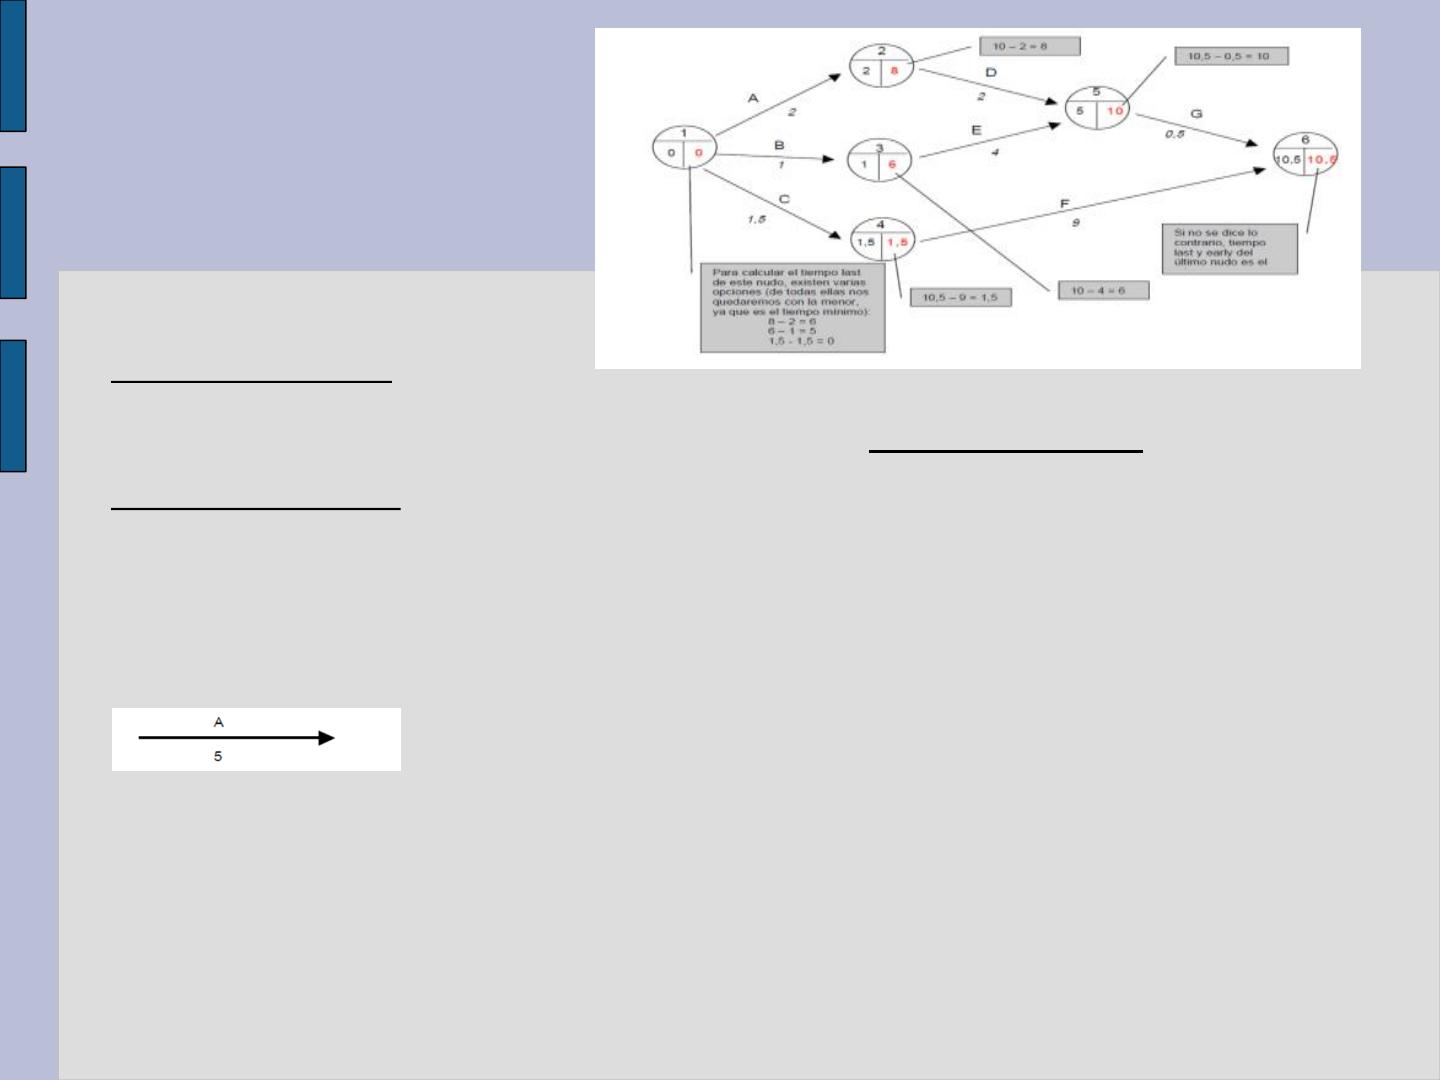
–The diagram: basically represents the relationships
of precedence. So, which activities can’t start until
previous ones have ended. I.e.: It is not possible to
train the employees before analysing the competence.
–Activity: represents the consumption of a resource.
–-> Meaning: the activity A needs 5
months to be completed
–! Each activity will have its own start and end.
–! Each activity can be represented only by an arrow.
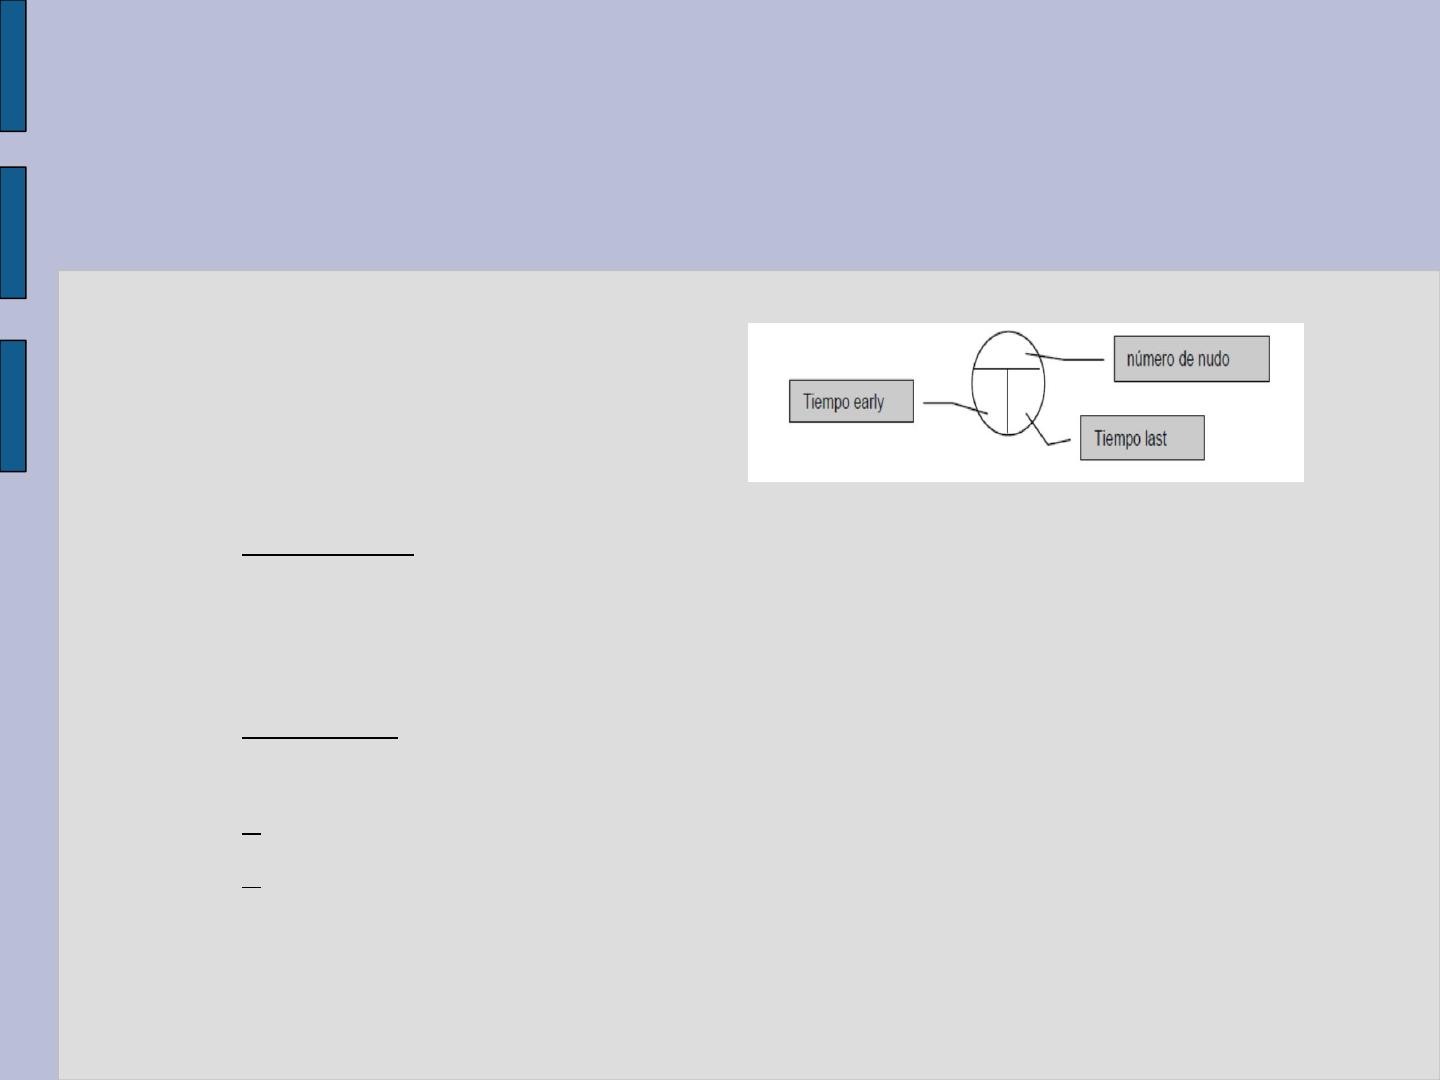
Node: represents and event. We can understand the event as
the point of starting, ending an activity or both.
Elements of the node:
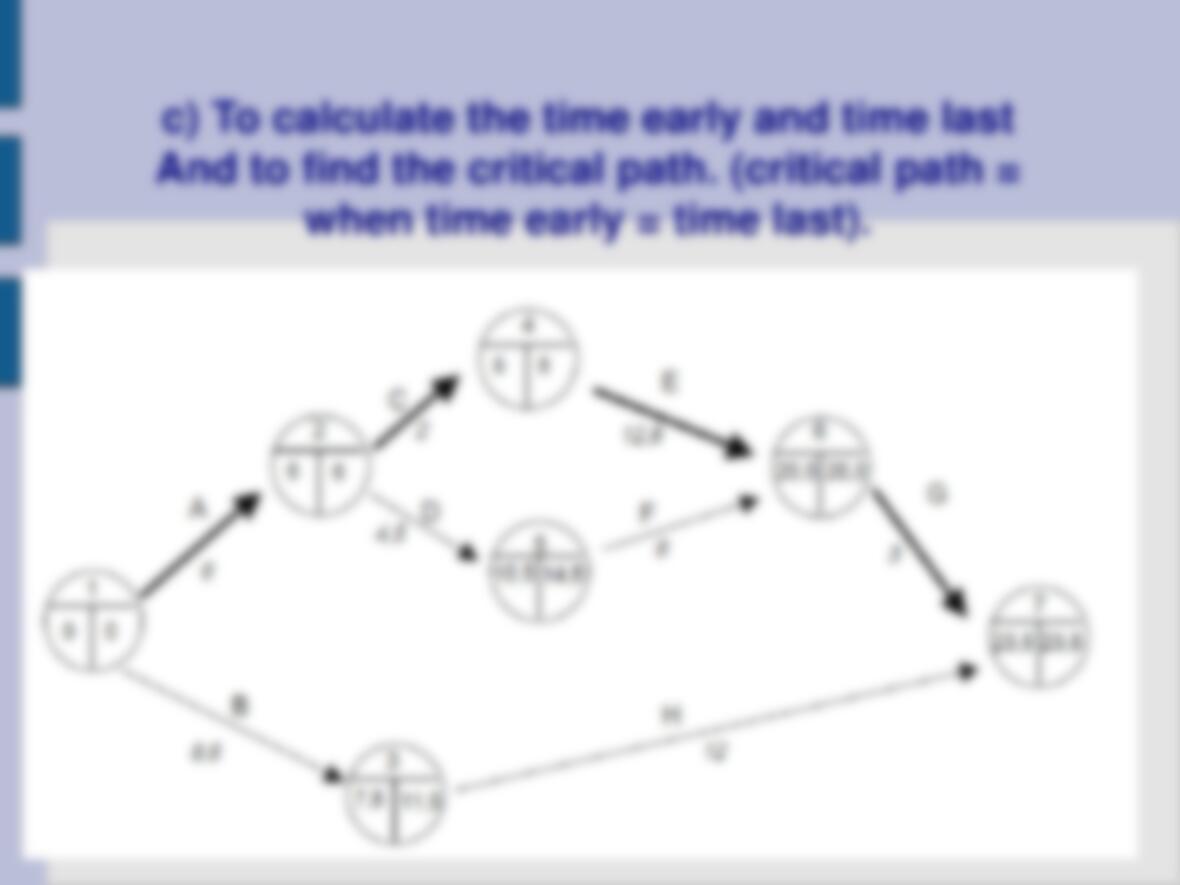
Time early. Means the minimum amount of time in which is possible to go
to the next step. ‘Meaning’: if a node involves the element of three
activities, the time early will be represent the time needed to wait until all
the activities are completed.
Time last. Represents the maximum time that we can employ in a particular
activity without delaying the whole process.
! At the last node: time early=time last
! At the first node: time early=time last = 0
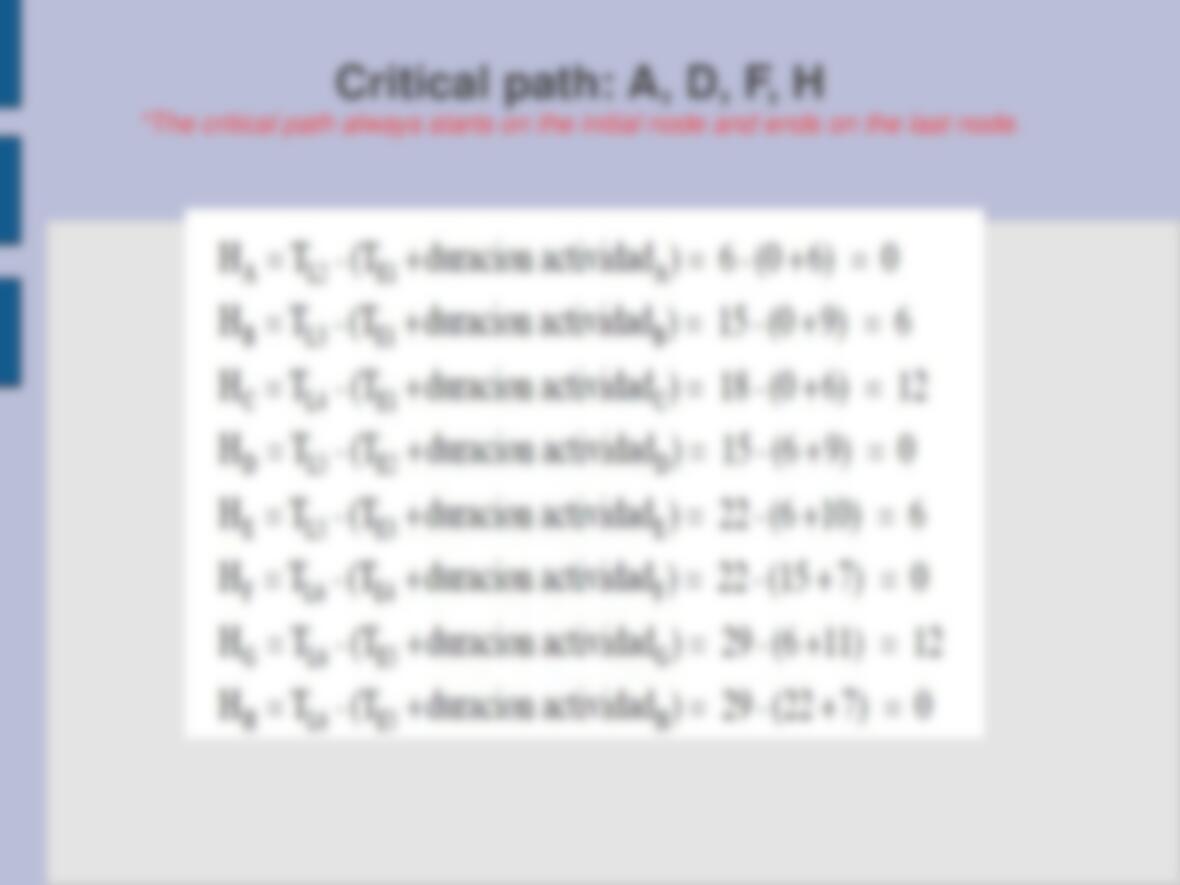
The critical path (CPM): indicates those activities that should be under strict
control, as if they get delayed, the whole process will get delayed too.
Differences between the time last and the time early, can give information
about two situations:
– If Te < Tl : indicates that there is a certain margin just in case
something unexpected occurs and the activity gets delayed.