Rachael Becker
Biology II Lab
Section 48
Week 10 Stomata Lab
Post Lab
In this lab, the number of open stomata, from plants that had been sitting out in light
and plants that had been sitting in the dark, was counted and recorded. When recording data,
1200 total stomata were counted (100 stomata for each trial of three plants in four different
conditions), making the sample size n=600. The average stomata were then calculated for each
time interval, and data was put together into graphs that can be found on page 3 (see Graphs 1
and 2).
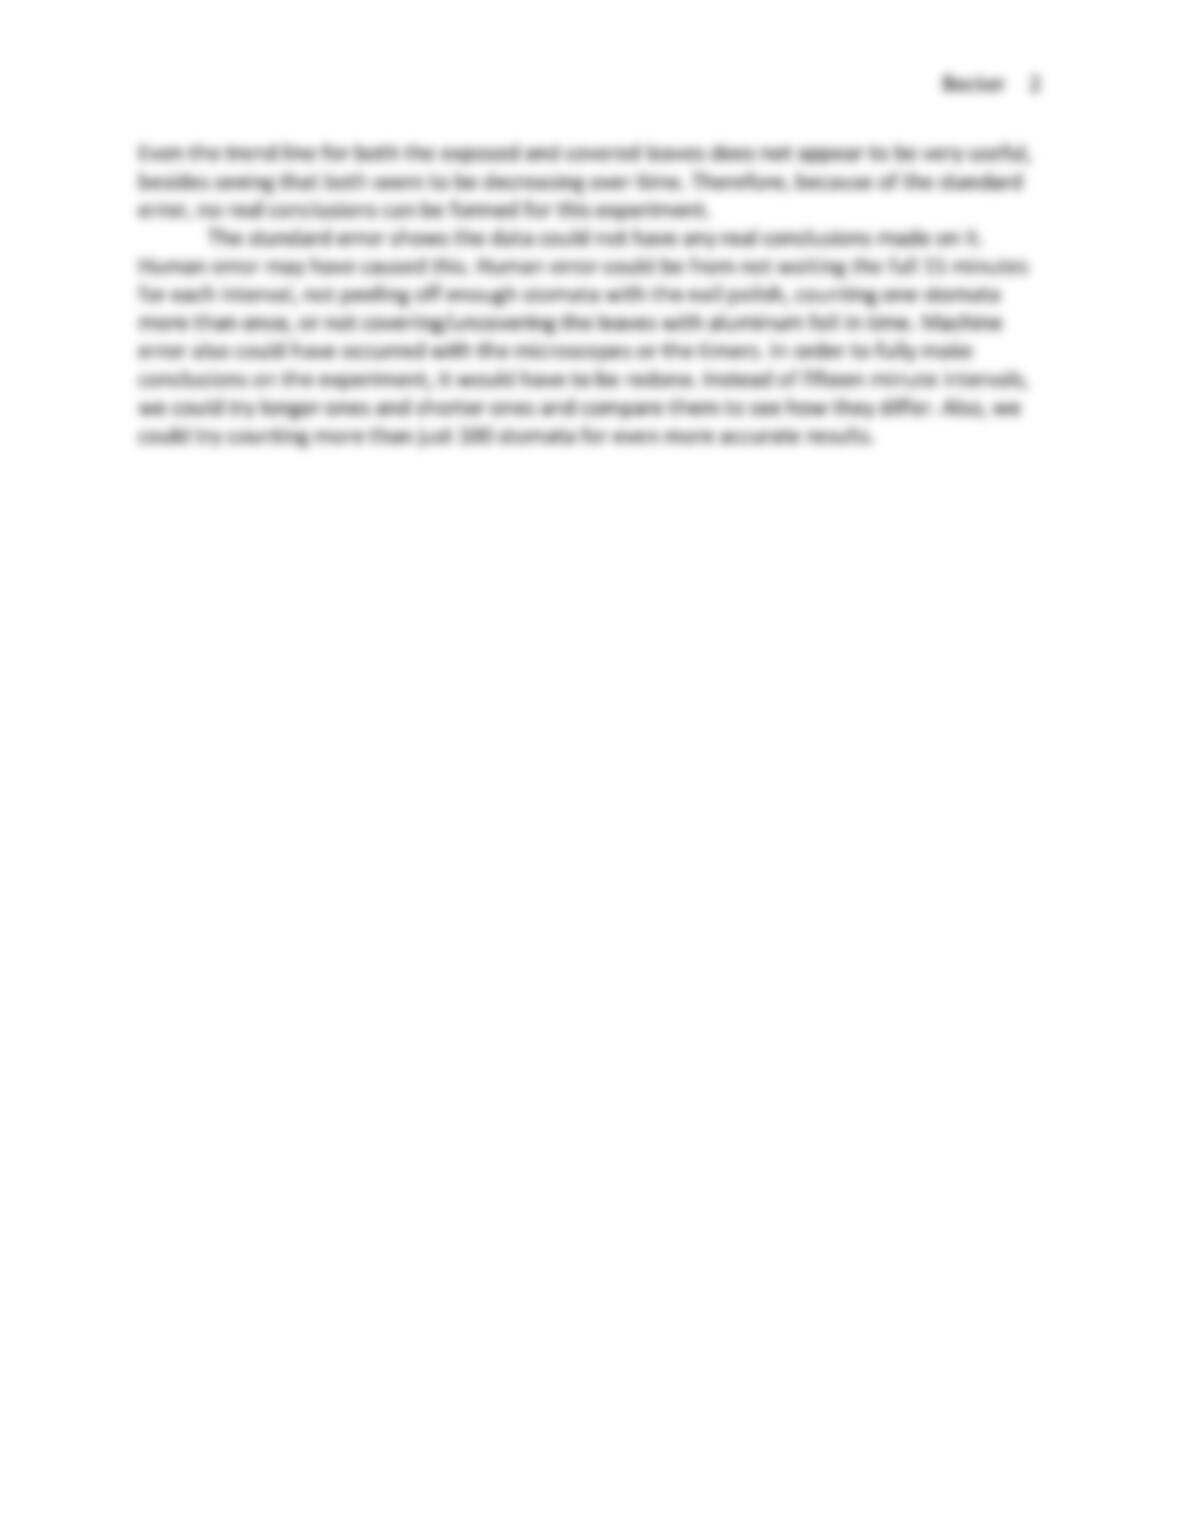
When recording data for Graph 1, with plants sitting in the dark, some leaves were
covered in foil while some were immediately exposed to light. The initial amount of open
stomata (out of the first 100 stomata counted) was recorded for an exposed leaf. Then, after 15
minute intervals of sitting in the light (or covered in foil), the first 100 stomata were seen and
recorded as either open or closed for one leaf wrapped in foil and another exposed to light.
Data was collected for an hour, then pooled together from the class, averaged, and made into
Graph 1. A trend line was used to show the prevailing direction the data was going.
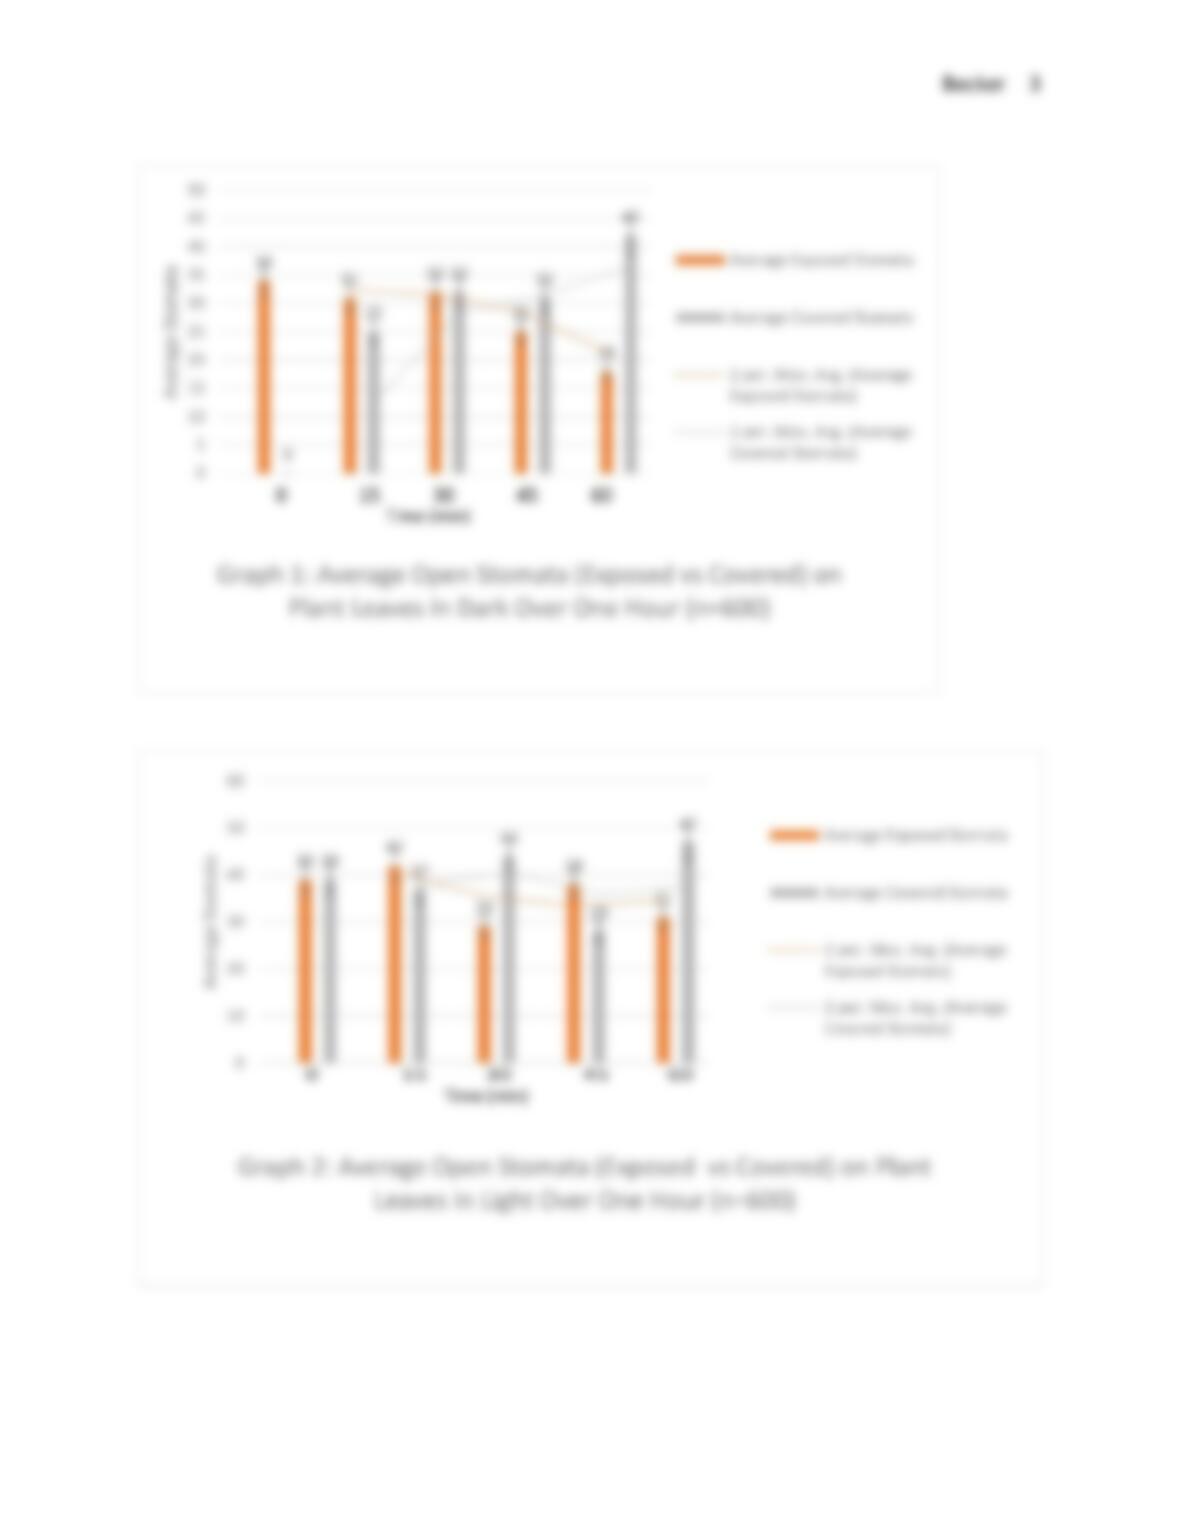
When recording data for Graph 2, with plants that had been exposed to only light for
some time, some leaves were immediately covered in foil while others left exposed. An
exposed leaf was picked at random, and open stomata were recorded (from the first 100
stomata seen and counted). Then, in 15 minute intervals, stomata were counted and recorded