Copyright 2013-2014
Case Study Analysis :
Bill French
Based on Break Even Point
Presented By:-
Himanshu Arya (501504014)
Tanisha Sharda (401207028)
Rajat Batra (501504028)
Avni Sharma (501504016)
Gurbaaj Randhawa (501504027)

Copyright 2013-2014
Introduction
•Bill French was a Staff Accountant in Duo-Products Group.
•He used to report directly to his boss, Wes Davidson(Controller).
•He wanted to do use Break-even analysis for the planning procedures,
which was first of its kind for the Duo-Products Group.
•Basically what French had done was to determine the level at which the
company must operate in order to break even.
•As he put it,
1. The company must be able at least to sell a sufficient volume of goods
so that it will cover all the variable costs of producing and selling the
goods.
2. Further, it will not make a profit unless it covers the fixed costs as well.
3. The level of operation at which total costs are just covered is the break–
even volume.
4. This should be the lower limit in the planning.

Copyright 2013-2014
Accounting Records
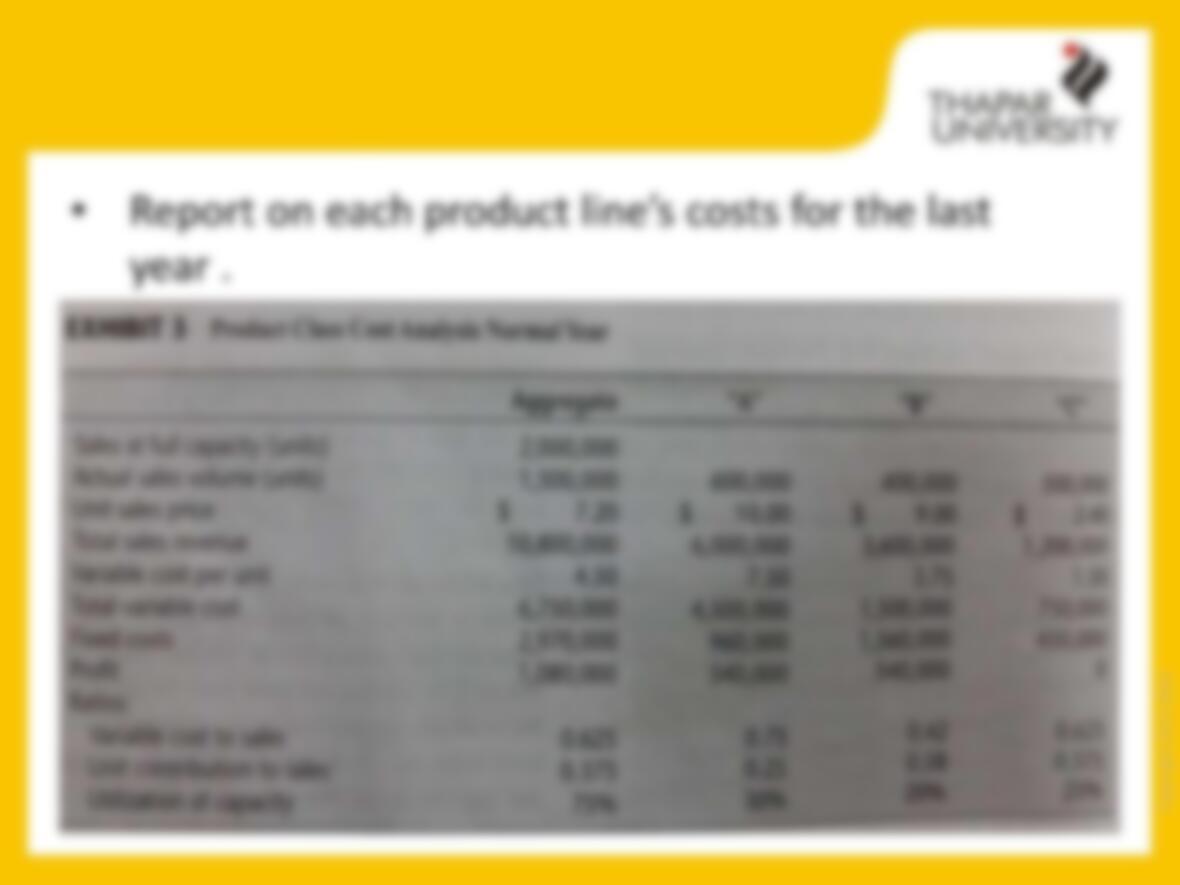
•The accounting records had provided the following information that
French used in constructing his chart:
1. Plant Capacity-2 million units per year.
2. Past year’s level of operations–1.5 million units.
3. Average unit selling price- $7.20.
4. Total fixed costs- $2,970,000.
5. Average unit variable costs- $4.50.
•From the above information, French observed that
1. Each unit contributed $2.70 to fixed costs after covering its variable costs.
2. For break even, unit sold must be 1,100,000.
3. As variable costs per unit is 62.5% of the selling price, French reasoned
that 37.5% of sales left to cover fixed costs.
4. Thus, fixed costs of $2,970,000 required sales of $7,920,000 in order to
break even.
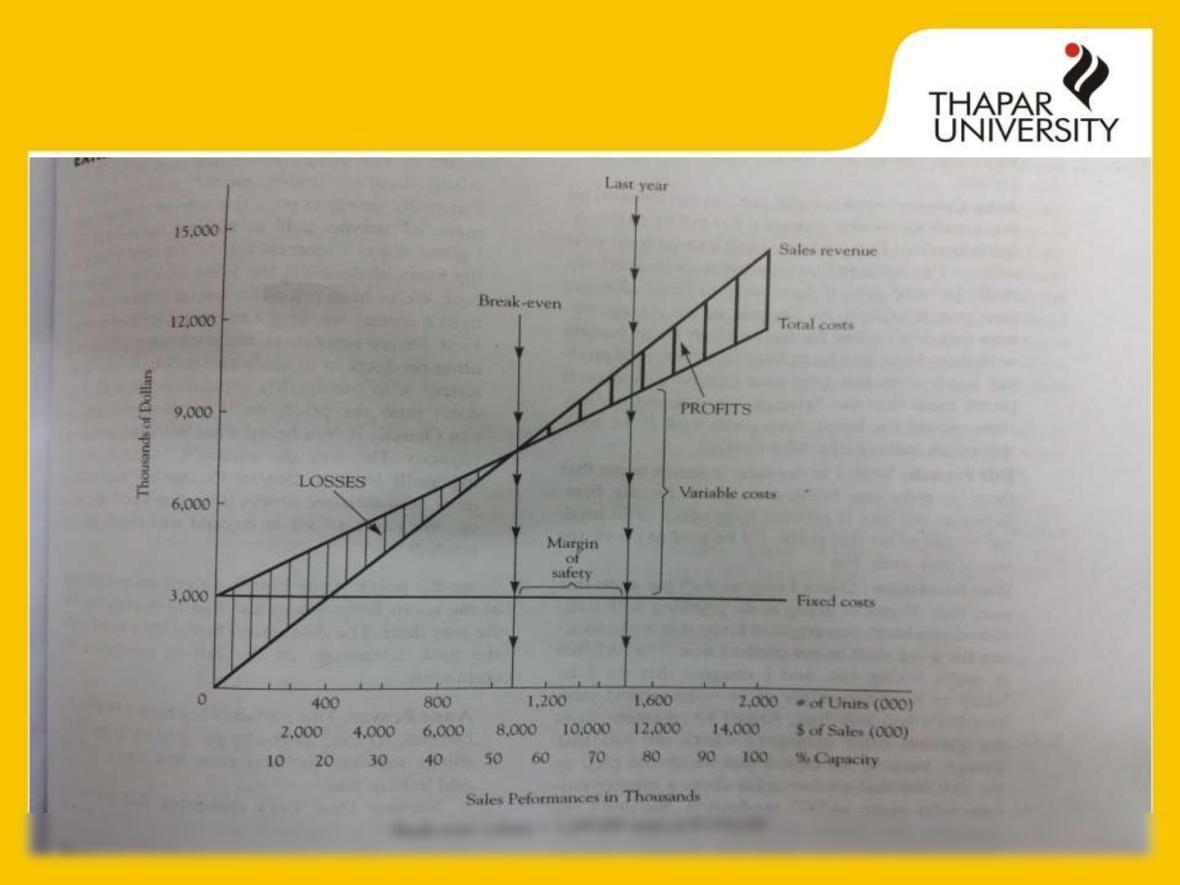
Break-Even Chart