BA (HONS) BUSINESS ADMINISTRATION MANAGEMENT BBA6143 LOGISTICS AND SUPPLY CHAIN MANAGEMENT
0
CONTENT
NO
CONTENT
PAGE
1
INTRODUCTION
1
2
GAME PLAY
a) Strategy employed
b) Result from Decisions
c) Objective
2-5
3
CHALLENGES SURFACED
a) How did we faced and overcome
b) How can be done better
6-9
4
CONCLUSION
10
5
REFERENCES
11
6
ATTACHMENTS/APPENDIX
12-19

BA (HONS) BUSINESS ADMINISTRATION MANAGEMENT BBA6143 LOGISTICS AND SUPPLY CHAIN MANAGEMENT
1
1. INTRODUCTION OF BEER GAME
The beer game is also known as beer distributor game. This is a type of gamification
that is castoff to practice emblematic organization difficulties of a supply chain process. It
reveals a role-play model where members play with each other. The game characterizes a
supply chain with a non-synchronized development problems appear due to deficiency of
material sharing. Due to lack of information, suppliers, manufacturers, sales people and
customers frequently take partial thoughtful of what the real demand of an order is. The most
interesting part of the game is that respected group has no regulator above additional part of
the supply chain. Each group has individual major regulator above their own part of the
supply chain. Each group members action can extremely affect the whole supply chain by
gathering too much or too little which can central to bullwhip consequence. Therefore, the
order taking of a group also extremely based on choices of the other groups.

BA (HONS) BUSINESS ADMINISTRATION MANAGEMENT BBA6143 LOGISTICS AND SUPPLY CHAIN MANAGEMENT
2
2. GAME PLAY
We have well-versed many rounds in game and located it’s tough to manage and
direct. Once vie, it will be compel to arrange and anticipate earlier understanding every
member’s functioning and time taken to method to higher calculate the amount of the raw
materials which will be coming up with. First level is for novice during the shoppers
continues waiting and obtain pissed off once their orders aren’t consummated. While the
second level is for consultants during which customers when obtaining pissed off not sit up
for order fulfillment. After going these rounds, we’ve come upon the answer with minimum
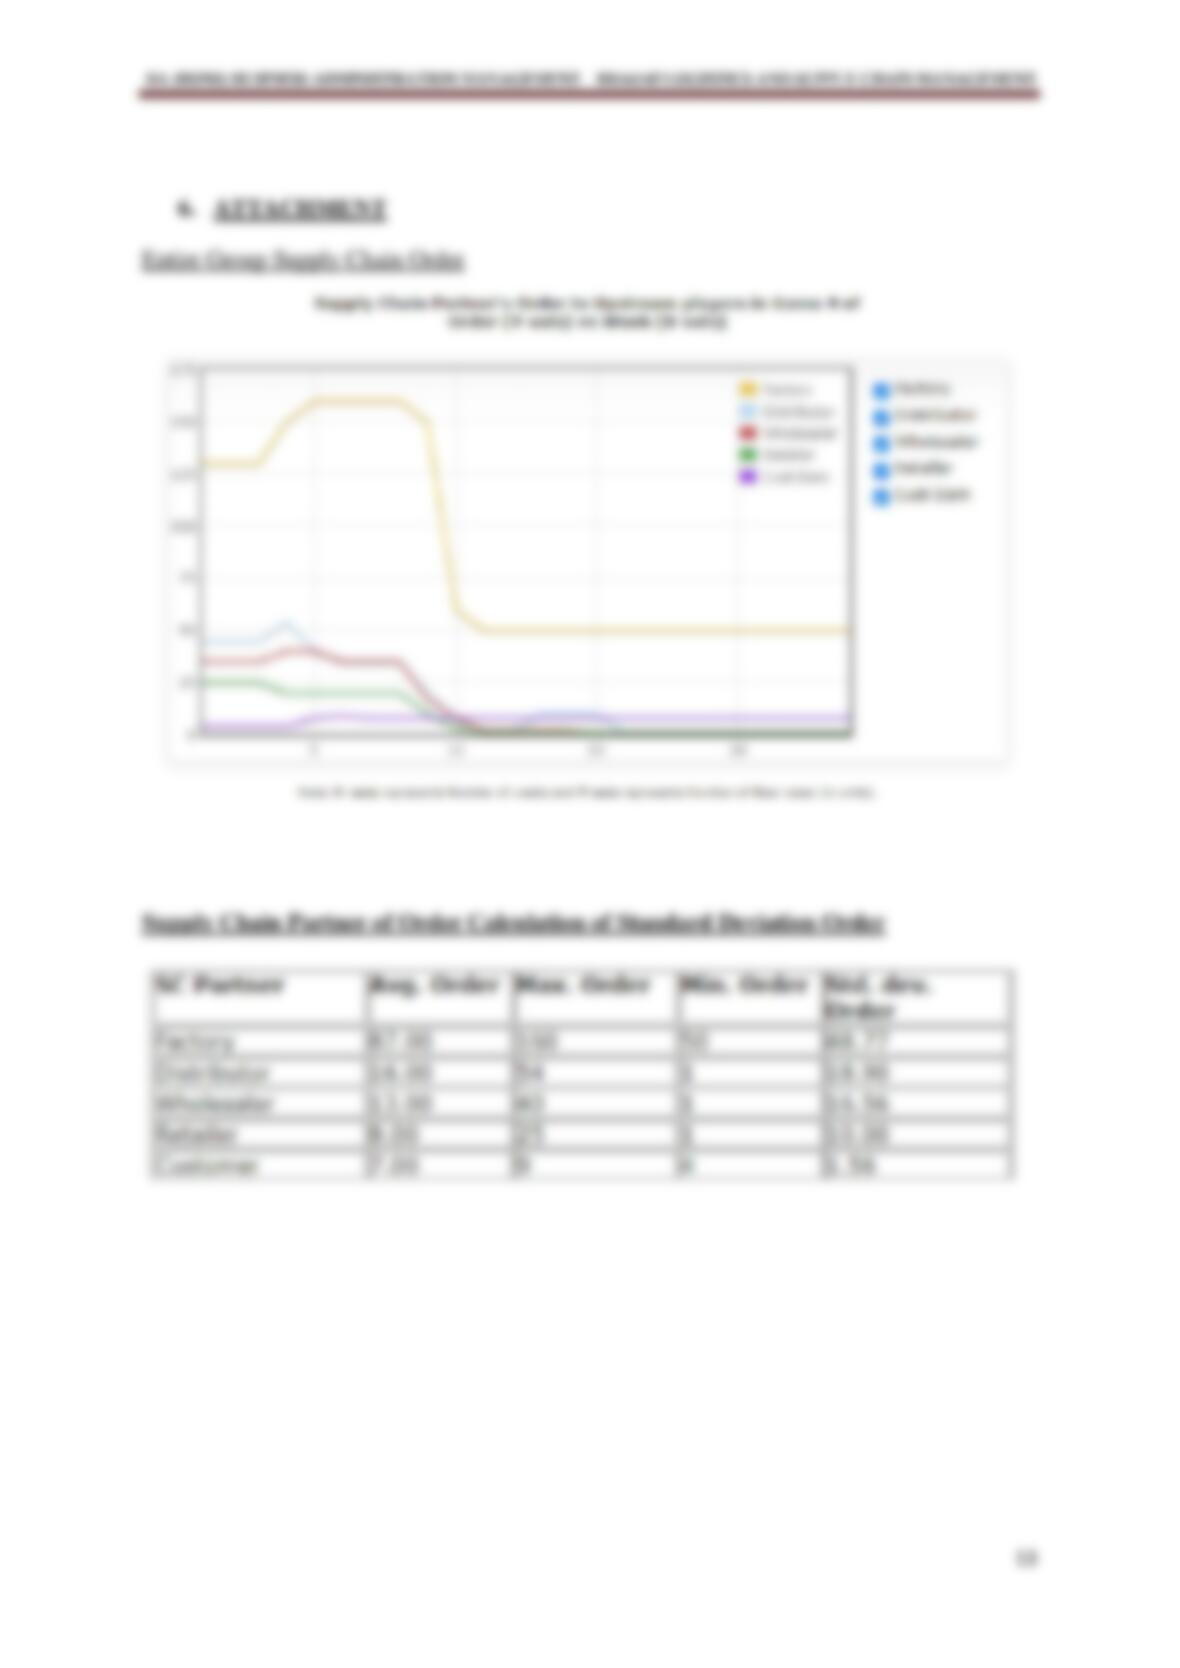
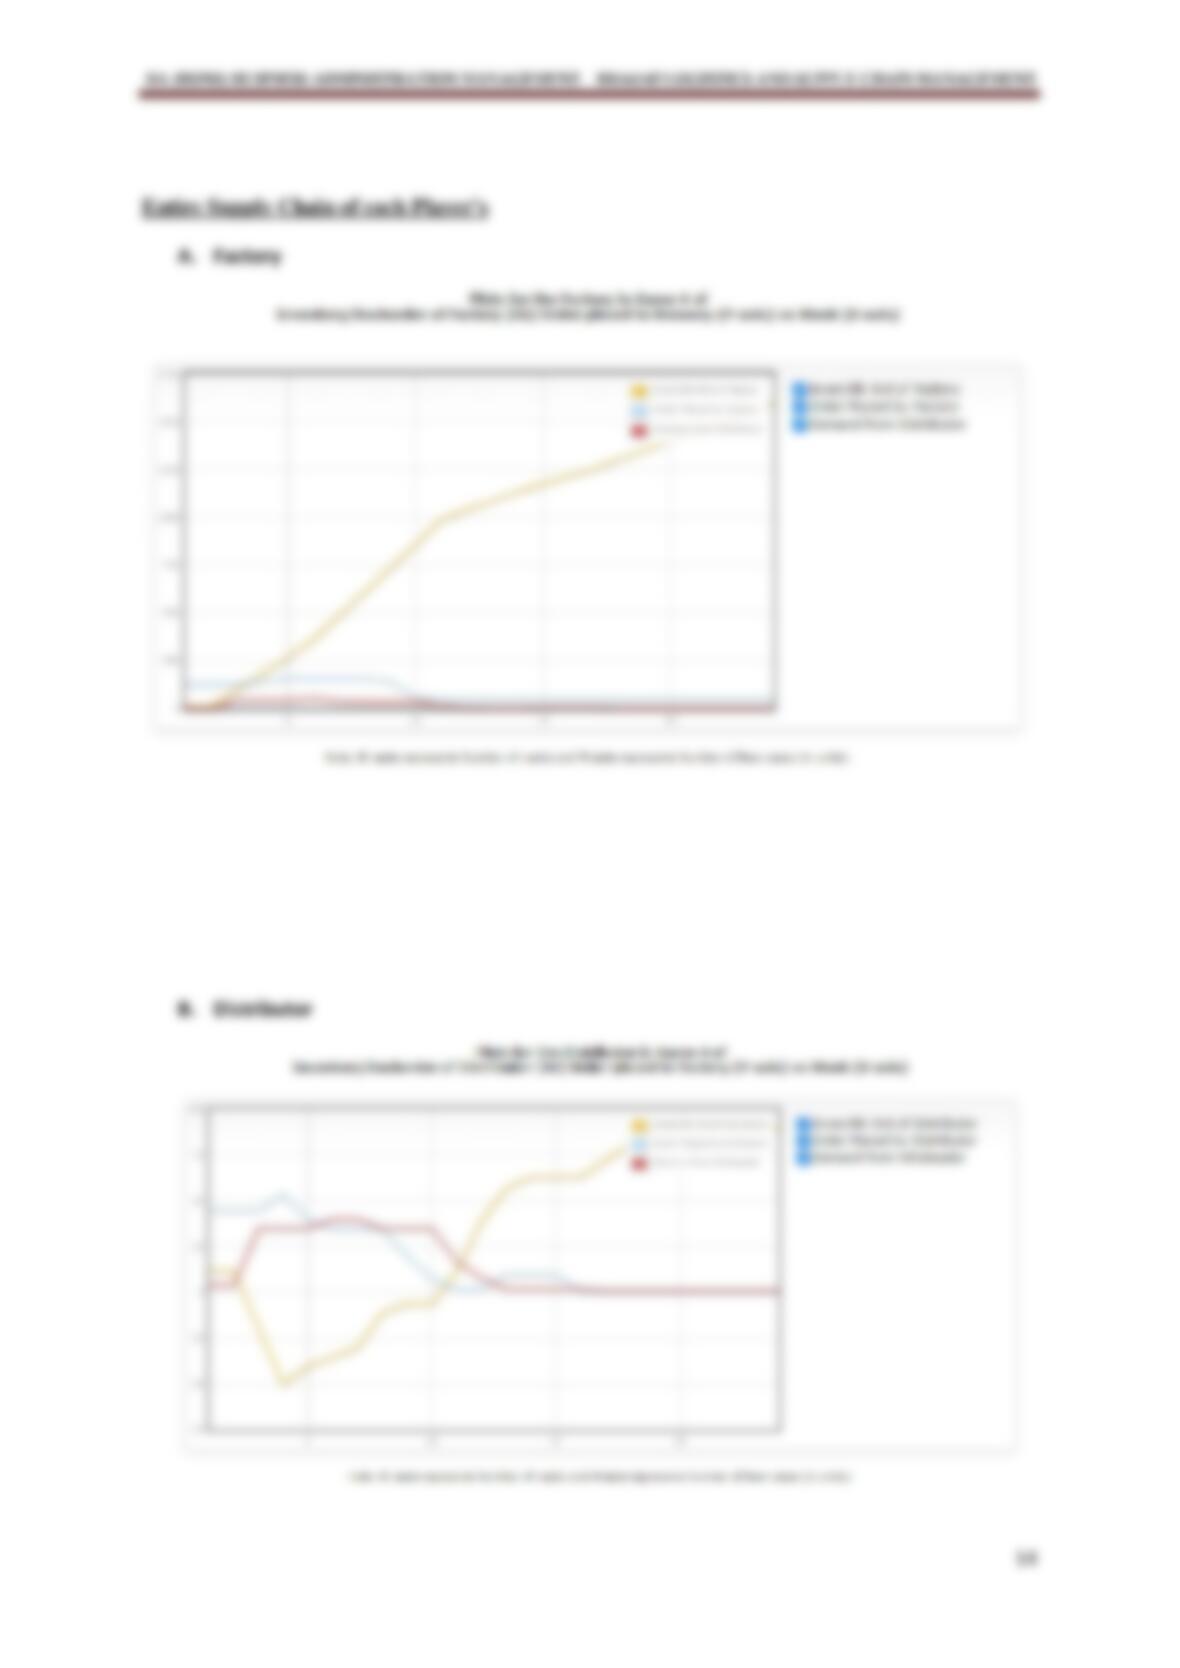
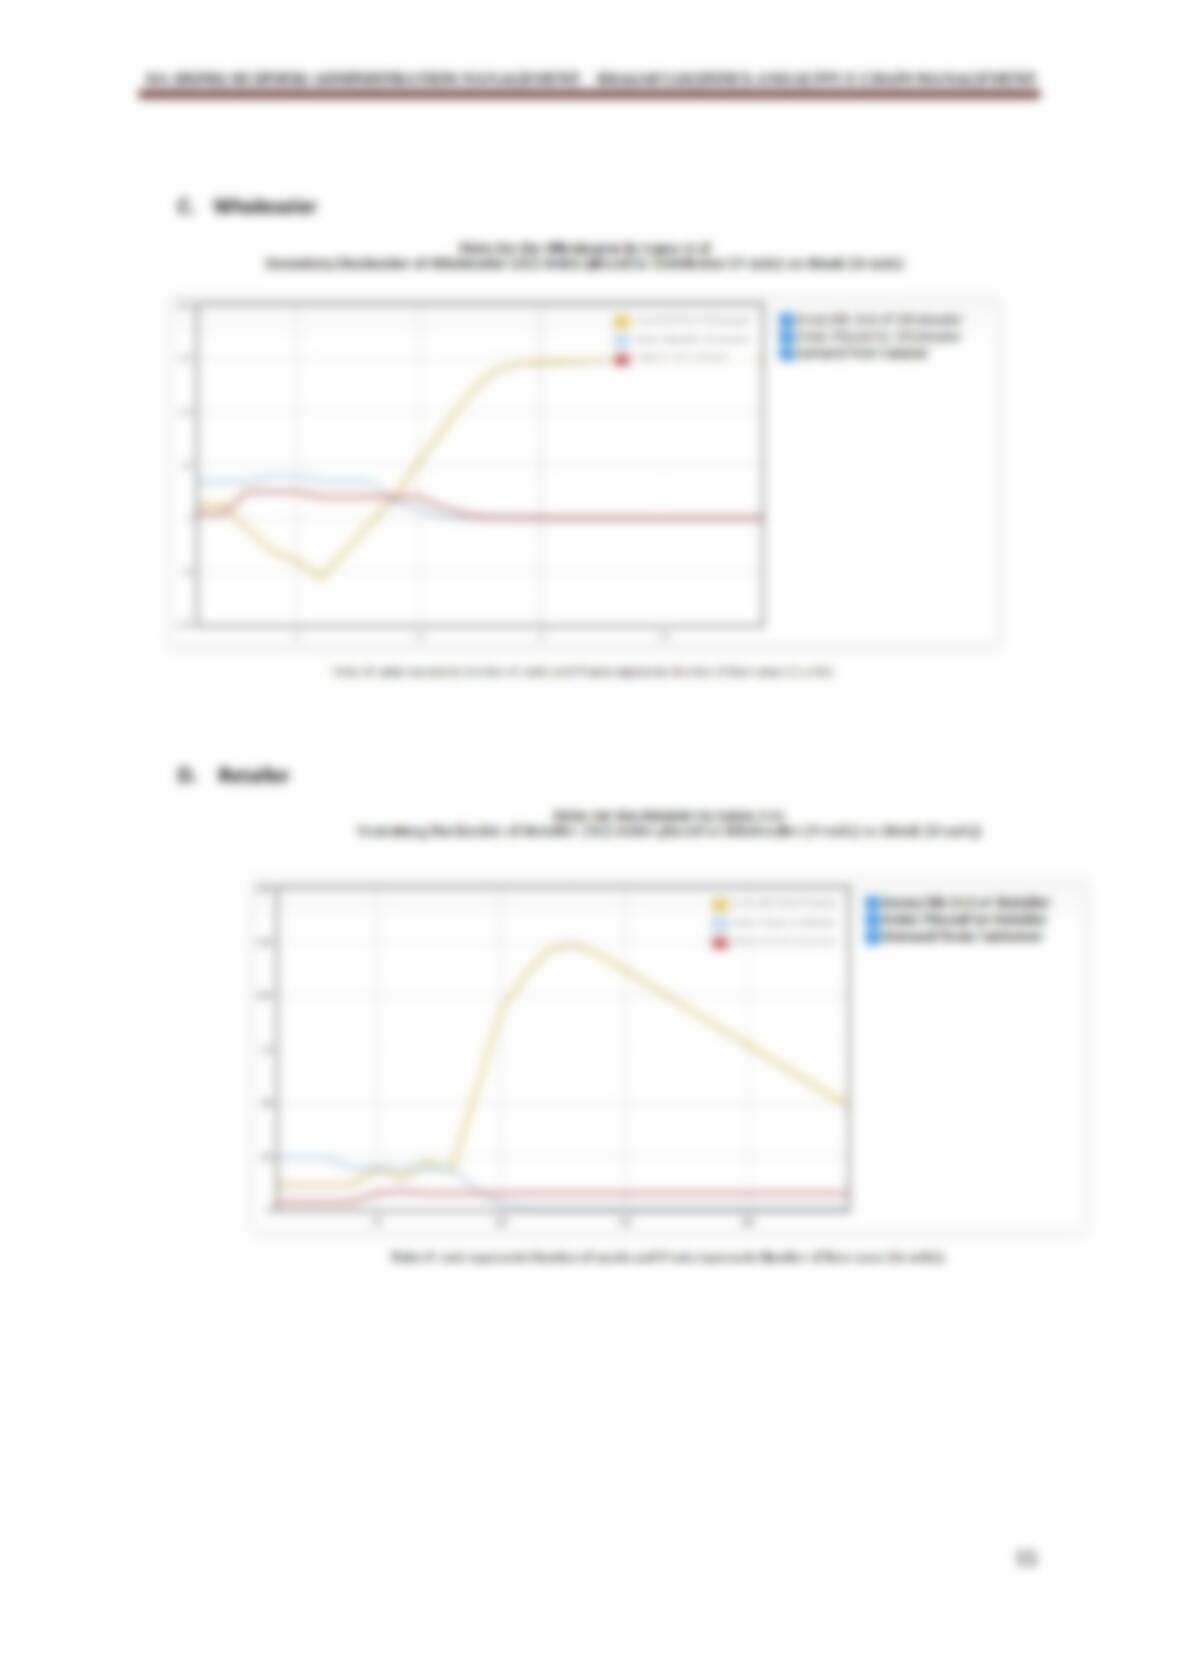
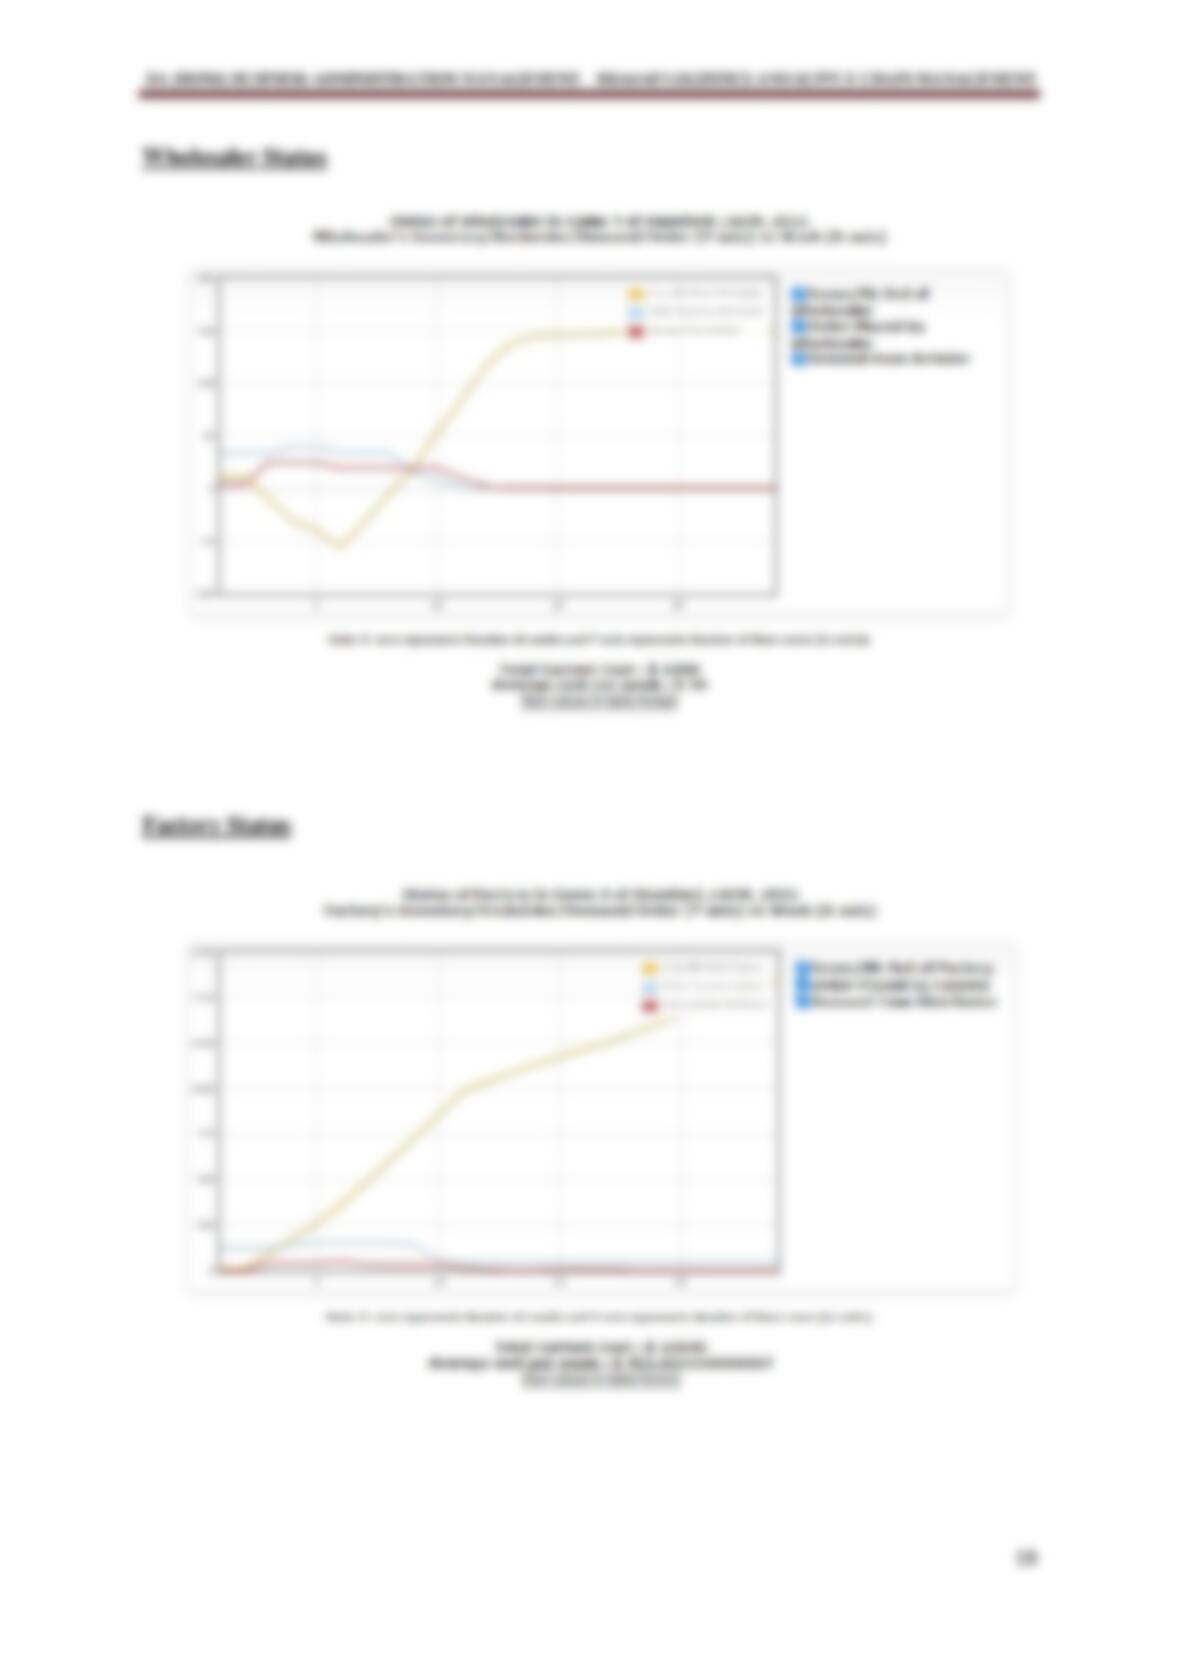
postponement that is given below: Here are a unit the graphical representations of order
position at varied stages. The graphs on top of are generated from the information collected
from the game and show the impact on the supply chain. The subsequent explains the
assorted word of the sport. The new client orders increase just the once at the start and
features a long lasting result on the whole client order. The total client order could be a
combination of the accumulative empty orders and also the new client order. The inventories
graph presents the number of things ordered by the provider and the way the inventory affects
the dimensions of order. The Shipments Graph illustrates clearly the time distinction between
the orders and shipments that indicate the delay that happens attributable to the provision
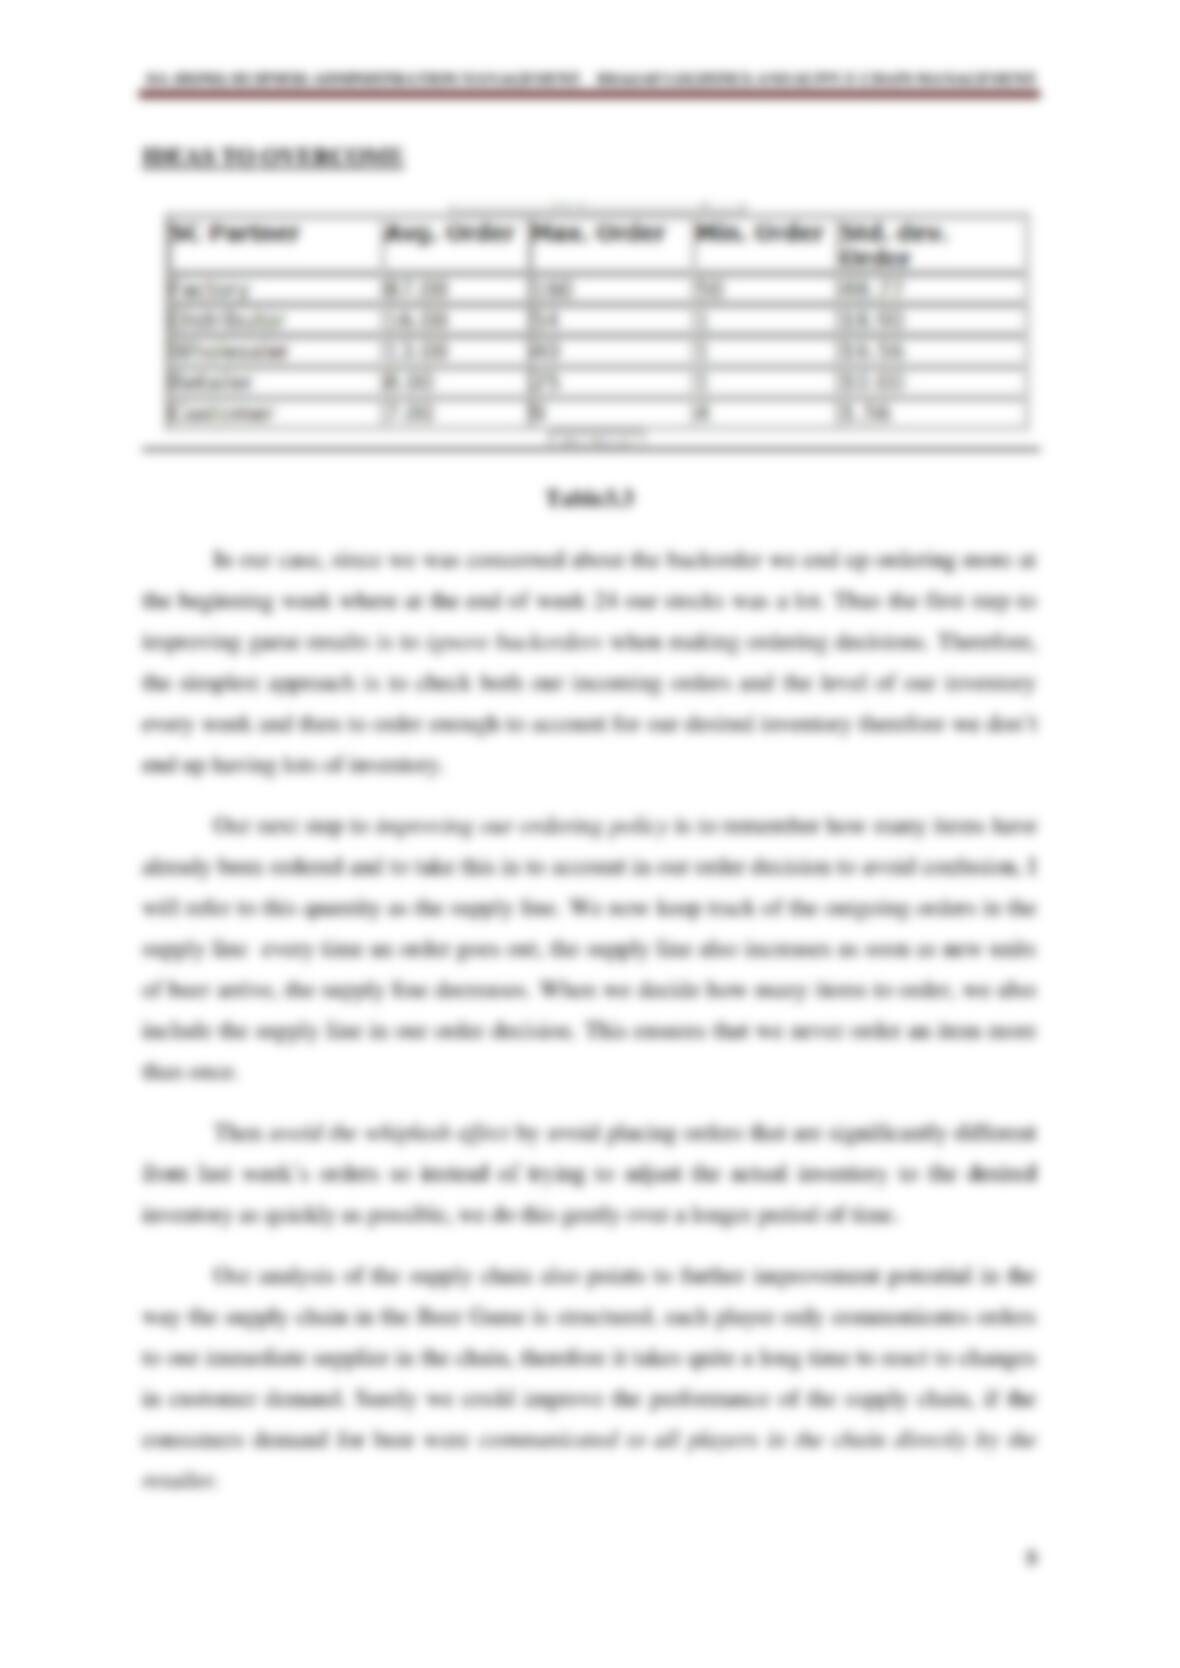
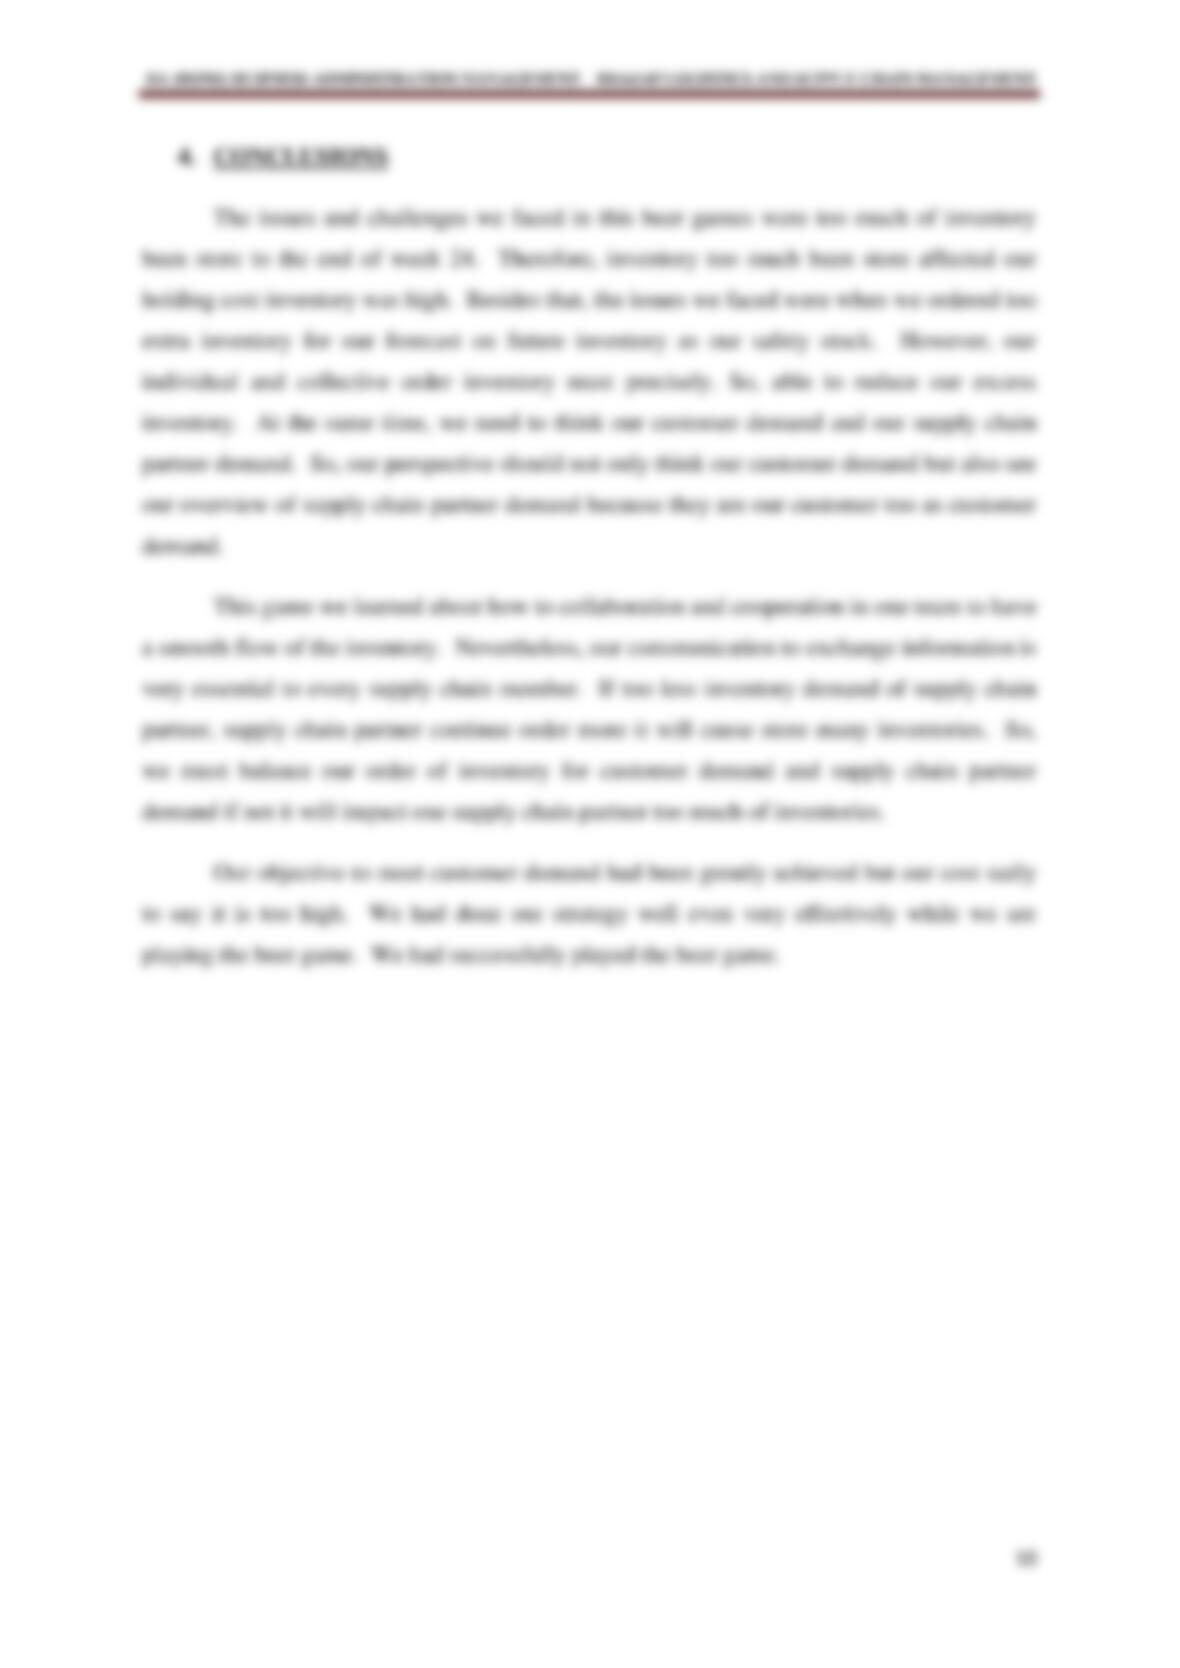
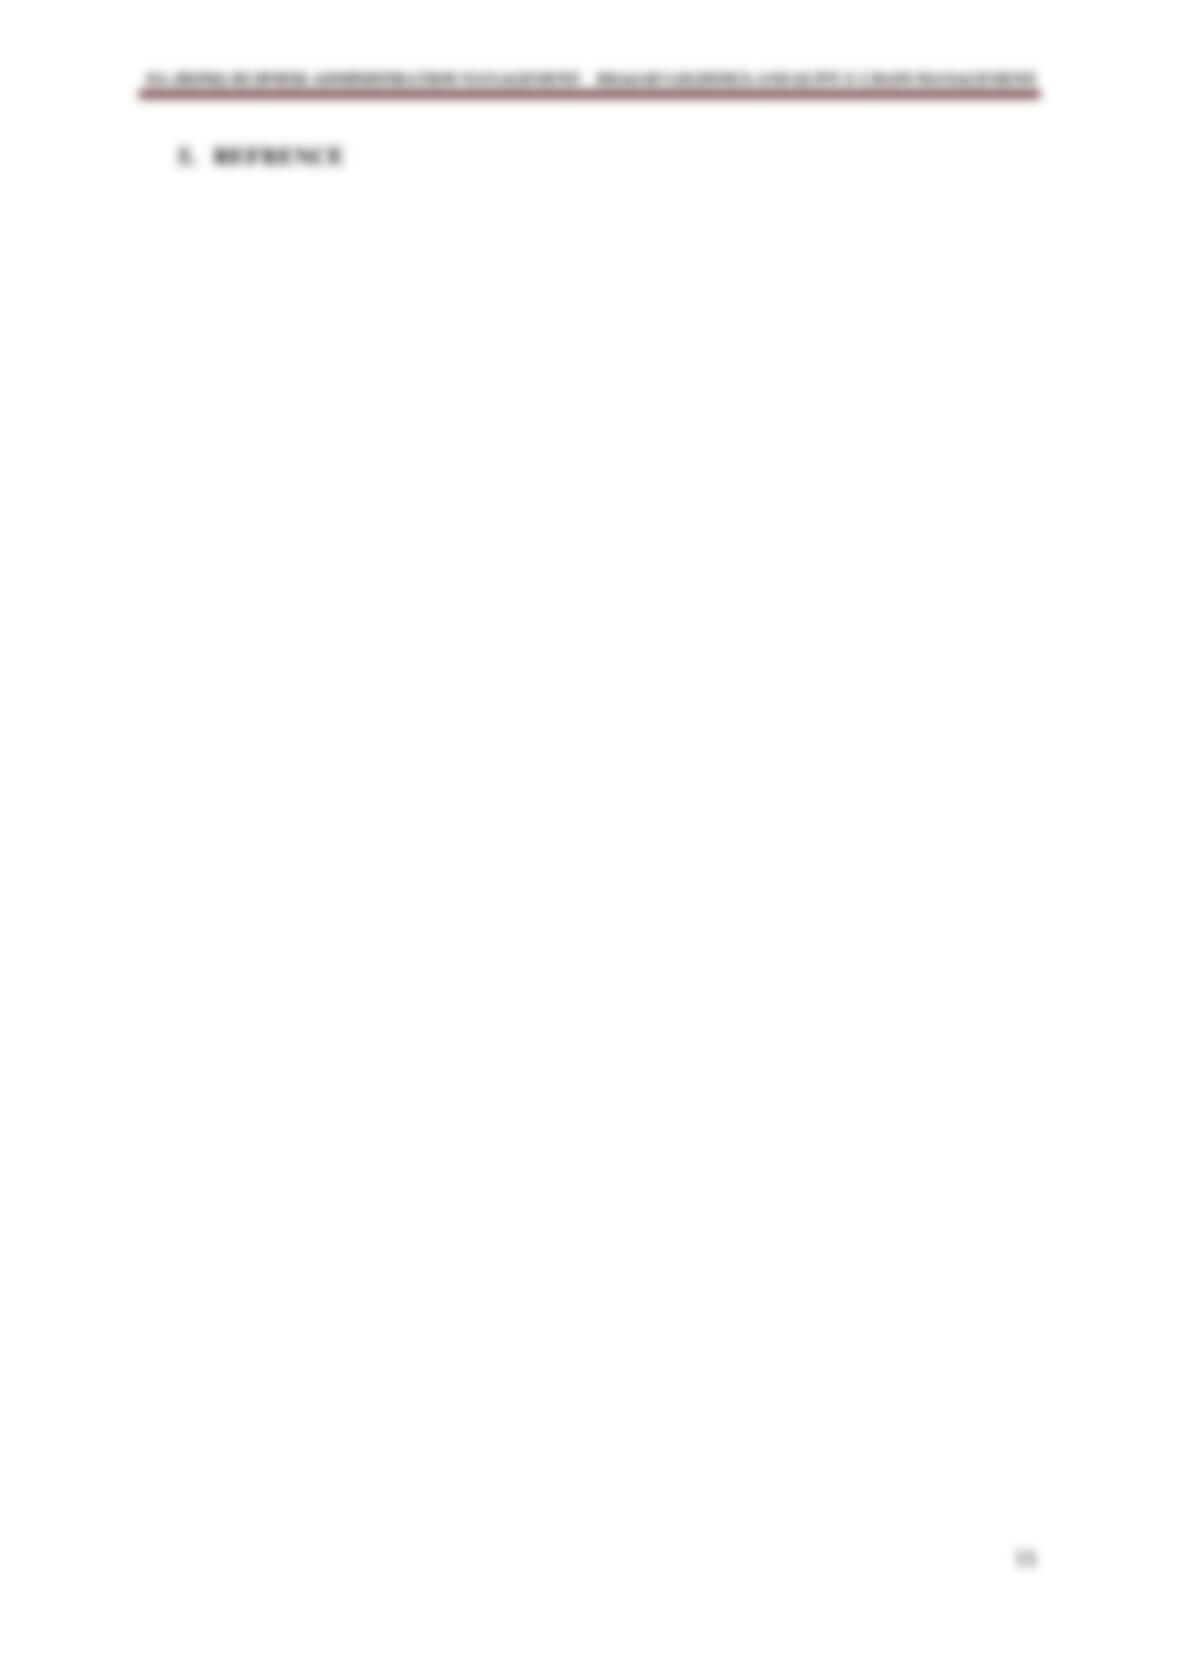
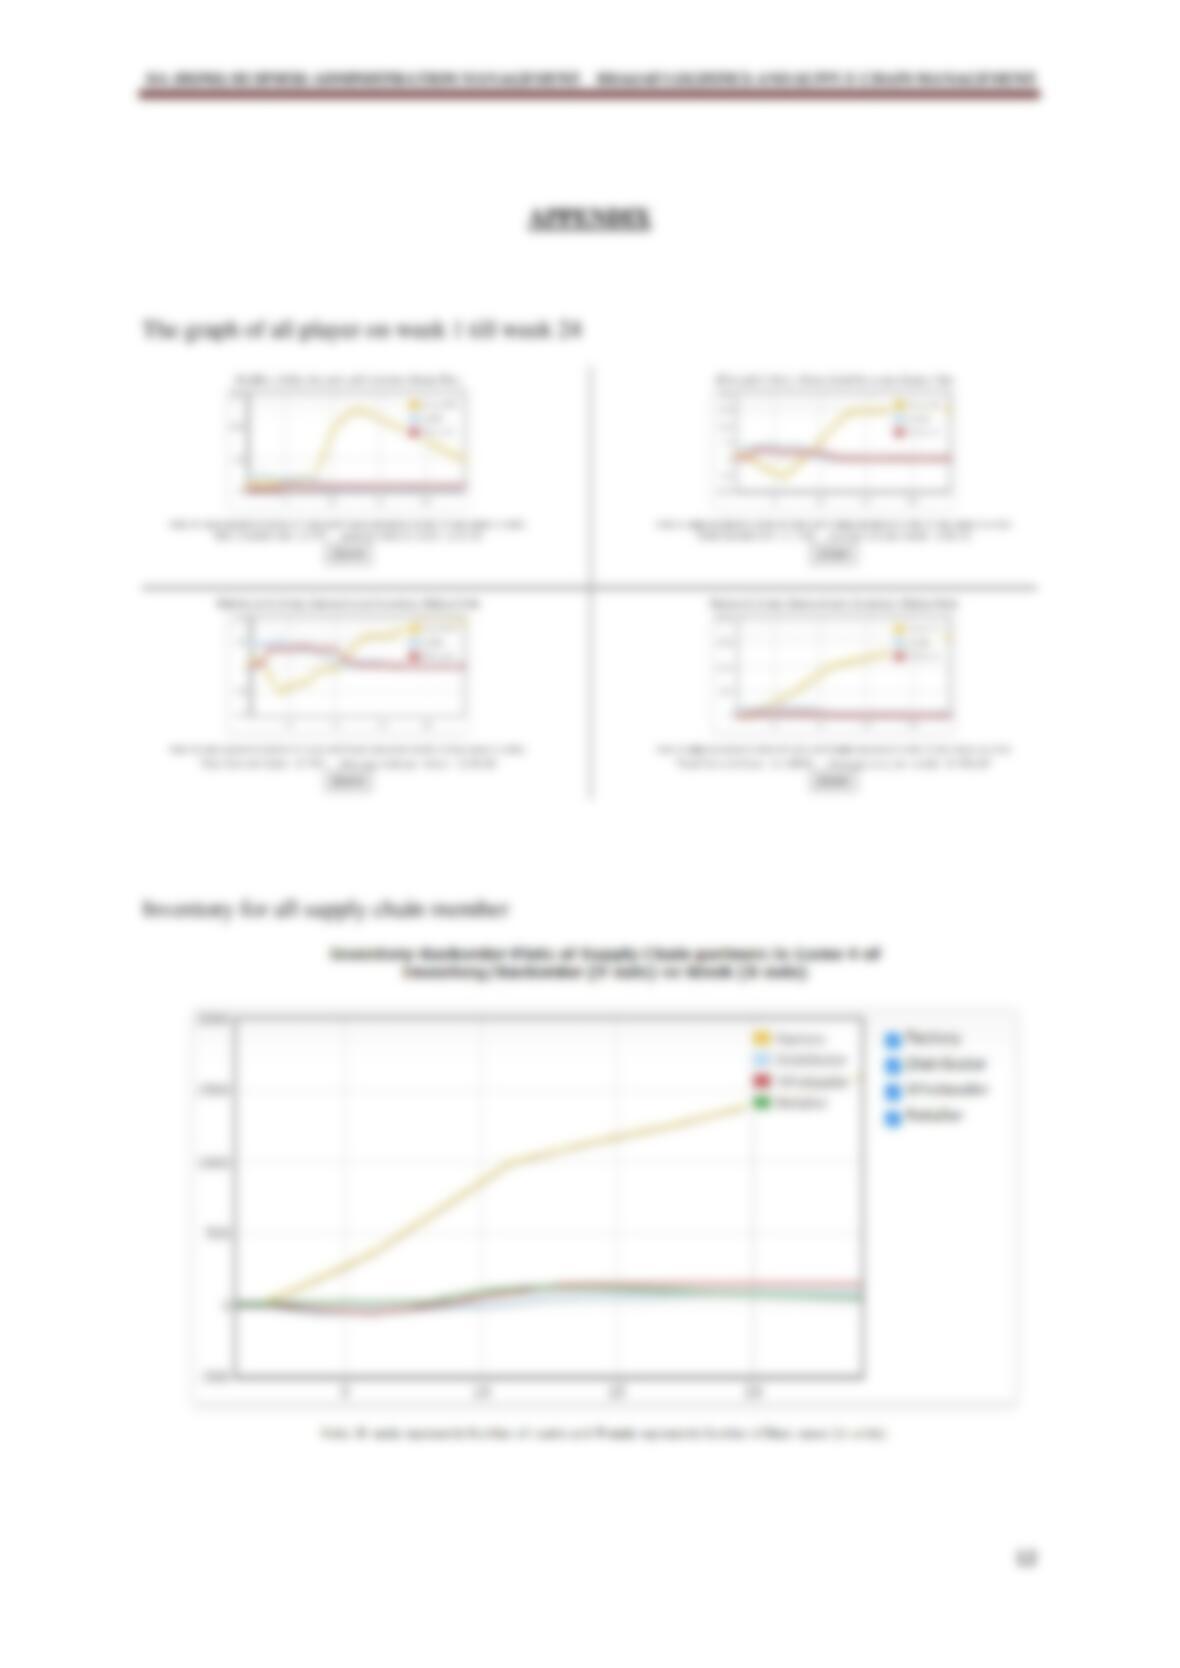
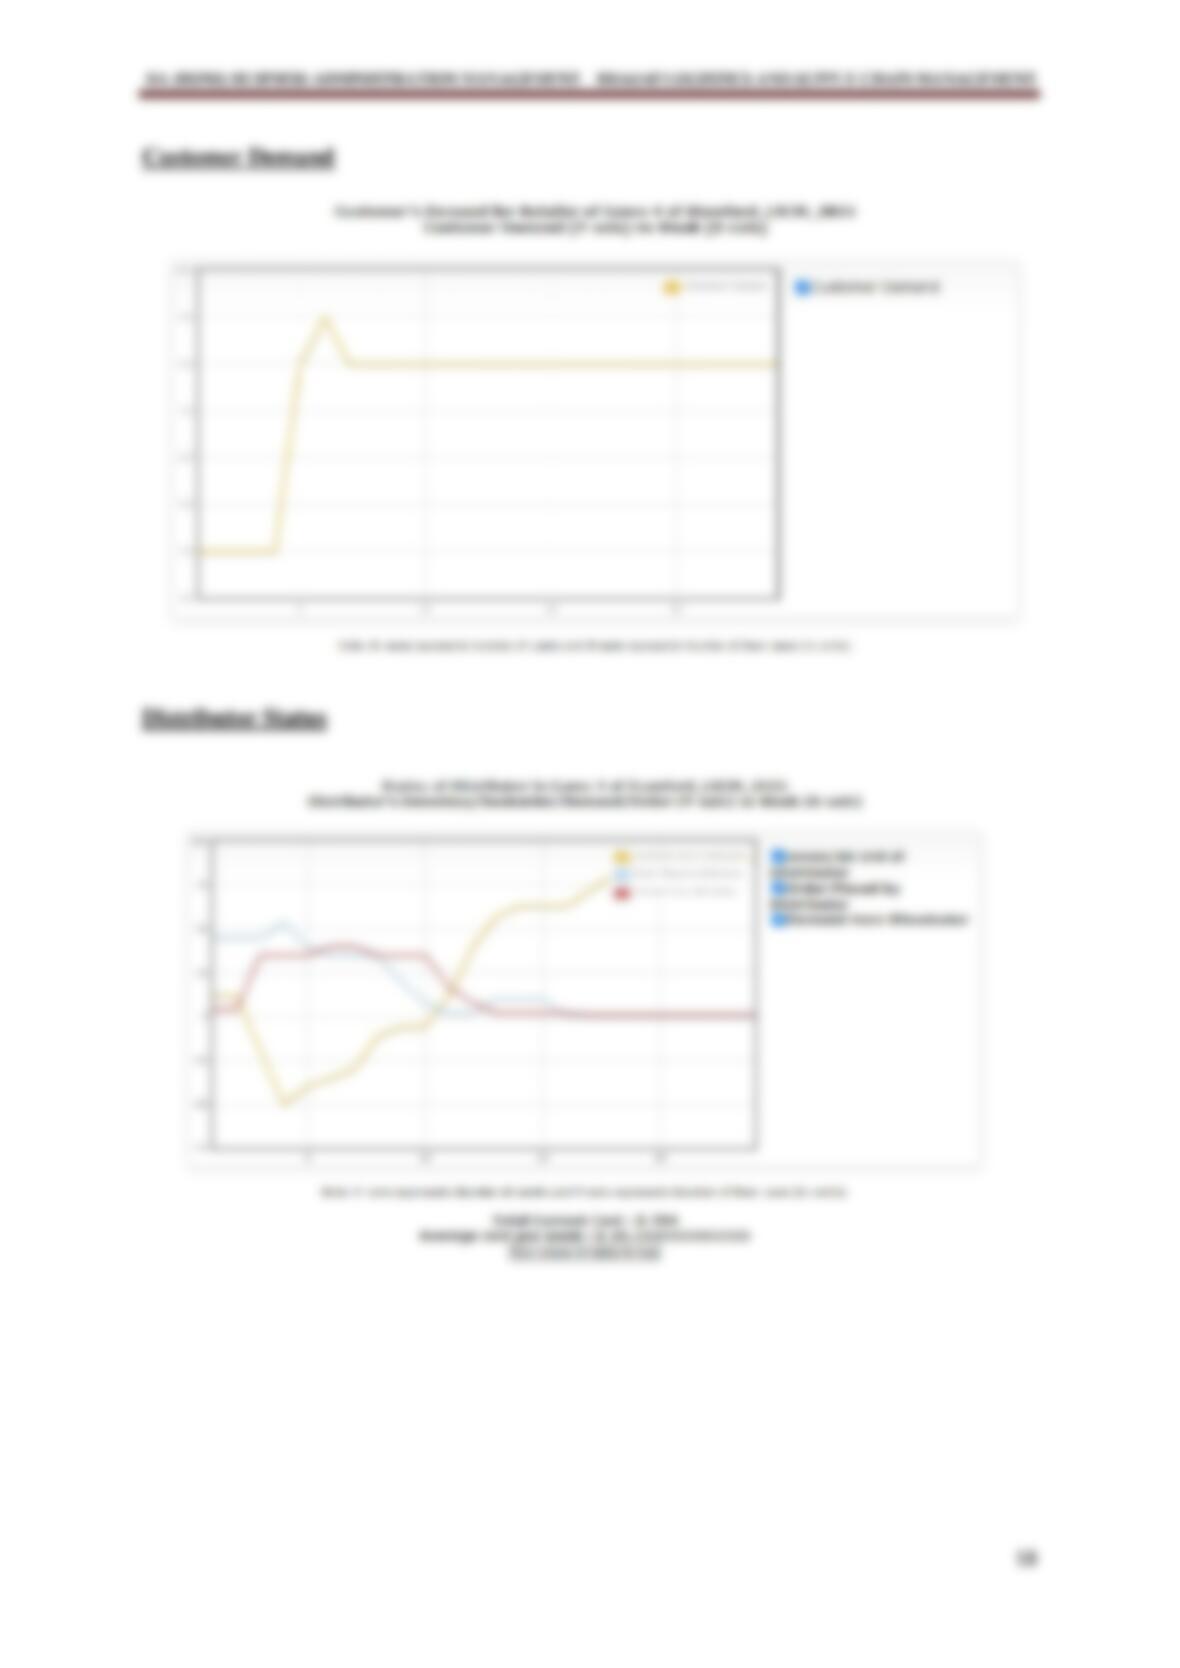
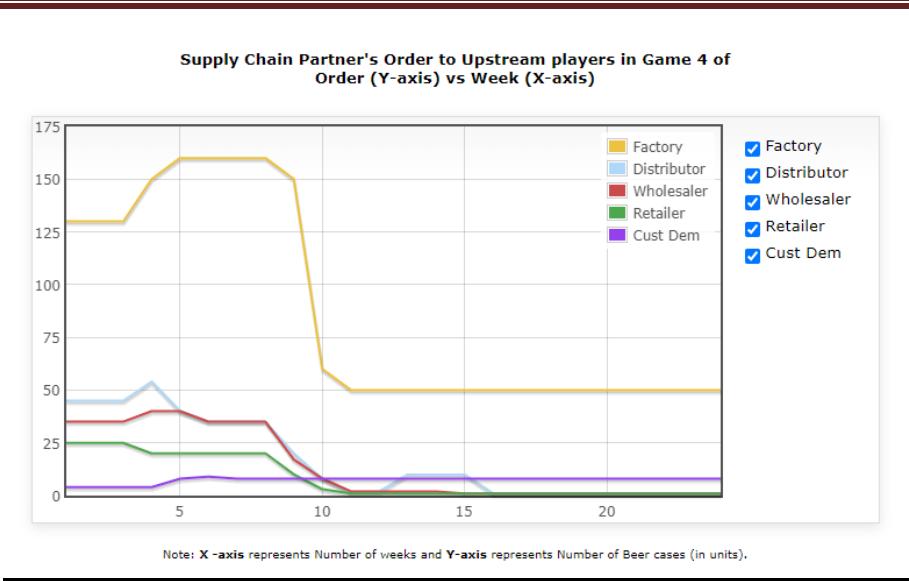
supply chain. Based on the graph 2.1, we can clearly see that, the customer order had been
changed weeks to weeks. So, our plan to solve these issues was, we plan to increase our
inventory in stage of week 1 to week 4. For example, we will be increasing the order
constantly from retailer to factory. We plot this strategy to stable the inventory and the cost
so, it wouldn’t increase too much. Based on the graph 2.1, we have more stock but we used
our strategy which is reducing the order to 1 from week 16 so, from this we can avoid the
order from reduce to 0 because the 0 order strategy will affect our graph . So, we have
avoided using the 0 order strategy by ordering 1.
BA (HONS) BUSINESS ADMINISTRATION MANAGEMENT BBA6143 LOGISTICS AND SUPPLY CHAIN MANAGEMENT
3
Graph 2.1
This rule was mostly what formed the sport and influenced the ends up in terms of
inventory and back orders. The retailer has been very substantial sensible start within the
game with a decent record in inventories of twelve units until week four. At the same time,
the factory had started with a listing of twelve units that remained a similar until week of two.
This was for the most important part because of vast demands from the distributor. It works
but started experiencing several inventories at week eight. Besides that, the wholesaler and
distributor had been maintained their inventory till week 1 to week 2. The retailer had
increased the demand on week 3 caused the wholesaler and distributor to faced the back
order. The wholesaler had been facing lots of back orders in the week of 4 to 6. However, in
week 7 the retailer decrease the demand caused the wholesaler’s back order to be less. In the
week 9, the wholesaler received 40 units that had been ordered in the week of 5 from the
distributor caused the back order to be cleared. On the other hand, the wholesaler had
increased the demand at the week of 4 and the distributor struggle to maintain the back order.
Although the demand had increased in week 4, the wholesaler had decreased the demand at
week 6 to 9. The distributor had managed to maintain or cleared the back order at week 11.
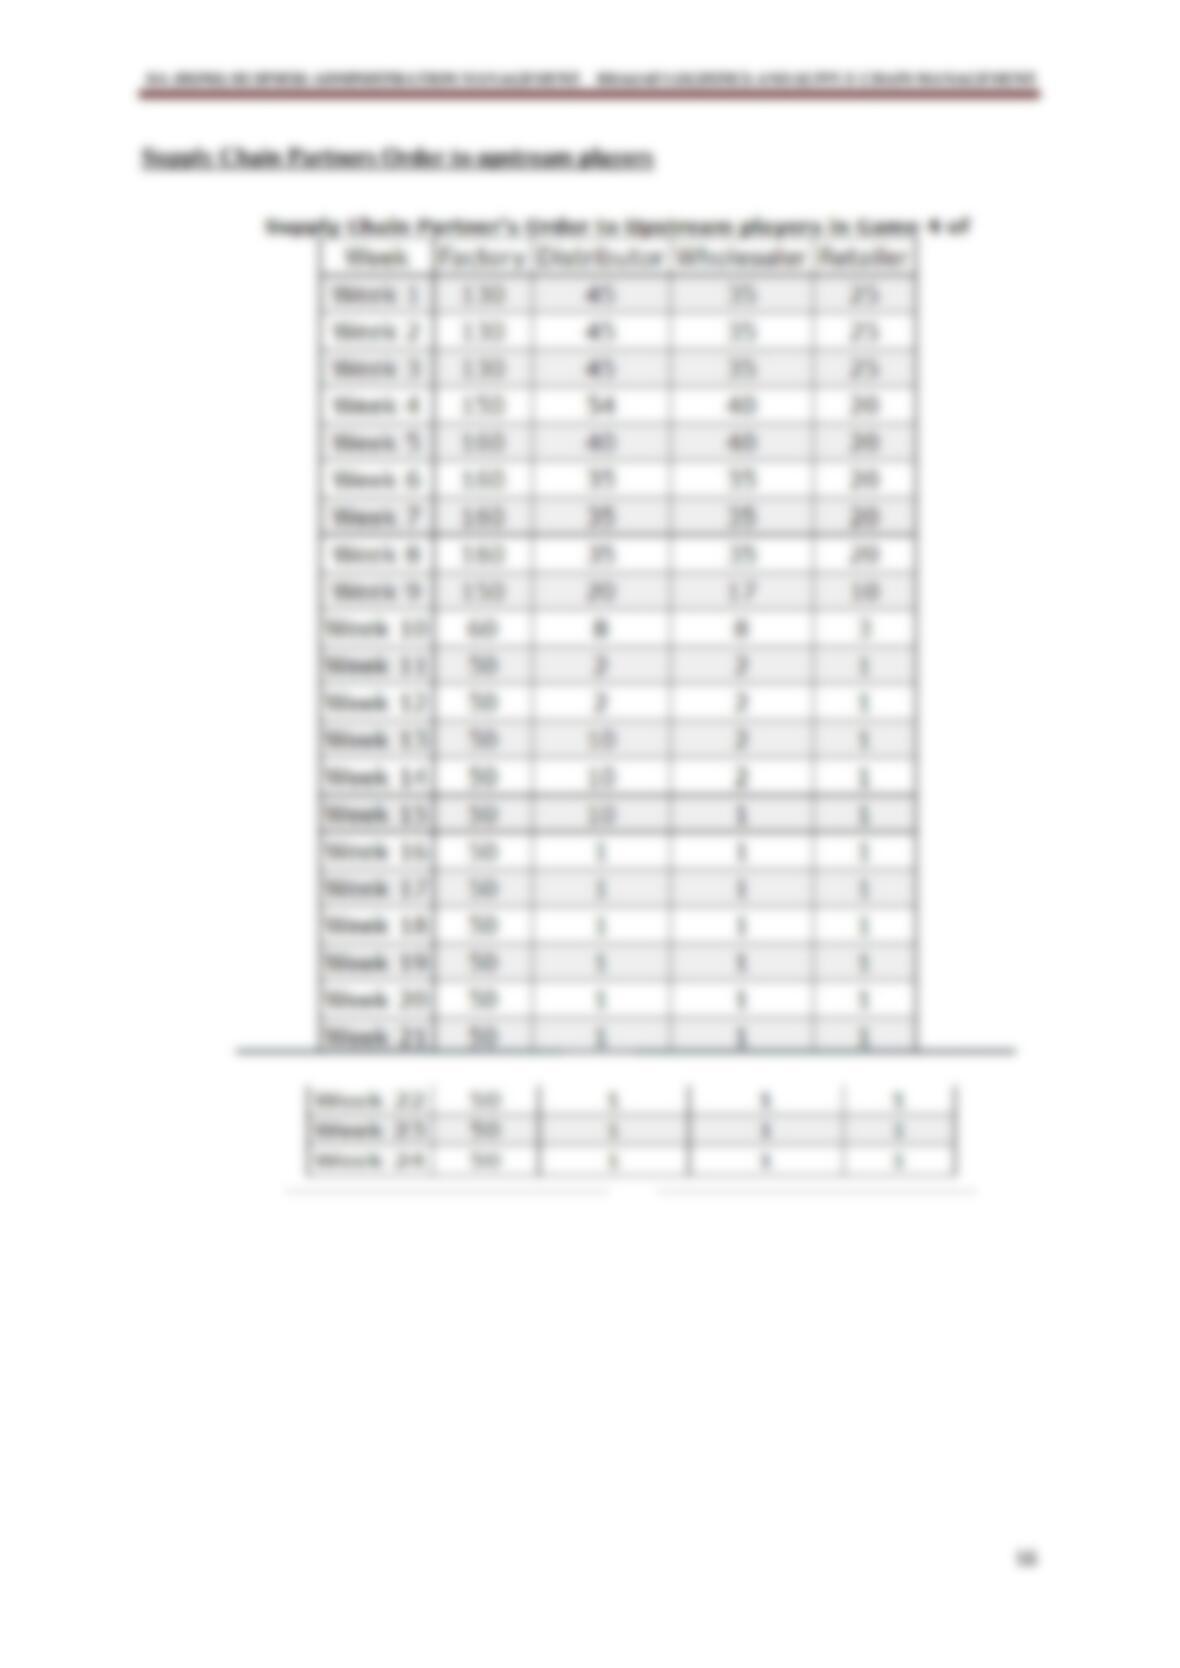
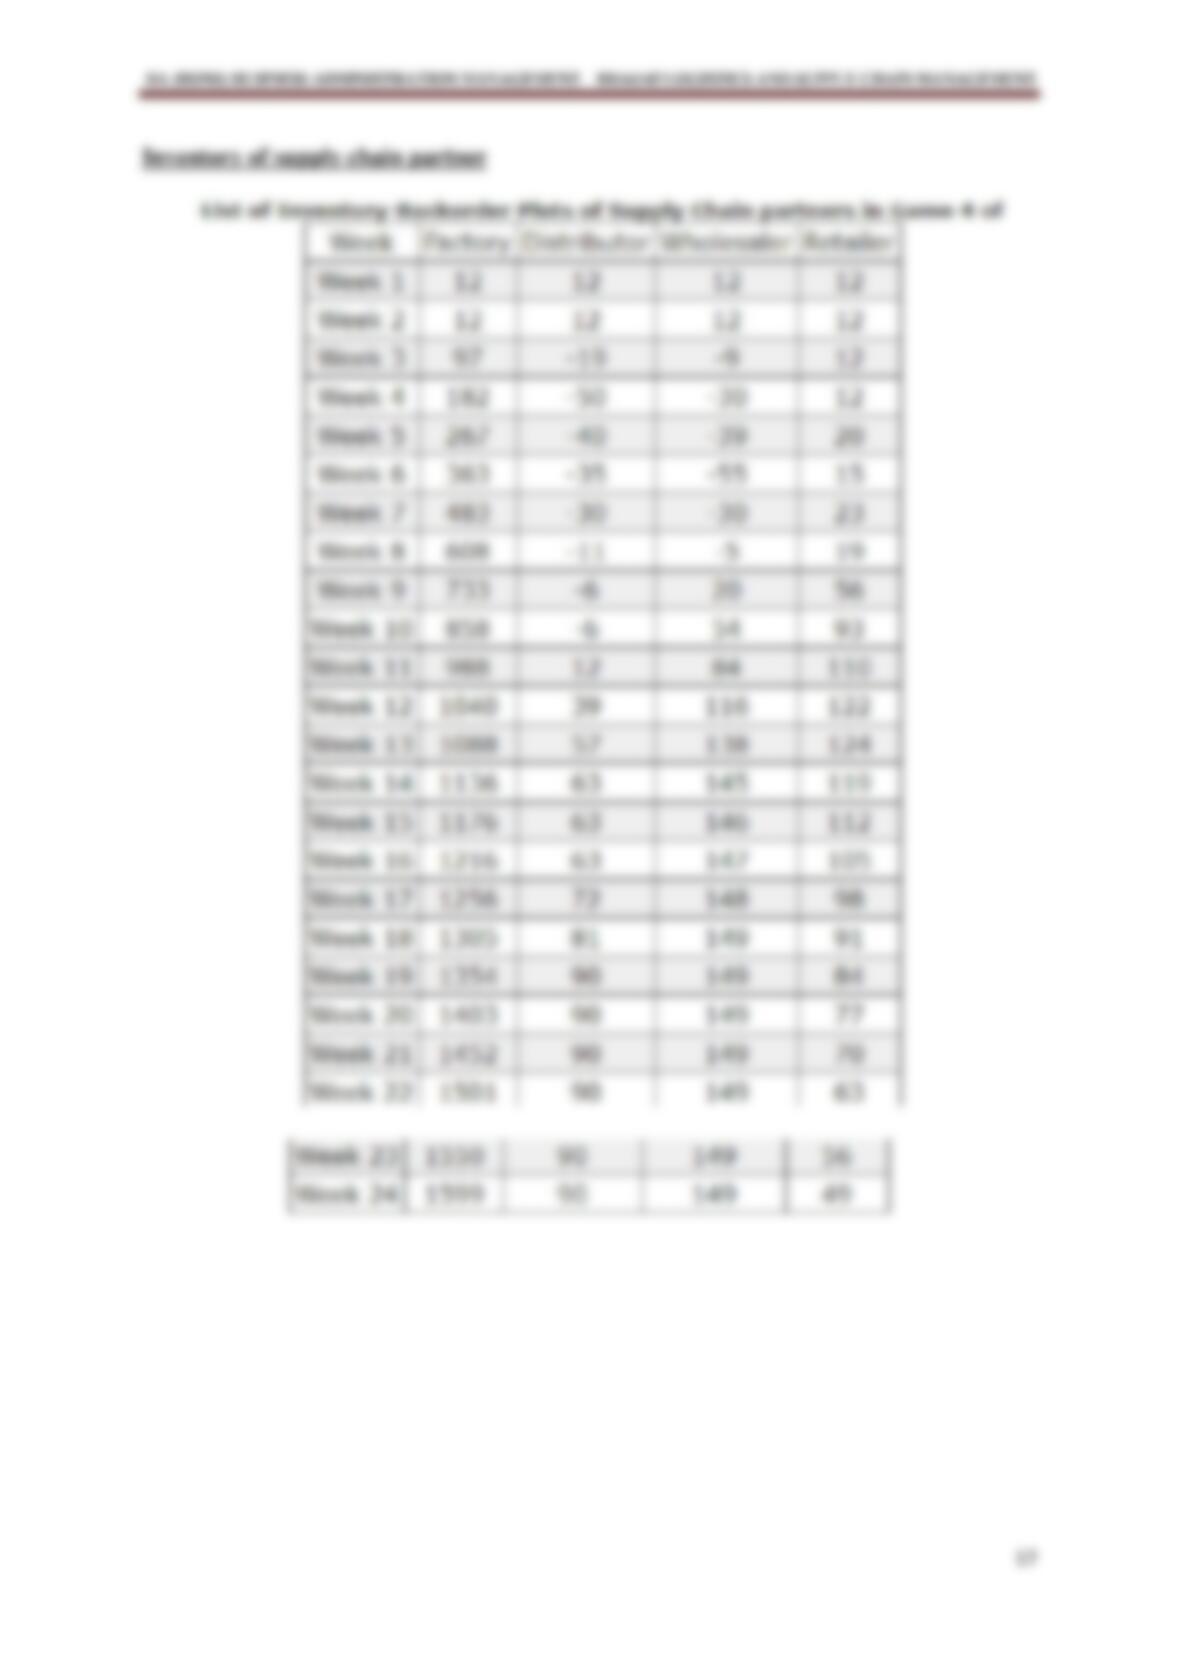
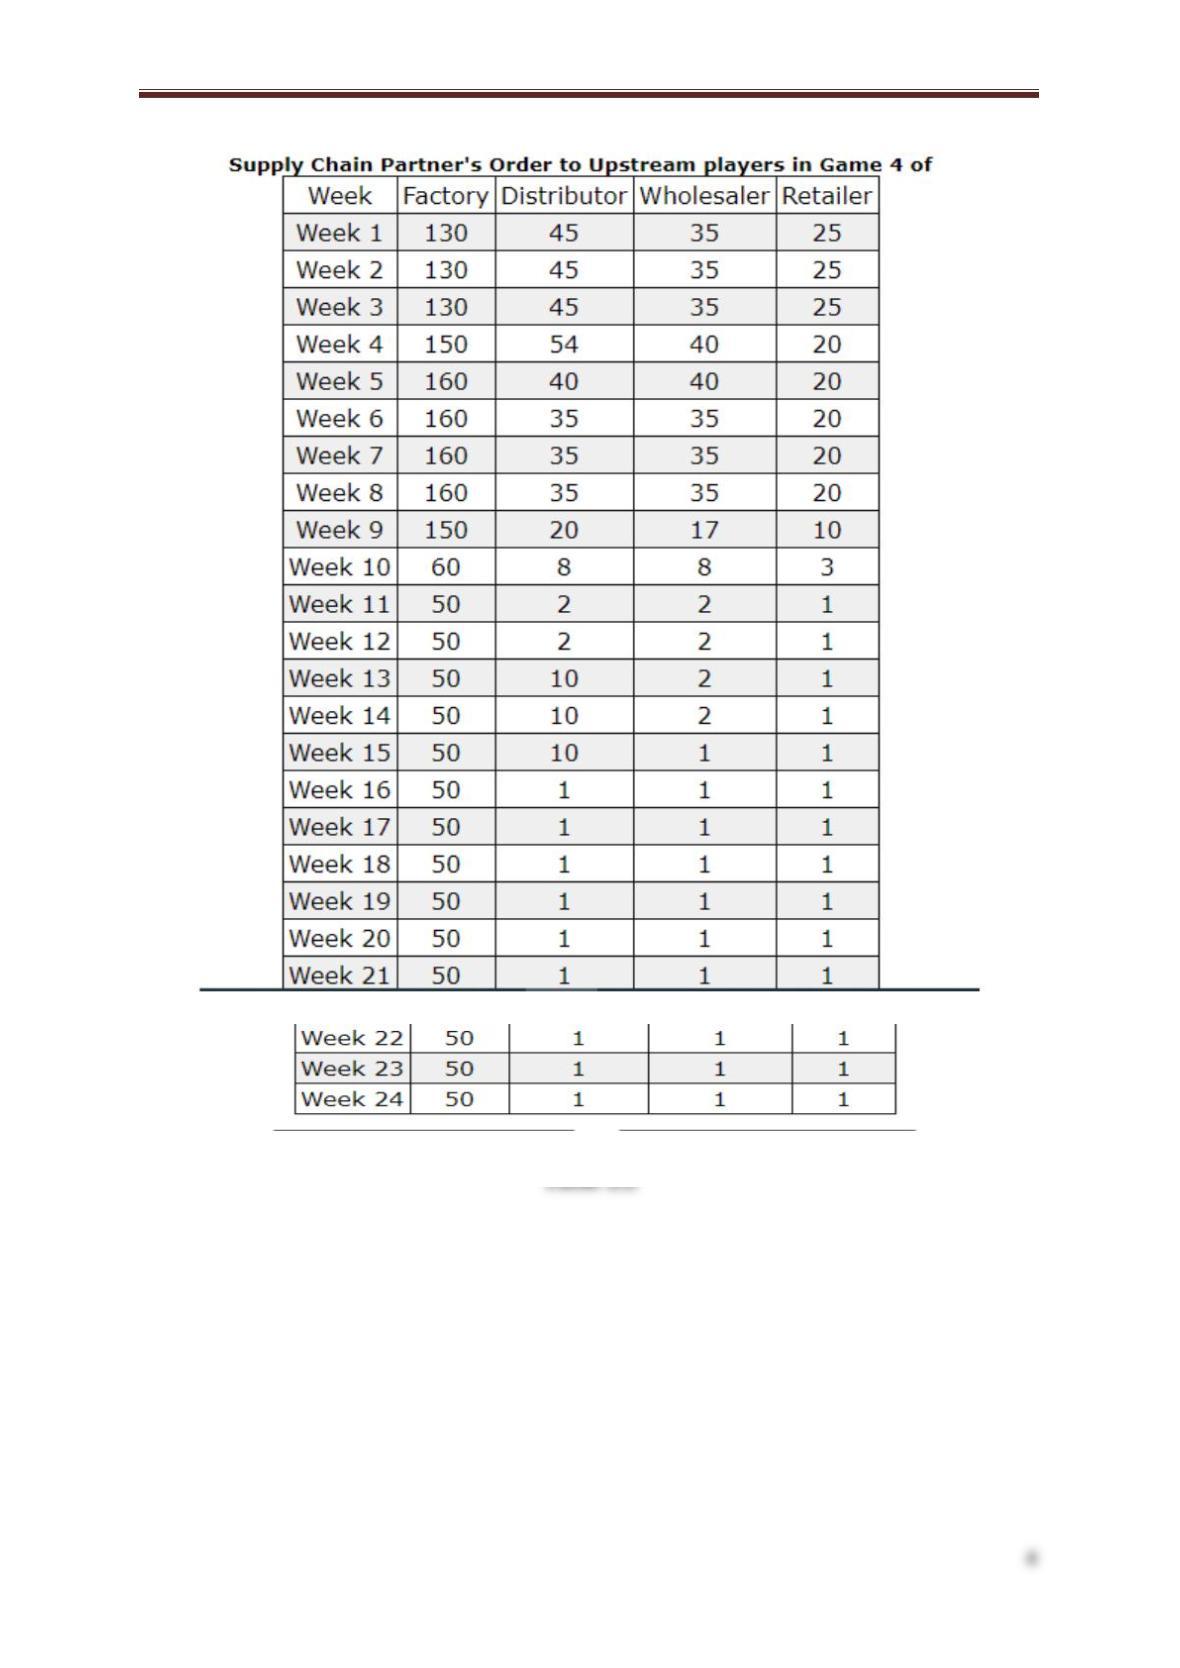
Based on the table 2.2, the factory had most inventory compared to distributor, wholesaler
and retailer at the end of the week 24 which is 1599 units. The retailer had the fewer
inventories which is 49 units.
BA (HONS) BUSINESS ADMINISTRATION MANAGEMENT BBA6143 LOGISTICS AND SUPPLY CHAIN MANAGEMENT