1. Identify the major factors that contributed to Bear Stearns’s failure? Who stood to benefit from its
implosion? How did Bear Stearns’s collapse differ from the ‘Long Term Capital Management’ failure a decade
earlier? What could Bear Stearns have done differently to avoid this fate?
• In the early 2000’s?
• And during the summer of 2007?
• And during the week of March 10, 2008?
There were several factors that contributed to the failure of Bear Stearns. It is important to highlight that the
appetite for risk and growth in earnings encouraged the players in the investment banking industry to load their
balance sheets with debt and use proceeds to invest aggressively in risky financial instruments; such as,
mortgage backed securities (MBS) and collateralized debt obligations (CDOs). The firm’s culture, the
overleveraged position it adopted in the early 2000’s, the increase in MBS in its balance sheet and the belief
that the real estate market would continue to do well are factors controlled by the firm (i.e. internal factors) that
contributed to its failure. There were other factors (i.e. external factors), however, that were not controlled by
the firm but still contributed to its failure. Those factors include, but are not limited to, the fall in housing prices
in the U.S., the offering of credit default swaps (CDS) by insurance companies to holders of MBS and CDOs,
the rating agencies classifying the aforementioned financial instruments as investment-grade investments and
poor regulatory oversight. A brief explanation of some of the internal and external factors mentioned above
follows.
Internal Factors
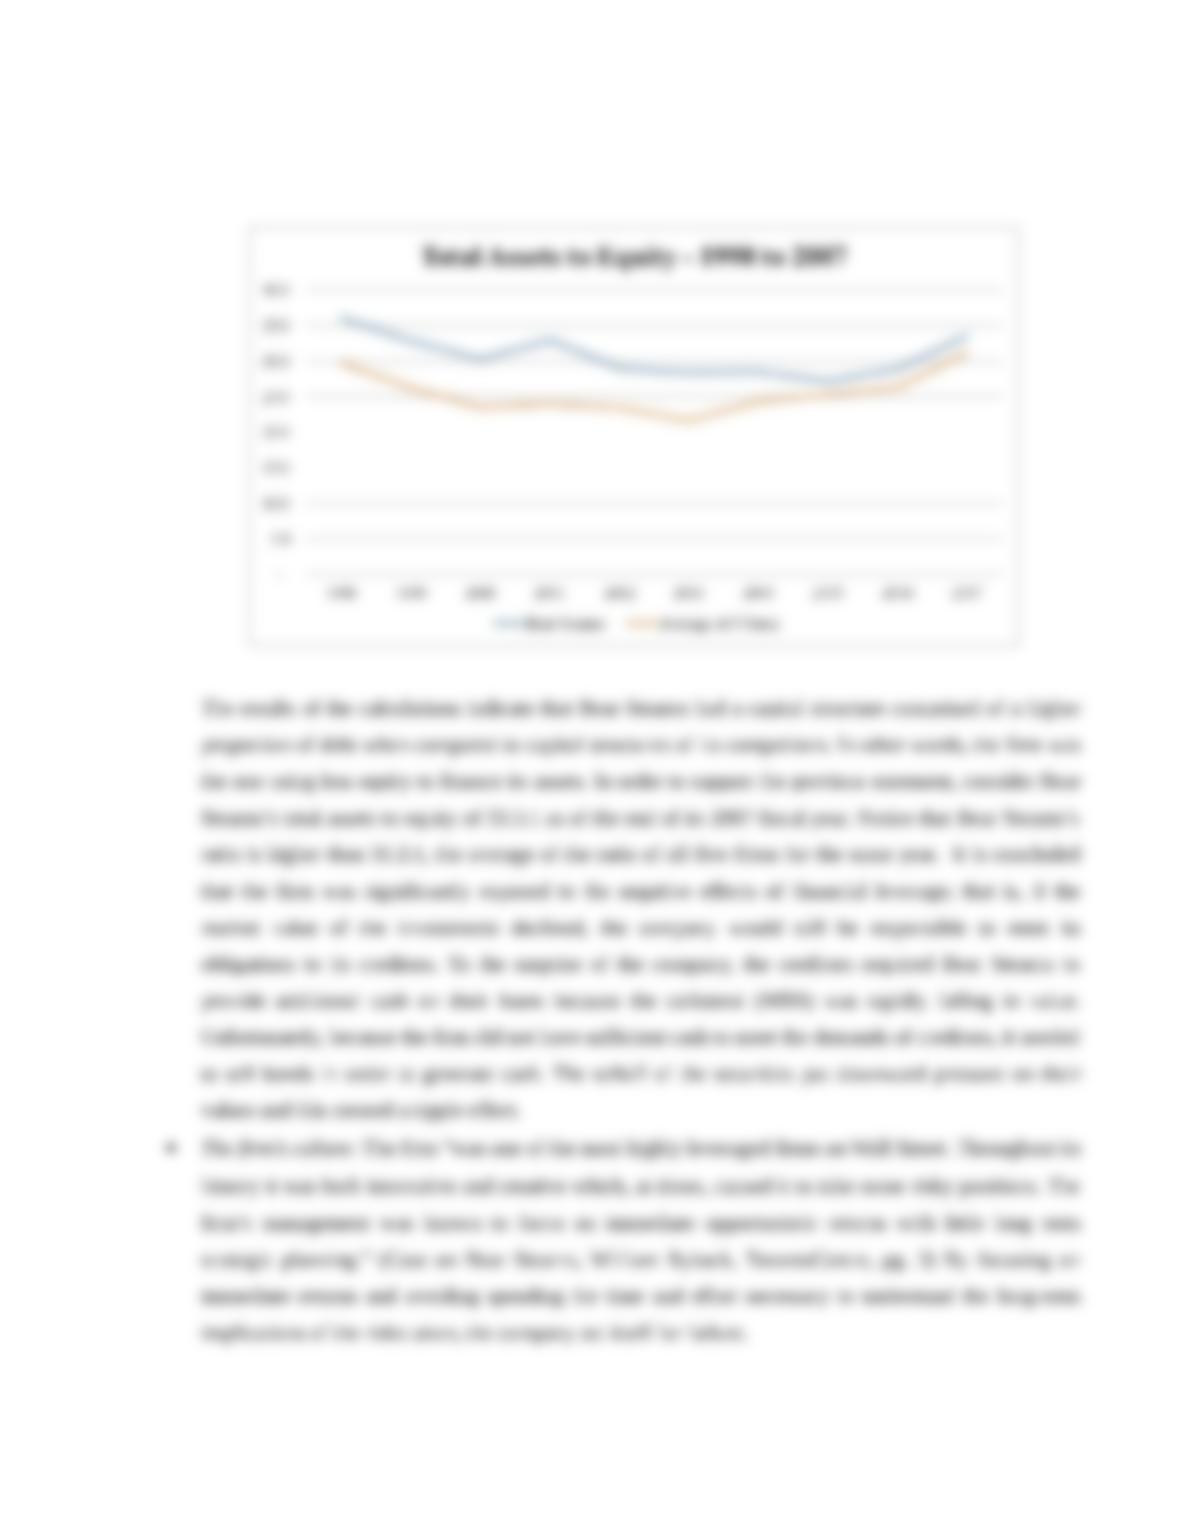
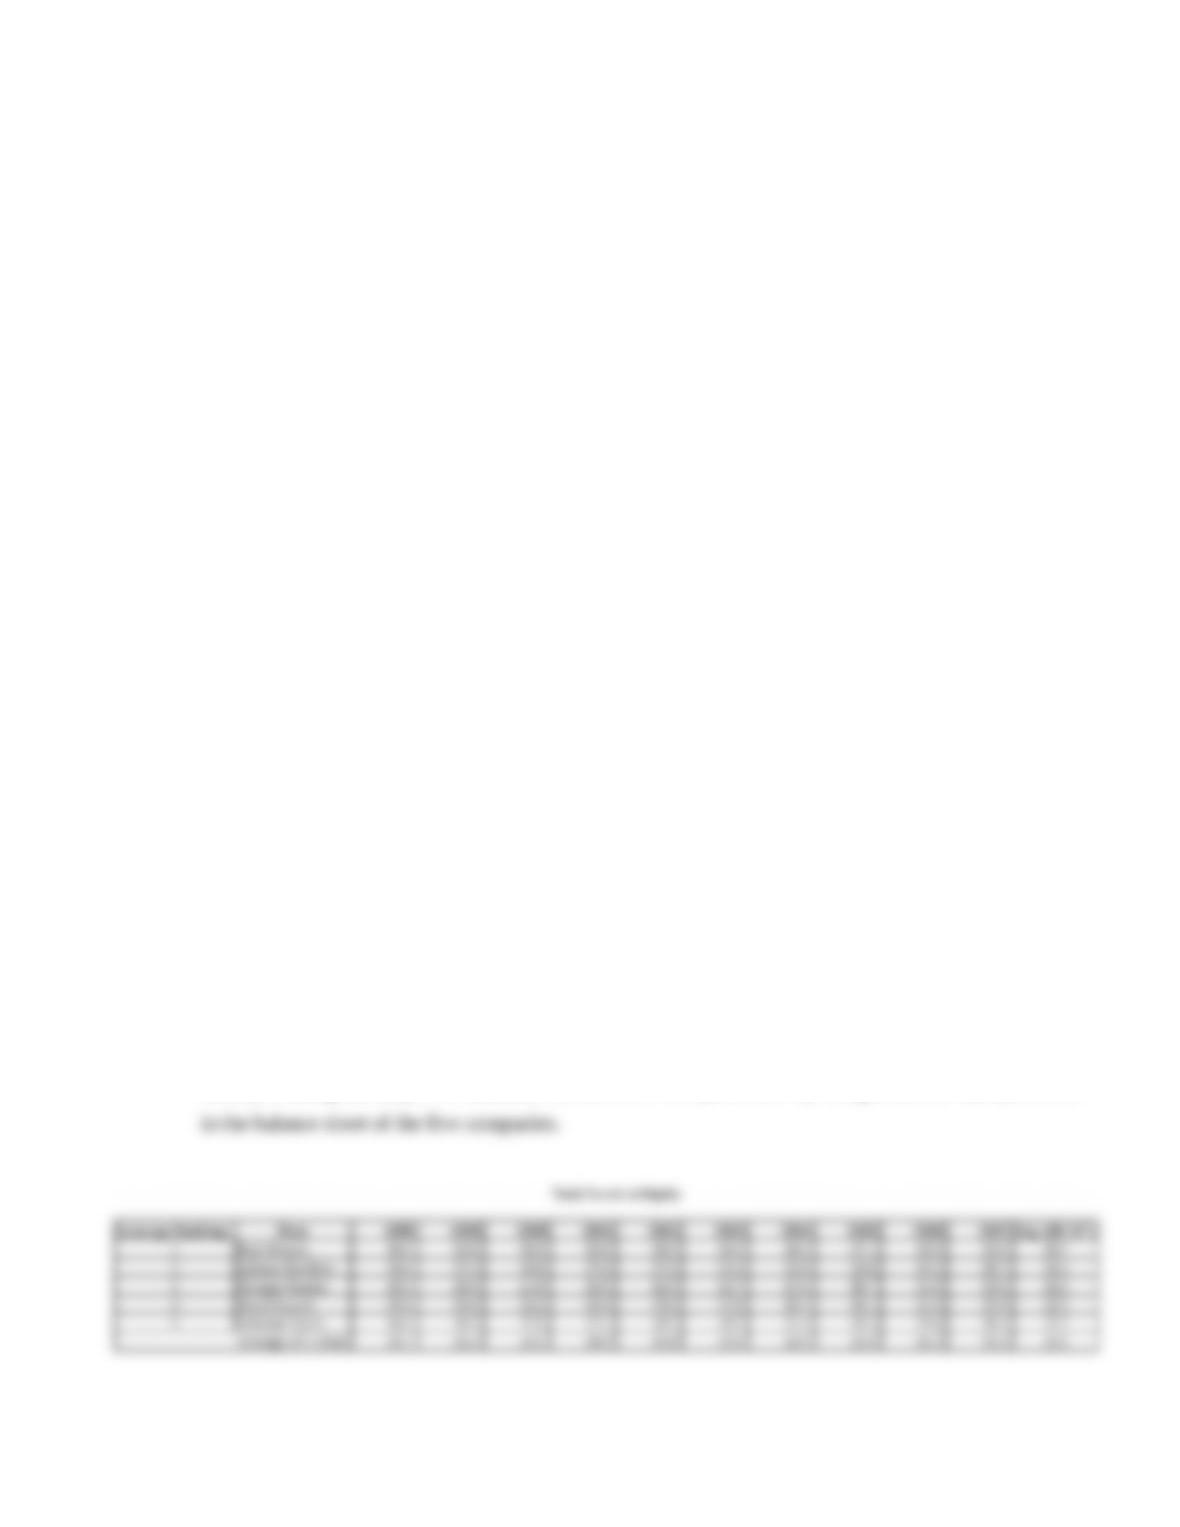
Overleveraged position: an analysis of the firm’s total assets to equity for the period 1998 to 2007 was
performed. It was noticed that Bear Stearns’s total assets were financed mostly with liabilities and that
it had the highest total assets to equity ratio for the period when compared to its main competitors. The
table below presents a comparison of total assets to equity by company; in addition, it presents the
average of ratios of each company for the 10 year period. The chart below the table presents a trend
analysis and compares total assets to equity by year for Bear Stearns and the average of the five
companies, including Bear Stearns. Note that both the table and chart were created by members of the
team presenting this paper. In addition, calculations were performed by using financial data presented