Discussion Questions
1. What is your analysis of the bag-weight problem?
2. What procedures would you recommend to maintain proper quality control?
Analysis
Data is provided on the Excel Spreadsheet supplied with the text. This spreadsheet
contains the data only, no formulas or analyses are provided for the student. The analyses
can be done by hand, but it is very tedious.
The first step in the analysis is to construct control charts for the three shifts. These charts
can be made for all of the data or for each of the shifts separately. Since the case indicates
that the evening and night shifts may be having more problems with bag weights, because
of training and inexperience, we will construct control charts separately for each of the
three shifts.
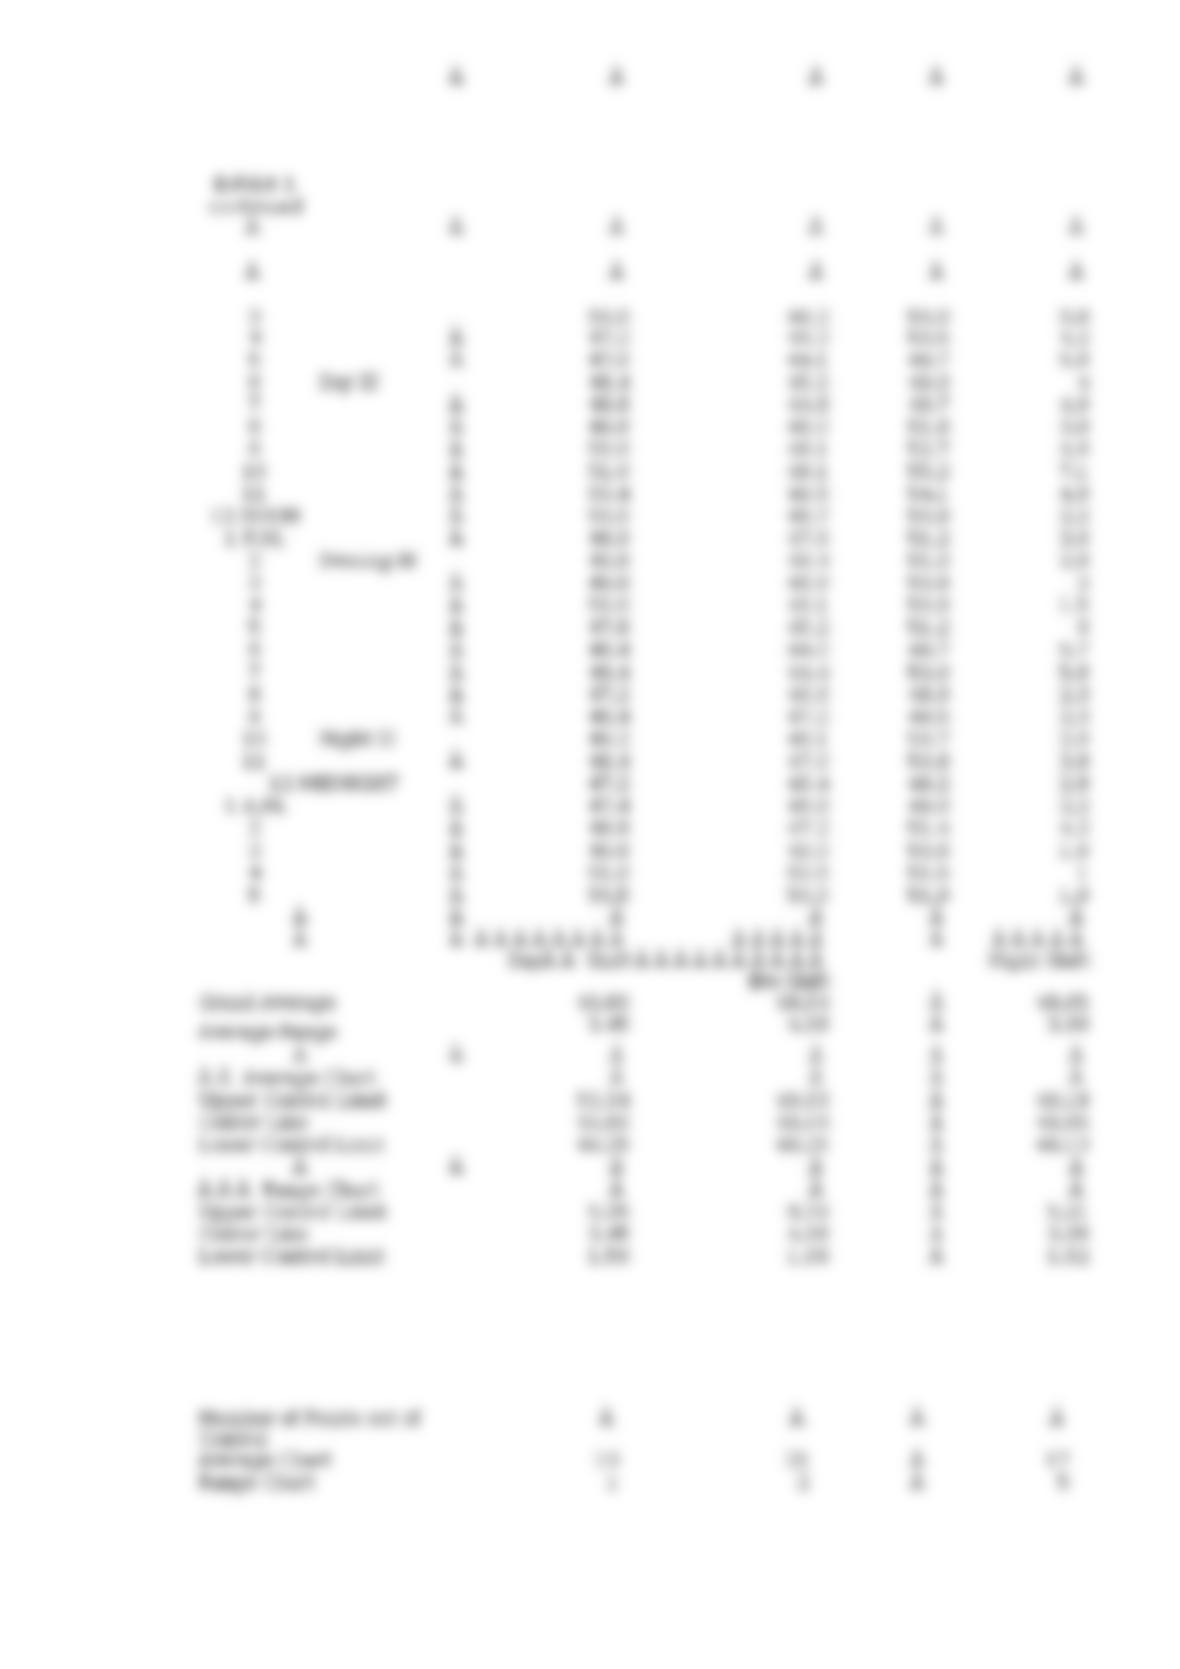
We have constructed both average and range charts from the data. The first average chart is
developed by using the day shift averages given in the case. Three day shifts consisting of
24 data points are given. These 24 points are averaged to obtain a grand average of 49.80.
Likewise, the evening and night shift averages are averaged to obtain grand averages of
48.94 and 48.65 as shown in Exhibit 1. The ranges for each of the samples are also
computed. These ranges are averaged by shift to arrive at average ranges of 3.45, 4.38, and
3.36 for the day shift, evening shift, and night shift respectively. We have now computed
the center lines for each of the control charts.
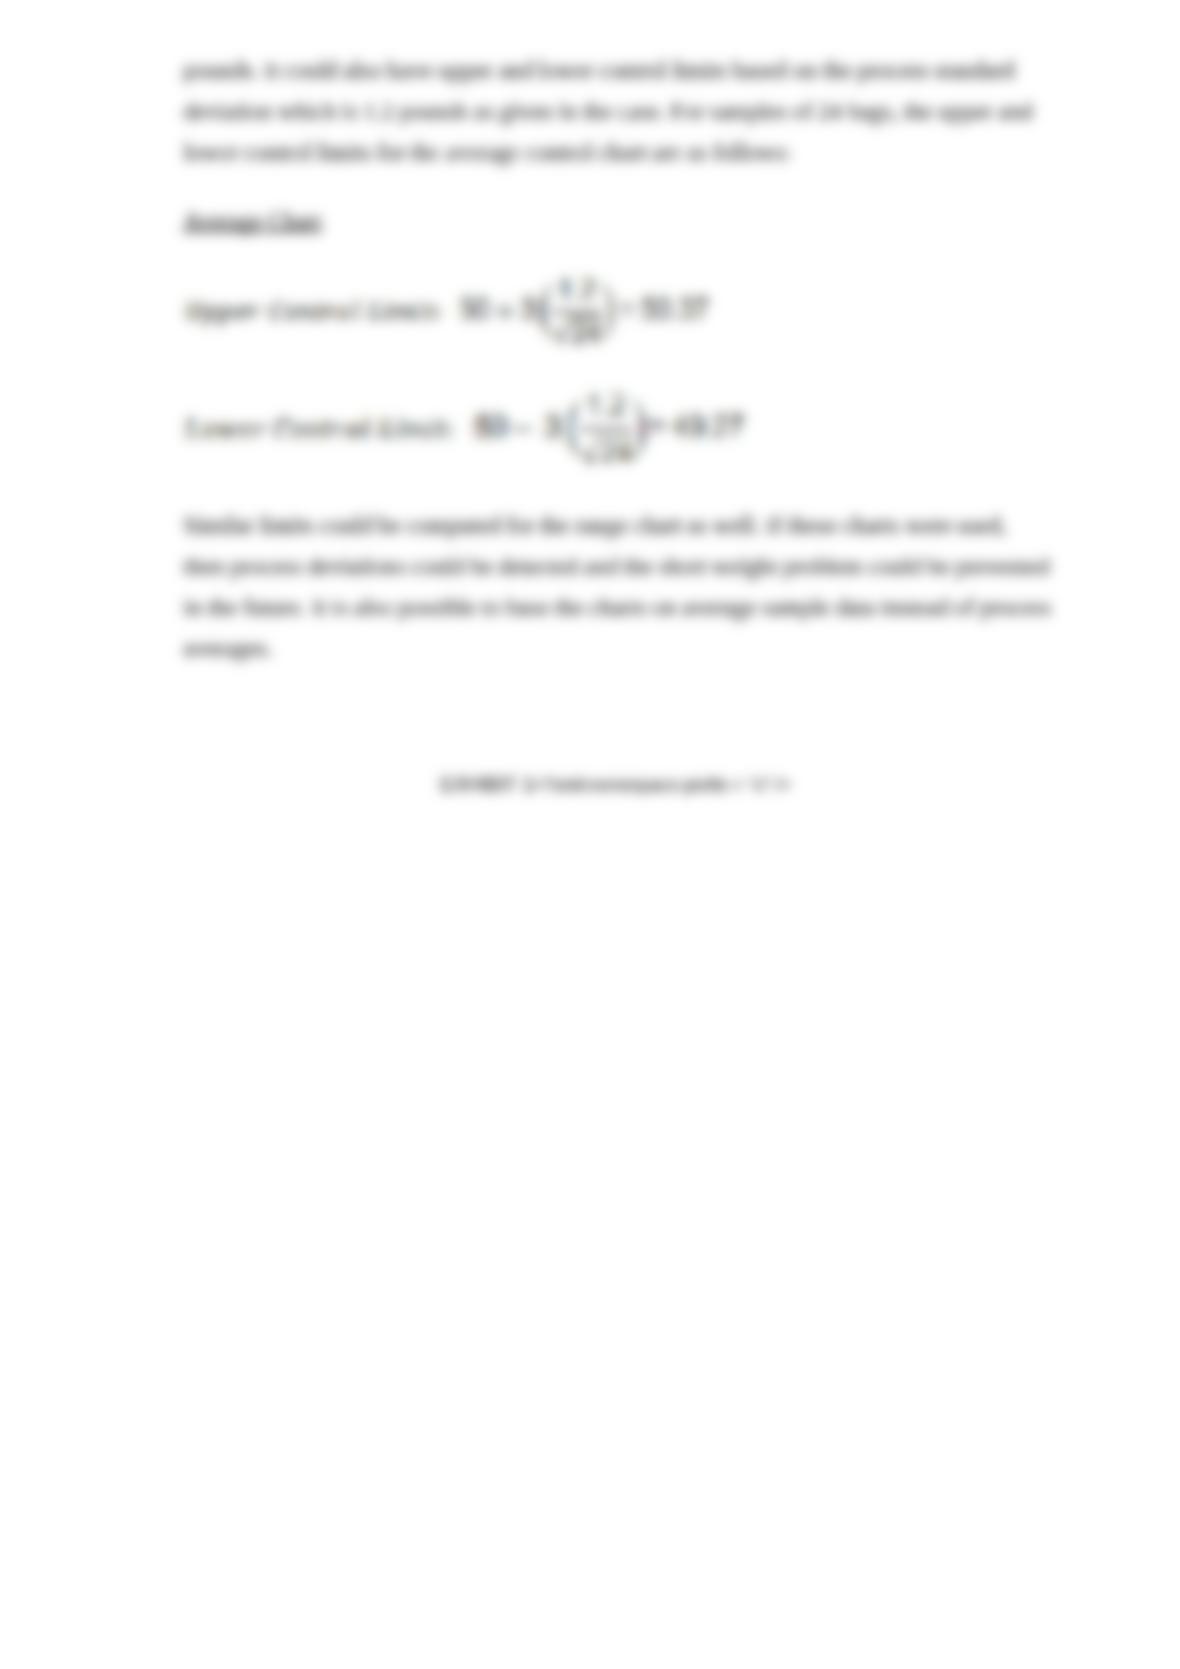
The upper and lower control limits for the average and range charts are computed in the