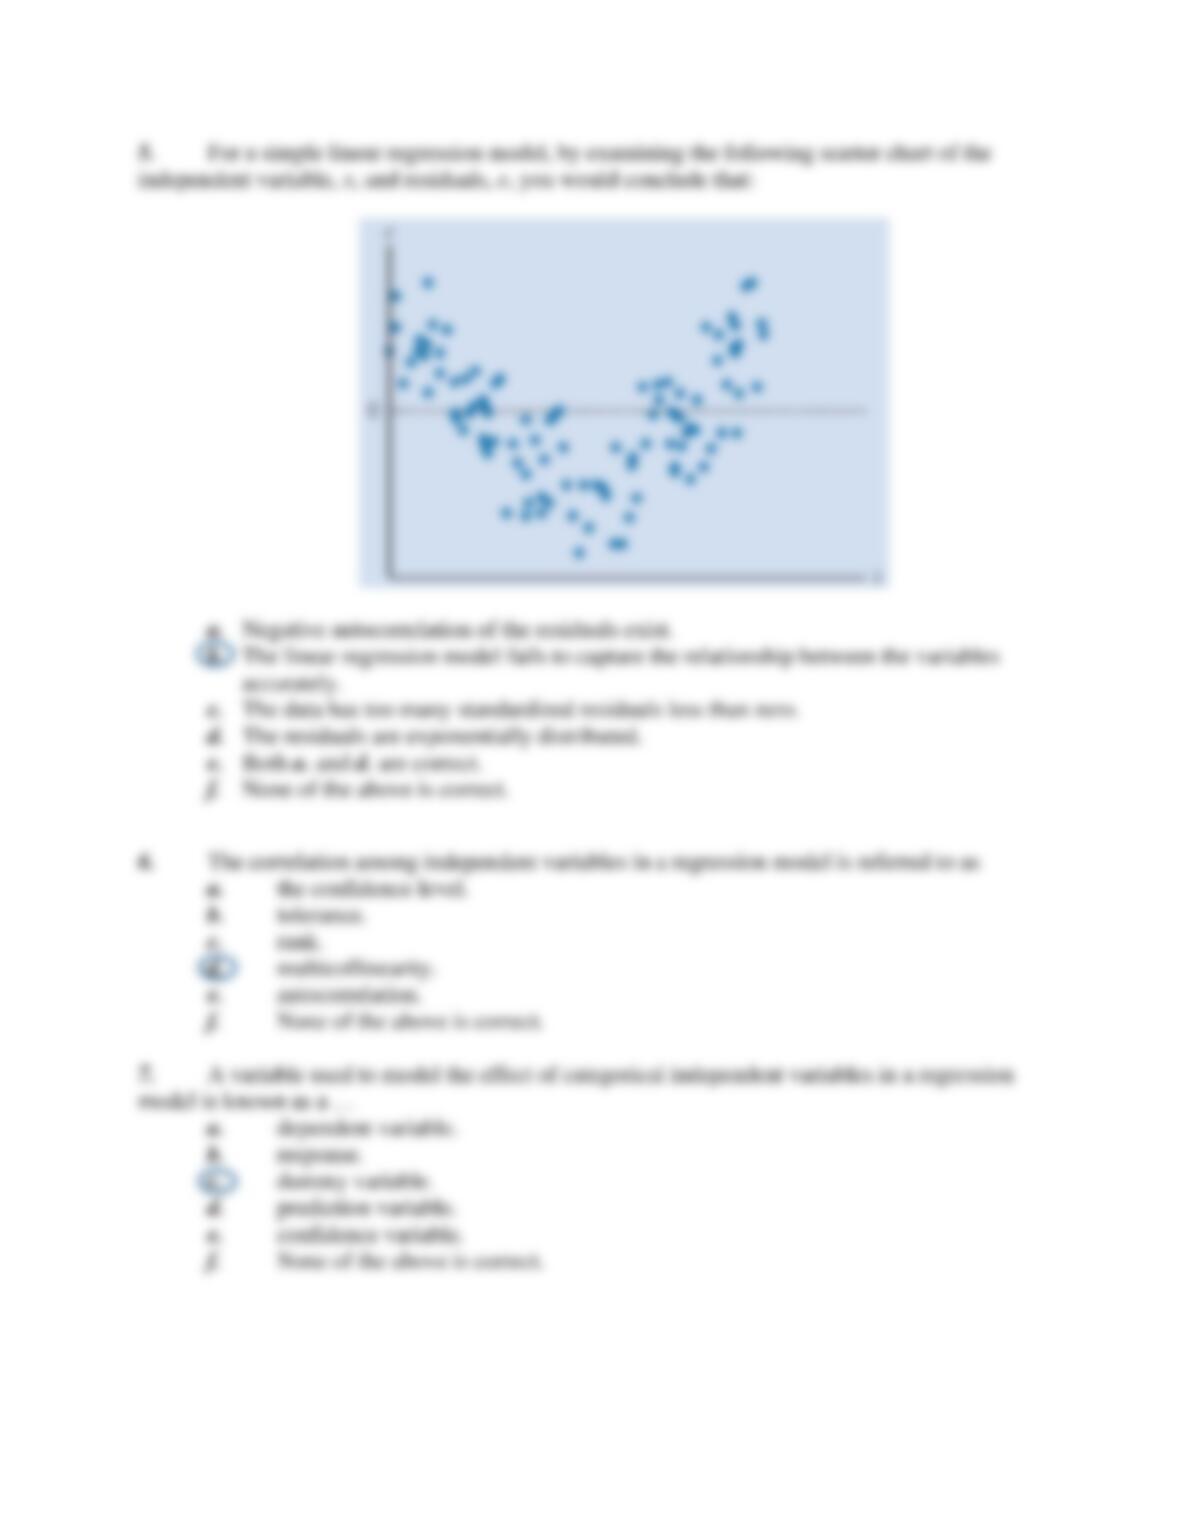
BANA 2082 “Business Analytics II”
Solutions for Examination #1 (20%)
6:00 P.M. – 8:50 P.M., Wednesday, October 1, 2014
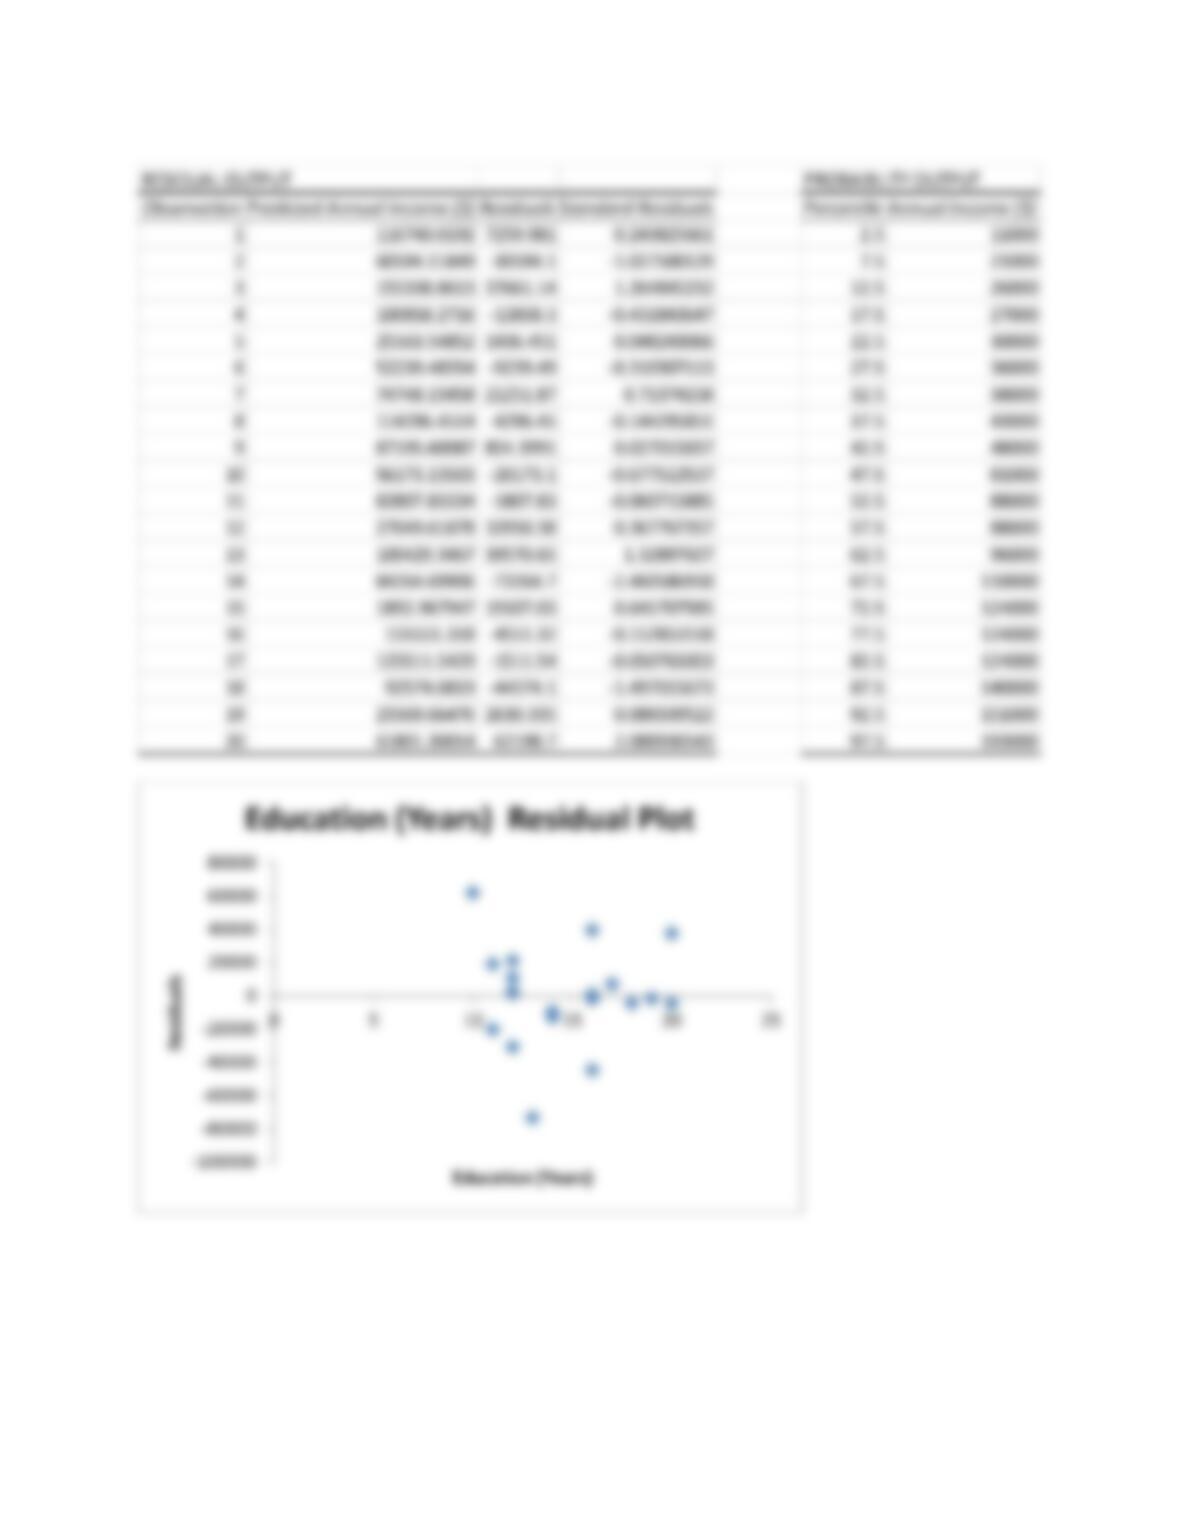
1. (25%) A survey was conducted by a Hewlett Packard (HP) research team to investigate
how education level, tenure in current employment with HP, and age, are related to annual
income. A sample of 20 HP employees was selected and the data is given below.
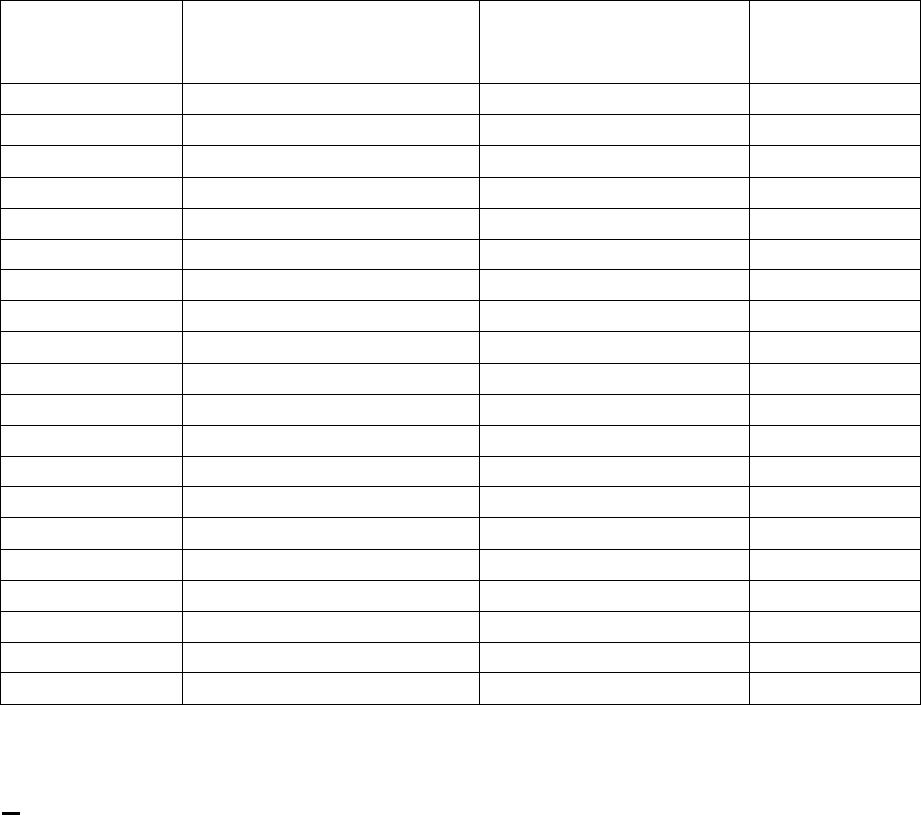
Education
(Years)
Length of Tenure in
Current HP Employment
(Years)
Age (Years)
Annual
Income ($)
17
8
40
124,000
12
12
41
30,000
20
9
44
193,000
14
4
42
88,000
12
1
19
27,000
14
9
28
43,000
12
8
43
96,000
18
10
37
110,000
16
12
36
88,000
11
7
39
36,000
16
14
36
81,000
12
4
22
38,000
16
17
45
140,000
13
7
42
11,000
11
6
18
21,000
20
4
40
151,000
19
7
35
124,000
16
12
38
48,000
12
2
19
26,000
10
6
44
124,000
Results from the EXCEL Data Analysis Regression procedure are included with this
examination.
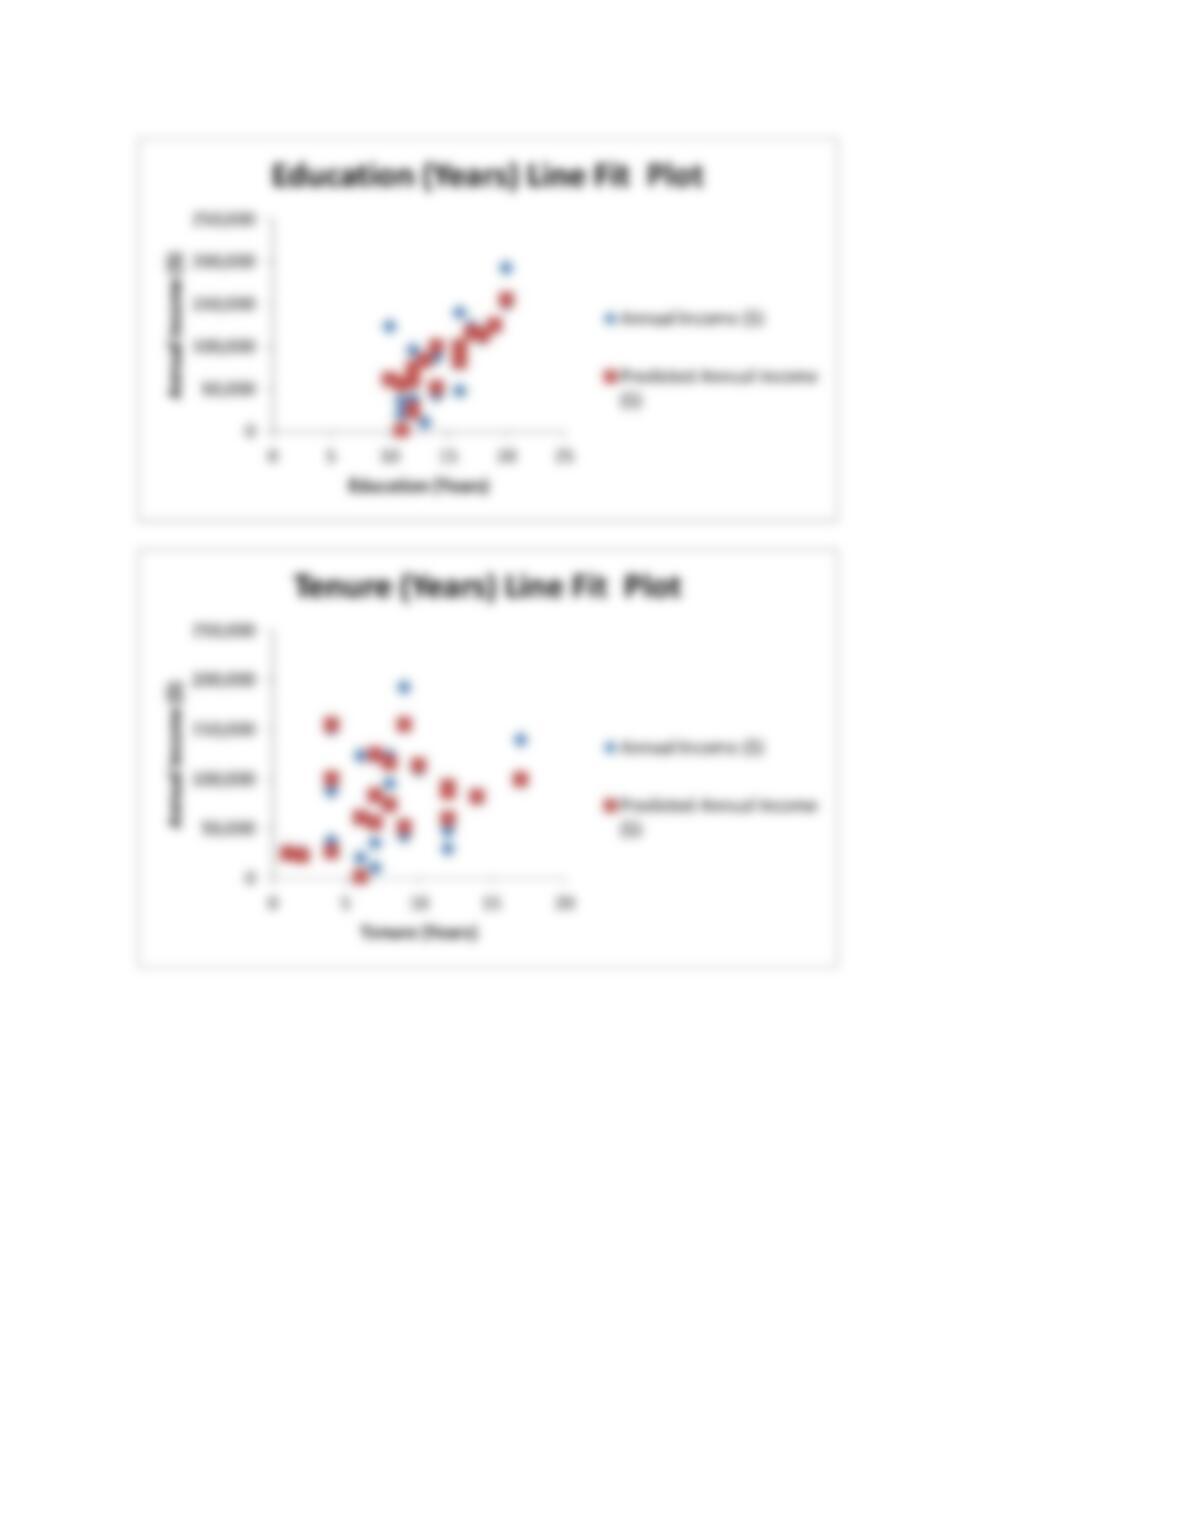
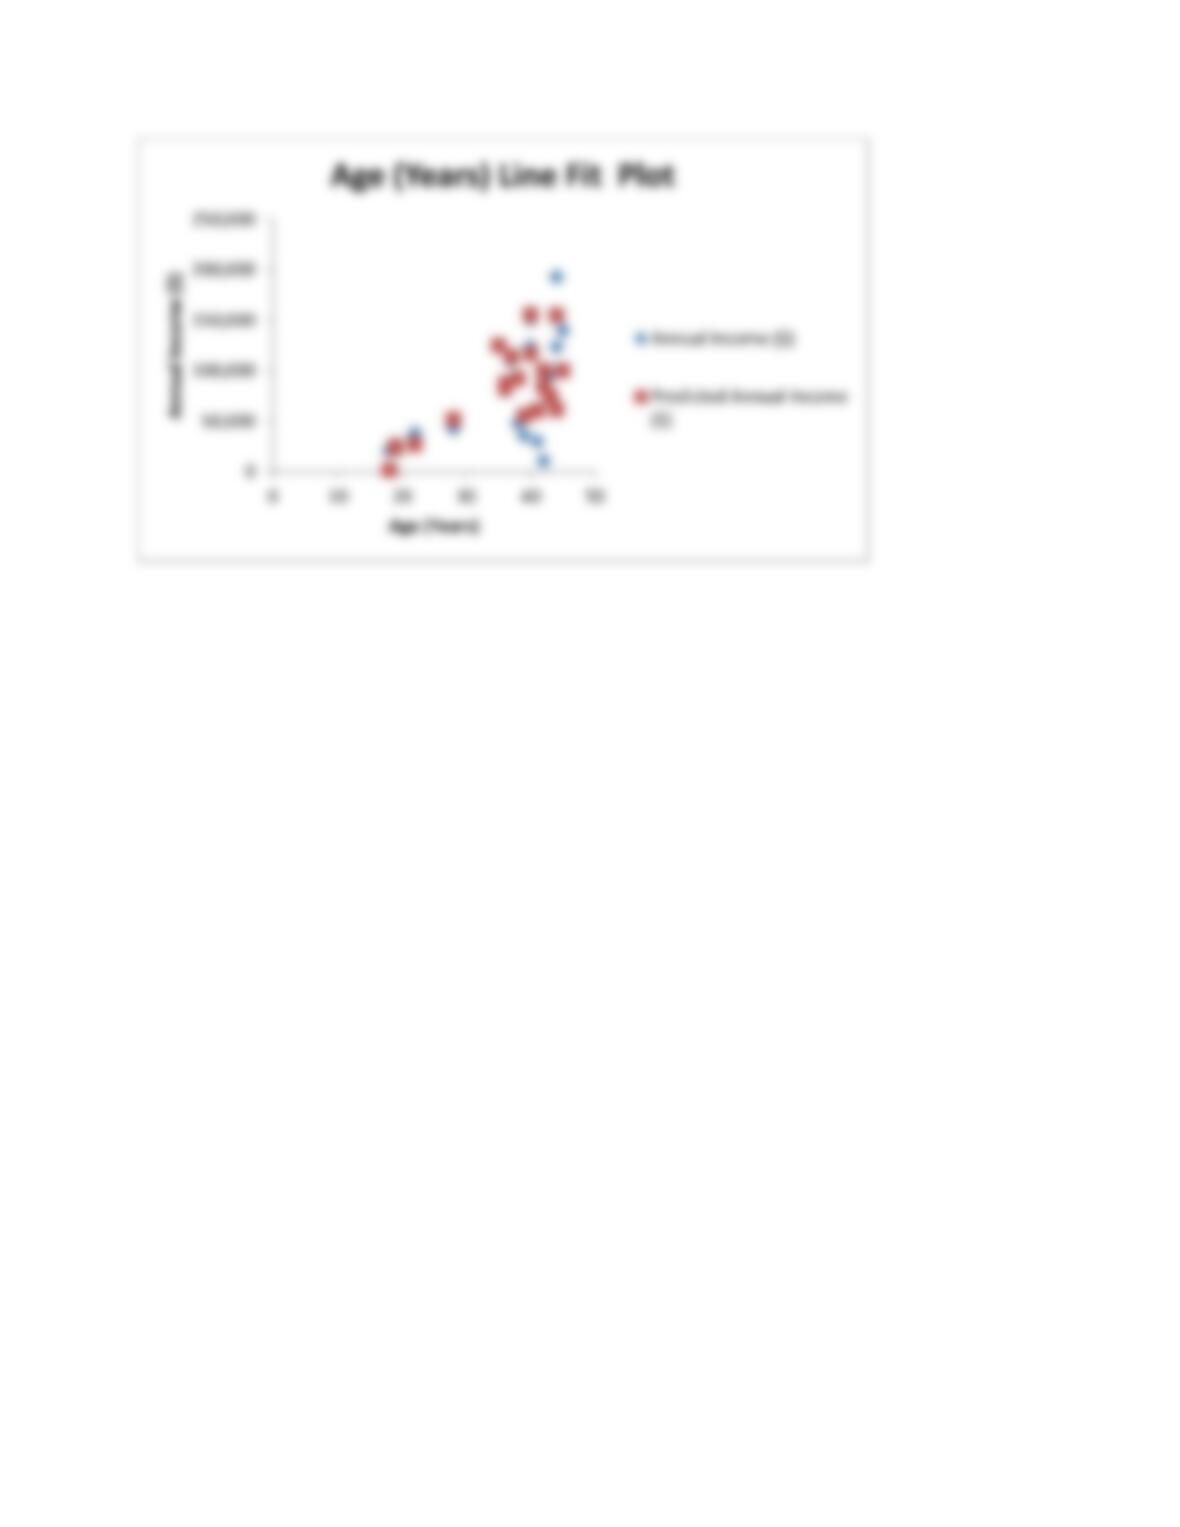
a. Provide the equation for this linear regression model. Let y=annual income,
x1=Education, x2=Tenure Length, and x3=Age. The model is:
𝒚
̂= −𝟏𝟒𝟑,𝟒𝟖𝟏.𝟏𝟗 +𝟏𝟎,𝟎𝟏𝟏.𝟗𝟐𝟏𝟐𝒙𝟏+ −𝟐, 𝟏𝟗𝟑.𝟖𝟖𝟑𝟖𝒙𝟐+ 𝟐, 𝟔𝟖𝟗.𝟐𝟒𝟎𝟓𝟐𝒙𝟑
b. The coefficient for variable “Age” is 2,689.24052. Interpret this value. For each additional
year of Age the employee is, the Annual Income for that employee is expected to increase by
$2,689.24052.

c. What proportion of the total variation in the model, the SST, is explained by the estimated
regression equation? Report the conservative value. Adjusted R2=0.60826404
d. Is a significant relationship found with the model in part a.? Circle One: Yes No
Why? Support your answer well: The F value for the entire model is 10.834 which is highly
significant at the 0.000393507 p-level.
e. Assume you are beginning with this solved model. For building the best model with a variable
selection technique, what model would you solve next? Explain why you selected this model.
Since the Tenure variable has a p-value of 0.324637926, it is not a significant variable and
should be deleted from the model. The next model to try would exclude x2 and be:
𝒚
̂= 𝒃𝟎+ 𝒃𝟏𝒙𝟏+ 𝒃𝟑𝒙𝟑
f. Identify any “outliers” in the original data set? Explain if you think they will be problematic
for this regression? Observation 20 is an outlier since it has a standardized residual =2.089
which is >2.0, but not by much. Observation 14 is an outlier since it has a standardized
residual =-2.460586918. Since these are the only 2 outliers out of 20 observations, the
regression results are sufficiently accurate.
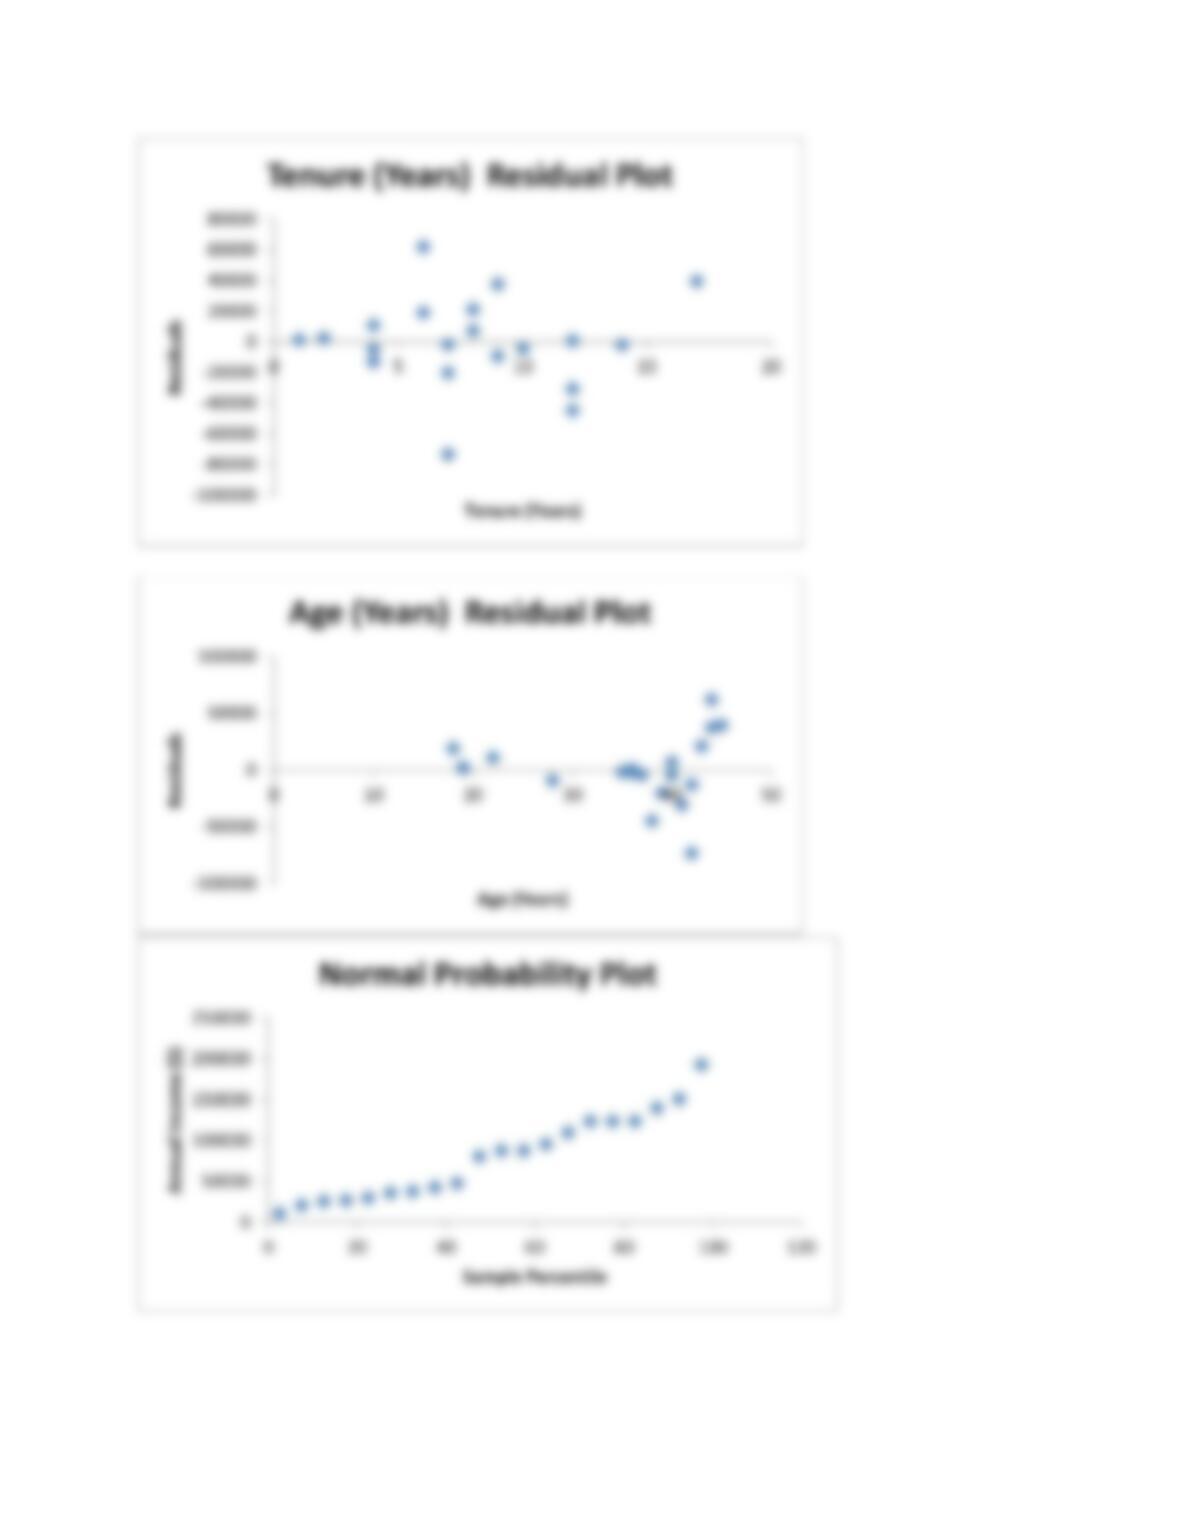
g. Is there any evidence that the assumptions for the error terms might be violated? Explain why
or why not. Examine the three graphs for the Residuals vs. the independent variables. The
graph for Residuals vs. Education and for Residuals vs. Tenure both have a plot that has a
mostly horizontal band of elements with a similar band width and the assumptions for the
error terms are adequately met. But, the Residuals vs. Age graph indicates a tendency for a
non-constant variance, i.e., the variance of ε is not the same, and that needs closer
examination.
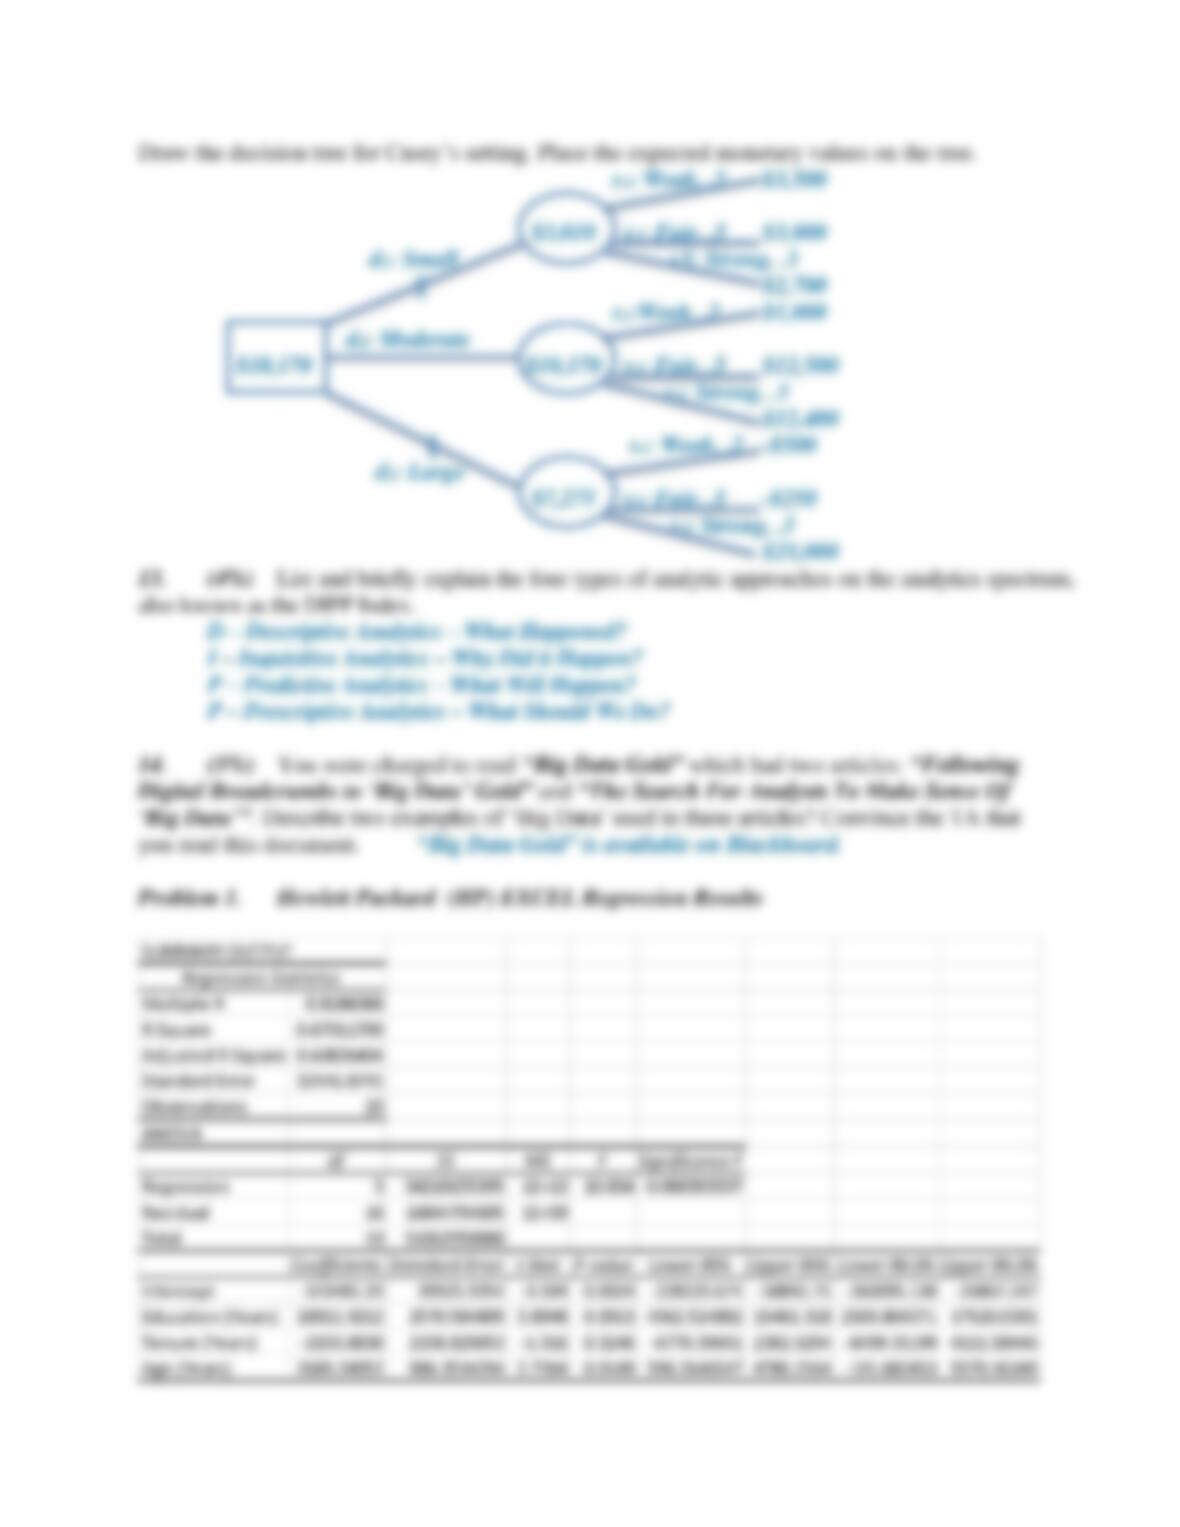
2. (25%) The Sedalia City Council is preparing to build a new community center to be used for
conventions, concerts, and other public events, but controversy surrounds the appropriate size.
Several citizens want a large center that would be a showcase for the area but the mayor feels that if
demand does not support such a center, Sedalia could lose a large amount of money. The Council
narrowed the building alternatives to three sizes: 10,000 square feet, 20,000 square feet, and 30,000
square feet. They suggested using net cash flow over a five-year planning horizon as the criterion for
the best decision. The following are projections of net cash flow for a five-year panning horizon. All
costs, including the consultant’s fee, have been included. The demand scenarios are all considered to
be equally likely.
In $1,000’s Center Size (Square Feet)
Demand Scenario 10,000 20,000 30,000
Worst Case 400 –250 –400
Base Case 500 650 580
Best Case 660 800 990
Minimum: 400 –250 –400
a. What is the maximax decision and associated payoff? 30,000 Square Feet, $990,000
b. What is the maximin decision and associated payoff? 10,000 Square Feet, $400,000
c. Develop a Regret Table.
In $1,000’s Center Size (Square Feet)
Demand Scenario 10,000 20,000 30,000
Worst Case 0 650 800
Base Case 150 0 70
Best Case 330 190 0
Maximum: 330 650 800
d. What is the minimax regret decision and associated loss? 10,000 Square Feet, $330,000
e. What are the expected monetary values for the decision possibilities? Which decision is
preferred for this analysis?
EMV(10,000)=1/3(400,000)+1/3(500,000)+1/3(660,000)=$520,000 Preferred
EMV(20,000)=1/3(-250,000)+1/3(650,000)+1/3(800,000)=$400,000
EMV(30,000)=1/3(-400,000)+1/3(580,000)+1/3(990,000)=$390,000
f. What is the expected value of perfect information?
EVPI=EOL(d*)=EOL(10,000)=1/3(0)+1/3(150,000)+1/3(330,000)=$160,000
g. Now assume that the probability for the Best Case has doubled and the probabilities for the
other cases have been halved. How would your answers to e. and f. change?
EMV(10,000)=1/6(400,000)+1/6(500,000)+2/3(660,000)=$590,000
EMV(20,000)=1/6(-250,000)+1/6(650,000)+2/3(800,000)=$600,000
EMV(30,000)=1/6(-400,000)+1/6(580,000)+2/3(990,000)=$690,000 Preferred
EVPI=EOL(d*)=EOL(30,000)=1/6(800,000)+1/6(70,000)+2/3(0)=$145,000
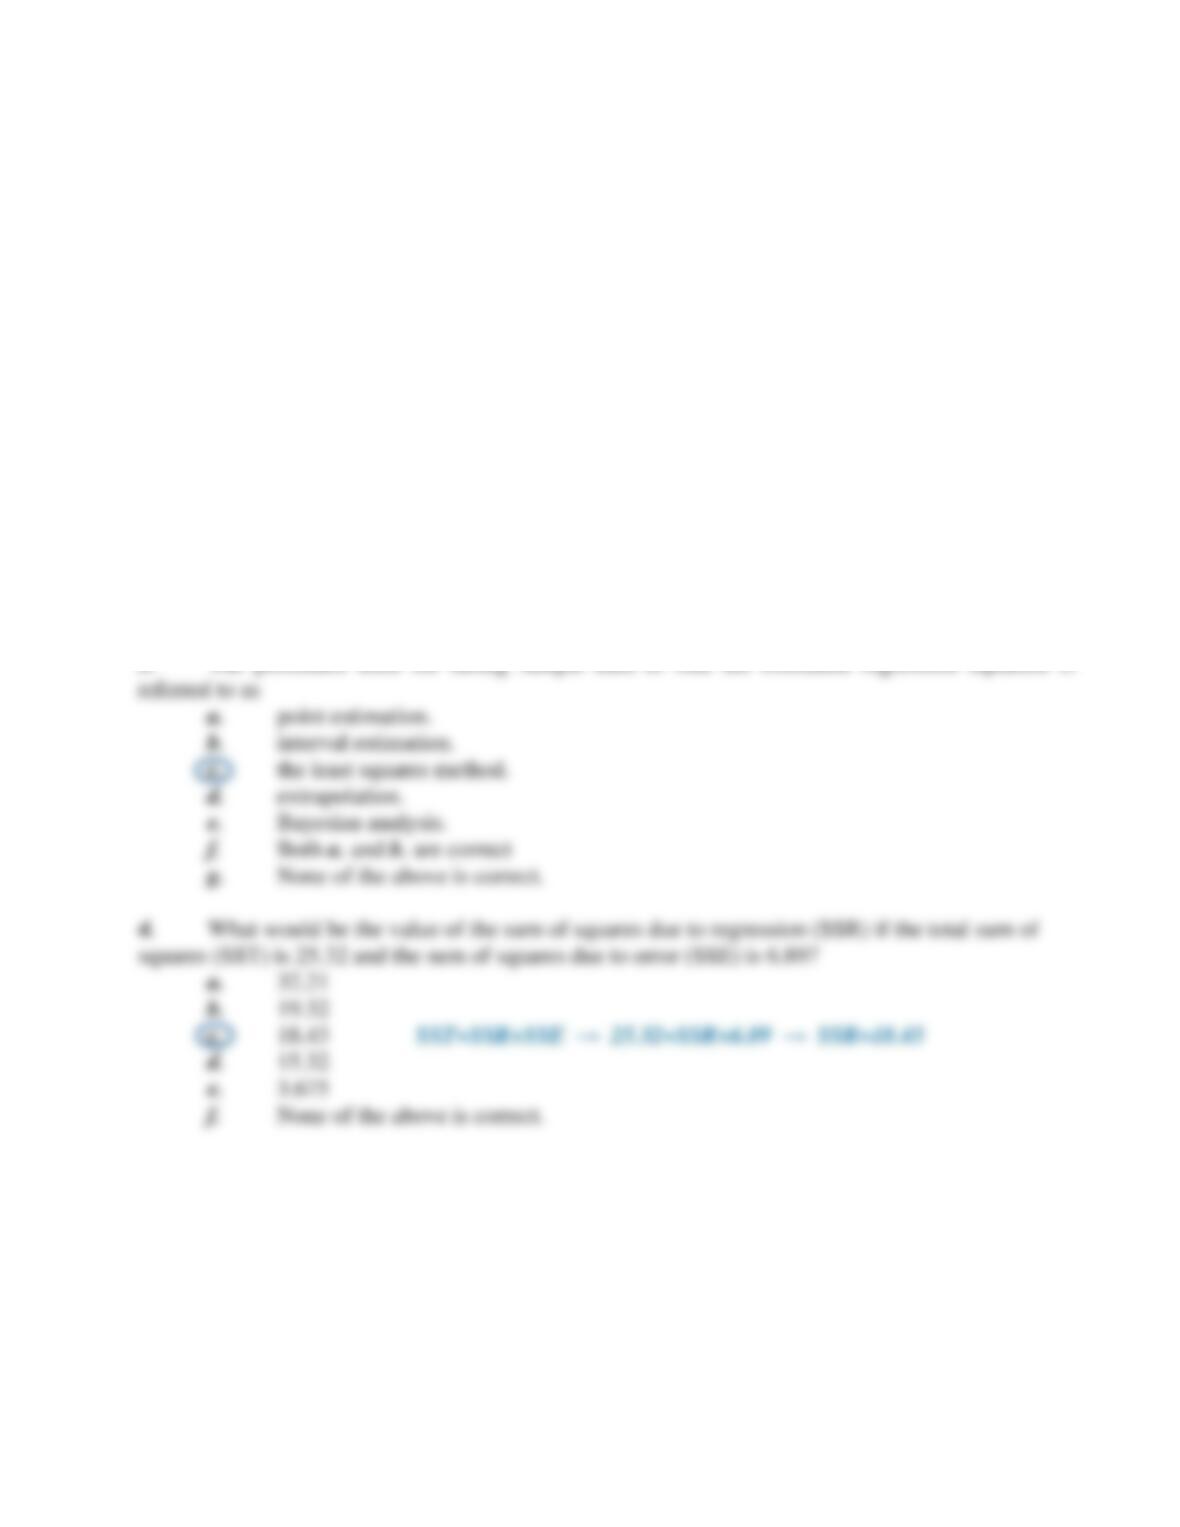
Multiple Choice (3% Each): Circle the letter corresponding to the best single answer.