Alina Ibragimova BA14-1
Market entry/ country report
Company Baltic Beverage Holding
Question
1. What is the company’s stage of internationalization?
2. How successful have they been in their internationalization efforts? What are the main
international marketing lessons (if any) that can be learned from their past
internationalization experiences?
3. How much emphasis should the company put on its internationalization process? Why?
Should the company devote significant resources to the internationalization process?
4. What are the main criteria that the company should use to identify new
countries/markets to enter? Why?
4. Search through newspapers, magazines, and periodicals (e.g. the Economist’s country
reports) for recent marketing events (e.g. articles about new companies entering the
market, competition, ad campaigns, etc). What do these tell you about consumers,
competition, and marketing in this country? What support may home country institutions
(government, banks, industry associations) provide?
5. Other marketing implications: What types of products or services would be suited for
introduction into this country or region? Why? Which ones wouldn’t be? Why not?
1. What is the company’s stage of internationalization?
BBH is located in Russia with parent company in Sweden
2. How successful have they been in their internationalization efforts? What are the
main international marketing lessons (if any) that can be learned from their past
internationalization experiences?
Parent company has little decision making in daily activities, while BBH makes the
decision on the use of the marketing mix for the Eastern European countries and Russia.
3. How much emphasis should the company put on its internationalization process?
Why? Should the company devote significant resources to the internationalization
process?
Product – increase product specialization
Price – allow great flexibility and response for a change
Promotion – create promotional mix which will be a competitive advantage
Place – distribution wise decisions
People – career opportunities
Process – head office control
Packaging – to identify target market
Profit – cost-efficiency due low-cost of transportation
4. What are the main criteria that the company should use to identify new
countries/markets to enter? Why?
Polish economy is stable and sustainable – namely a high quality stock of human capital,
its
greatest inherent strengths – a highly educated, IT-enabled workforce that is benefiting
from the addition of about 100,000 science and engineering graduates each year.
An extraordinary entrepreneurial spirit: India has a much deeper and broader stable of very
powerful businesses. In terms of strategic vision, innovation, execution focus, and
cost-efficiency management, India’s corporate leaders has a huge advantage when
compared with their counterparts in any other country in the world, but it is likely to be a
major plus for Europe as it fights for market share in the global competitive markets in the
coming years.
Country analysis
1. Economic environment
a) Population: total; growth rates; density; distribution by age and gender;
urban-rural split; ethnic groups; immigration
Poland – the Republic of Poland (Polish: Rzeczpospolita Polska; Kashubian: Plsk
Repblika), is a country in Central Europe, bordered by Germany to the west; the Czech
Republic and Slovakia to the south; Ukraine, Belarus to the east; and the Baltic Sea and
Kaliningrad Oblast, a Russian exclave, and Lithuania to the north. The total area of Poland
is 312,679 square kilometres (120,726 sq mi), making it the 69th largest country in the
world and the 9th largest in Europe. Poland has a population of over 38.5 million people,
which makes it the 34th most populous country in the world and the sixth most populous
member of the European Union.
Poland is a member of the European Union, NATO, the United Nations, the World Trade
Organization, the Organisation for Economic Co-operation and Development (OECD),
European Economic Area, International Energy Agency, Council of Europe, Organization
for Security and Co-operation in Europe, International Atomic Energy Agency, European
Space Agency, G6, Council of the Baltic Sea States, Visegrd Group, Weimar Triangle and
Schengen Agreement.
Poland has a great, long standing tradition of tolerance towards minorities, as well as
absence of discrimination on the grounds of religion, nationality or race. This is for
historical reasons and that is ethnic minorities in Poland are very few. It has a high level of
gender equality, promotes disability rights movement and promotes equality. As many as
96.7% of Polish citizens declare to be Poles, and 97.8% declare that they speak Polish at
home (Census 2002). The population of Poland became one of the most ethnically
homogeneous in the world as a result of the radically altered borders after World War II
and the subsequent migrations.
Communist dogma failed to change the intellectual or spiritual outlook of most Poles,
however, because traditional institutions such as the Roman Catholic Church and the
family remained strong support structures for alternative viewpoints. On the other hand,
the institutions created by the communist regimes fundamentally influenced the day-to-day
functions of Polish society.
Demographically, Poland in 1992 was a young country, more than 64 percent of whose
population was under forty years of age. The country also had one of Europe’s highest
birth rates. By 1980 nearly half of employed Poles belonged to a socioeconomic group
different from that of their parents, showing the mobility of the younger generations across
traditional class lines. By 1980 less than one-quarter of working Poles remained in
agriculture, and about two-thirds were either manual or white-collar workers in urban
areas. About one-third of the postwar intelligentsia came from worker families, while
about one-quarter came from peasant families. These numbers represented a drastic change
from the predominance of the aristocracy in the intelligentsia before World War II.

In 1989 Poland had twenty-four cities with populations of at least 150,000 people. Major
urban centers are distributed rather evenly through the country; the most concentrated
urban region is the cluster of industrial settlements in Katowice District. In 1990 overall
population density was 121 people per square kilometer, up from 115 per square kilometer
in 1981. The most densely populated places are the cities of уd (over 3,000 people per
square kilometer) and Warsaw (about 2,000 people per square kilometer). Urban areas,
which contain over 60 percent of Poland’s population, occupy about 6 percent of the
country’s total area. In 1990 average population density in rural areas was fifty-one people
per square kilometer, a small increase over the 1950 figure of forty-seven people per
square kilometer.During most of its history, Poland was a multiethnic society that included
substantial numbers of Belarusians (prior to 1992 known as Belorussians), Germans, Jews,
and Ukrainians. This ethnic diversity was reduced sharply by World War II and the
migrations that followed it. The Jewish population, which in the interwar period was over
10 percent of Poland’s total and over 30 percent of Warsaw’s, was reduced by about 3
million in the Holocaust. Postwar resettlement and adjustment of borders sent about 2
million Germans from Polish territory westward and awarded the Polish territory inhabited
by 500,000 Ukrainians, Belarusians, and Lithuanians to the Soviet Union. These
multiethnic йmigrйs were replaced by an estimated 3 million ethnic Poles repatriated from
the Soviet Union and by thousands of others who returned from emigration or combat in
the West. (Poland’s communist governments, which consistently emphasized ethnic
homogeneity, had not differentiated ethnic groups in official census statistics.) As a result
of this process, in 1990 an estimated 98 percent of Poland’s population was ethnically
Polish.
b) GNP or GDP: total, rate of growth, per capita POLAND GDP
The Gross Domestic Product (GDP) in Poland was worth 514.50 billion US dollars in
2011. The GDP value of Poland represents 0.83 percent of the world economy. GDP in
Poland is reported by the The World Bank Group. Historically, from 1985 until 2011,
Poland GDP averaged 207.4 USD Billion reaching an all time high of 529.4 USD Billion
in December of 2008 and a record low of 59.0 USD Billion in December of 1990. The
gross domestic product (GDP) measures of national income and output for a given
country’s economy. The gross domestic product (GDP) is equal to the total expenditures
for all final goods and services produced within the country in a stipulated period of time.
This page includes a chart with historical data for Poland GDP.
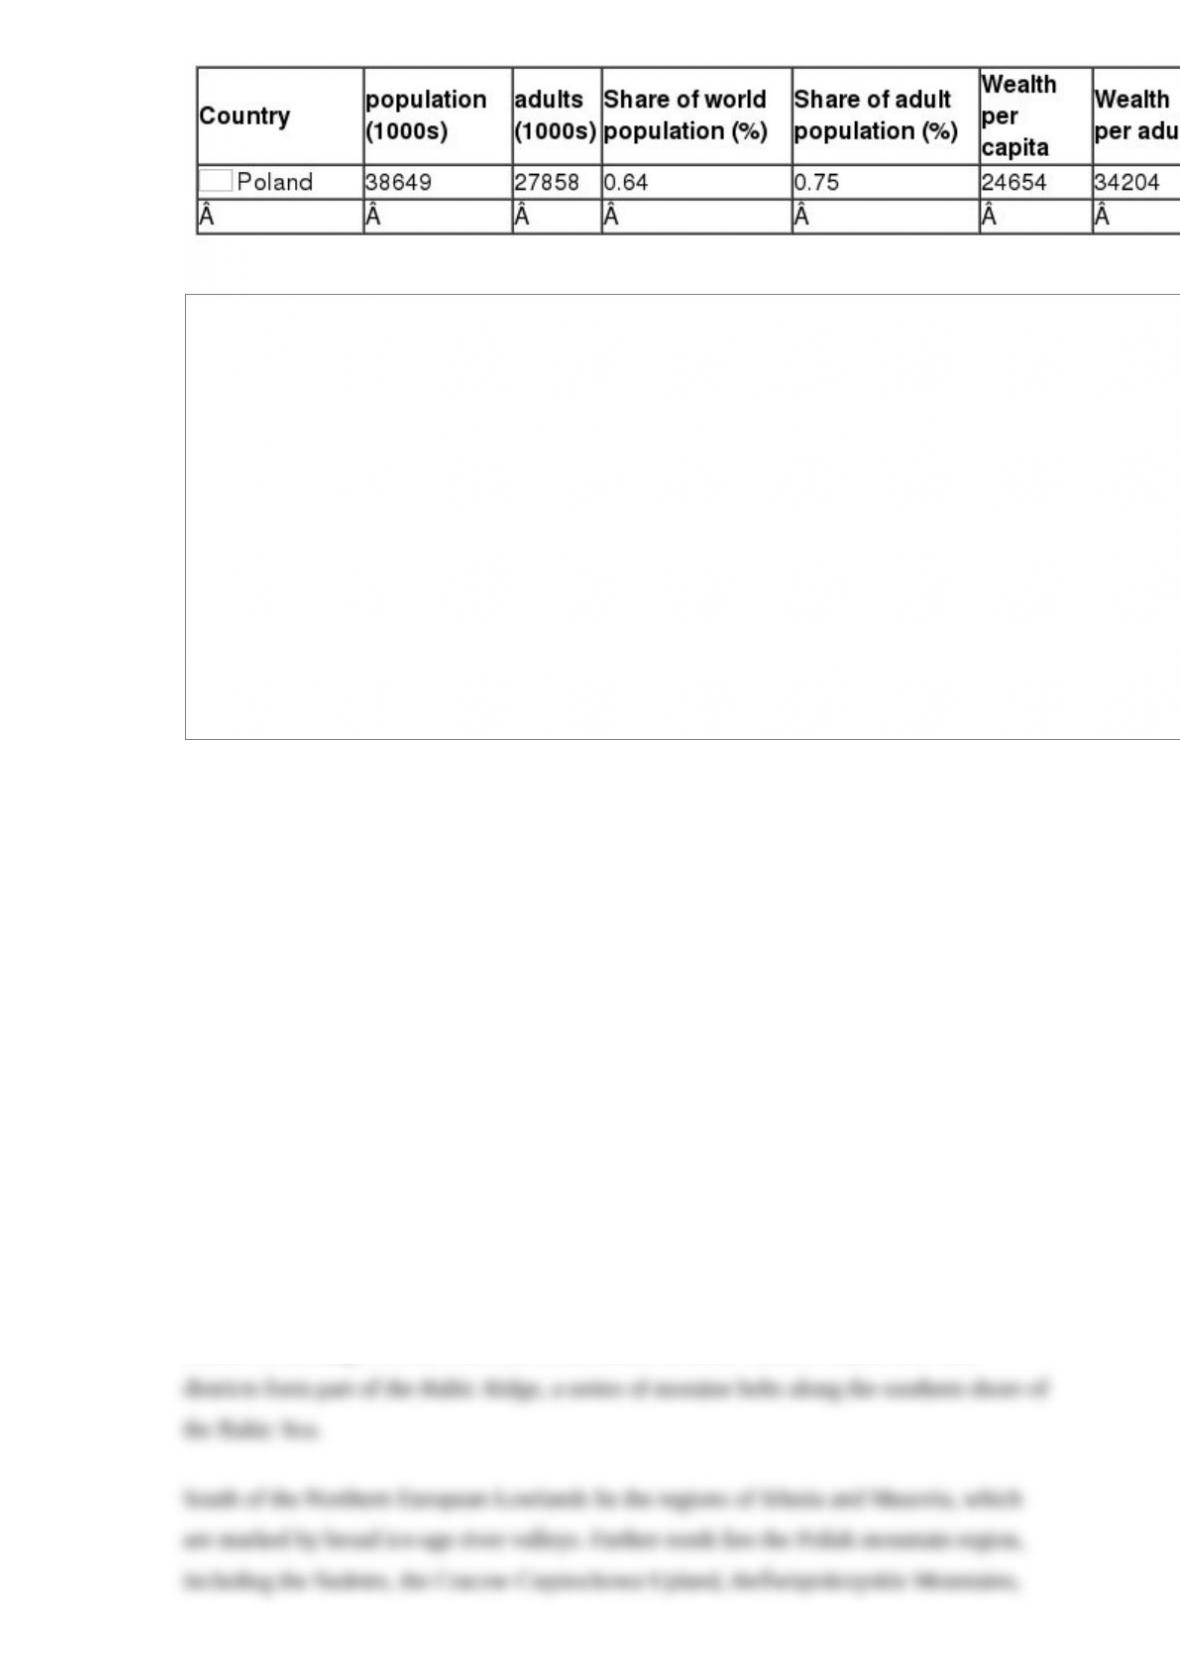
c) Distribution of wealth
d) Geography: location, climate, topography, minerals and resources Poland’s territory
extends across several geographical regions, between latitudes 49° and 55° N, and
longitudes 14° and 25° E. In the north-west is the Baltic seacoast, which extends from the
Bay of Pomerania to the Gulf of Gdańsk. This coast is marked by several spits, coastal
lakes (former bays that have been cut off from the sea), and dunes. The largely straight
coastline is indented by the Szczecin Lagoon, the Bay of Puck, and the Vistula Lagoon.
The centre and parts of the north lie within the North European Plain.
Rising gently above these lowlands is a geographical region comprising the four hilly
districts of moraines and moraine-dammed lakes formed during and after the Pleistocene
ice age. These lake districts are the Pomeranian Lake District, the Greater Polish Lake
District, the Kashubian Lake District, and the Masurian Lake District. The Masurian Lake
District is the largest of the four and covers much of north-eastern Poland. The lake