Logistic Regression Model BADM 7020 Assignment #5
Business Understanding: A University will use predictive
analytics to understand if on-campus living increases the odds
of graduating within 5 years and then predict whether a
student graduates from the university. Using a logistic
regression model, the University can explain if on-campus
living effects graduation rates and if any other factors play a
role in the statistical significance of on-campus living. The
University can then use the data found to make decisions on
future policy, campus housing, etc. in hopes of increasing
overall graduation rates. Furthermore, the logistic regression
model allows the University to predict what students may not
graduate within 5-years. Thus, further helping the University
make policy, enrollment, and financial decisions.
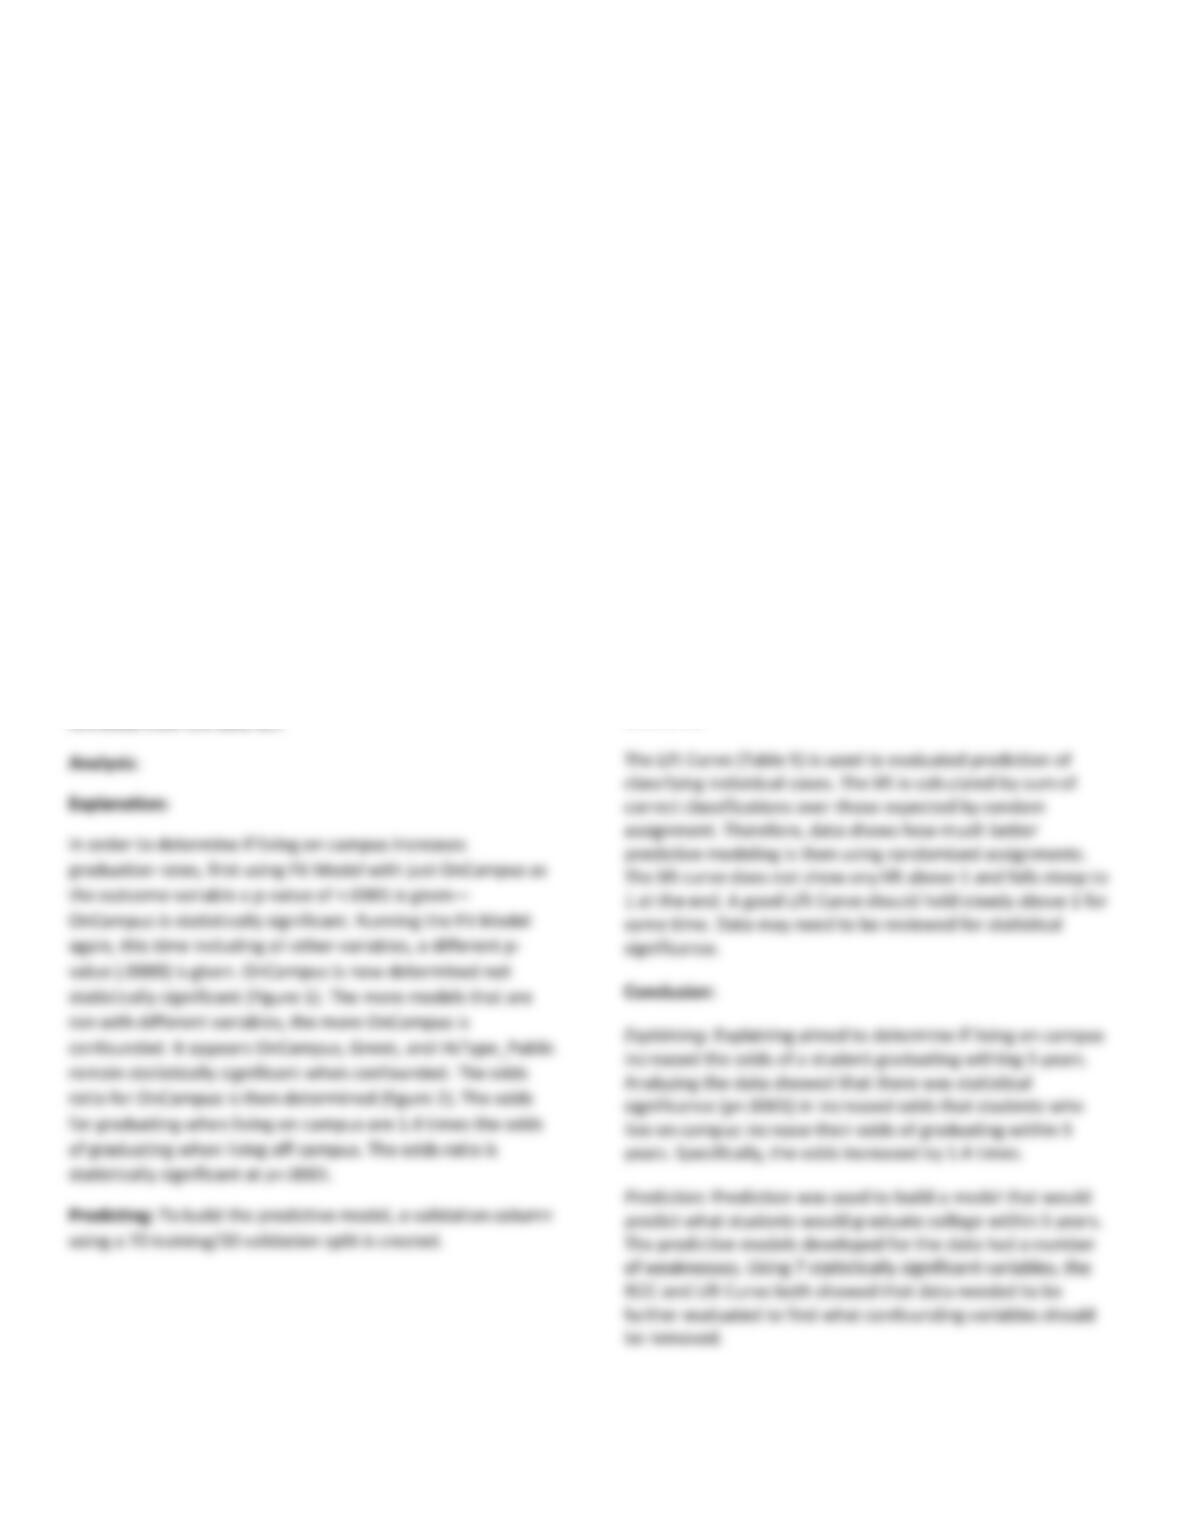
Data Understanding: The University identified 9 predictive
variables that potentially influence graduation rate. Gender,
Race, GRAD-BUS5, Pelican, Distance, HsType_Public, Greek,
and OnCampus were all identified as character nominal
variables. Race was bin using recode, so that data followed
the census categories for race. Distance had extra categories
that were re-coded to either 60m less or 60m more.
HsType_Public has unknown variables that were sent to
missing. ACT, MATHACT, and HsAGPA were identified as
numerical continuous. HsAGPA had 6 variables missing and
Confusion Matrix:
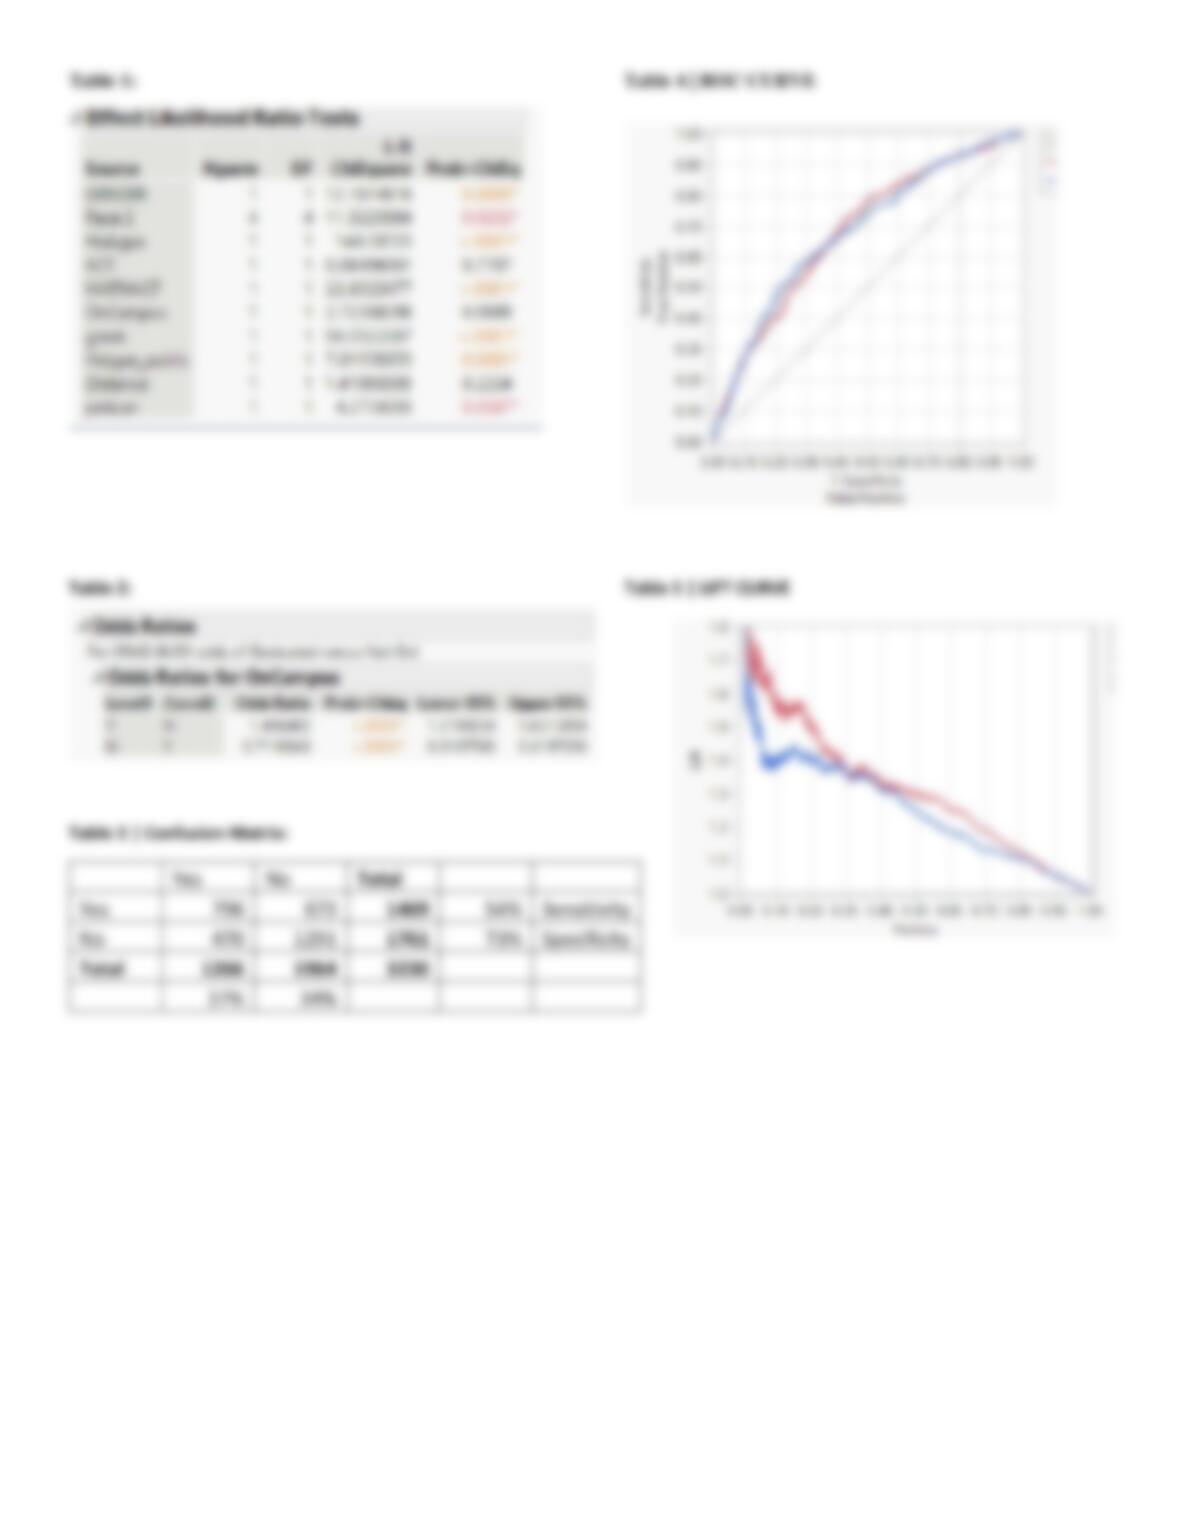
A confusion matrix for the created validation set is used to
evaluate the effectiveness of the model (Table 3). The error
rate is 37%. For graduated students, the model correctly
classifies 54% of the time, as defined by sensitivity. For non-
graduated students, the model correctly predicts no
graduation 73% of the time, as defined by specificity. The
model has a false positive rate, which is the percentage of
positive predictions that are wrong, of 37%. The model has a
false negative rate, which is the percentage of wrong
negative predictions, of 34%. Therefore, the model is better
at predicting students that will graduate, then students that
will not graduate. When using this information to predict data
collected, it will be important to thoroughly research the
statistical significance of factors used.
ROC Curve:
The ROC curve (Table 4) is used to measure the probability
that what is being observed belongs to class 1 (on a 0 to 1
scale). Using a cutoff value of .5 to decide the probability of
belonging to class 1, at .6832, this is large enough to warrant
classification.
Lift Curve: