THE IMPACTS OF VARIOUS TAXES ON FOREIGN DIRECT INVESTMENT
By Stacie Beck*
Department of Economics
University of Delaware, Newark, DE 19716
Tel. (302) 831-1915
Fax (302)-831-6968
beck@udel.edu
and
Alexis Chaves
Bureau of Economic Analysis
1441 L Street, NW
Washington, DC 20230
Alexis.Chaves@bea.gov
January 2012
*Corresponding author.
The views expressed in this paper are solely those of the authors and not necessarily those of the
U.S. Bureau of Economic Analysis or the U.S. Department of Commerce.
2
THE IMPACTS OF VARIOUS TAXES ON FOREIGN DIRECT INVESTMENT
ABSTRACT
Previous work on the effect of taxes on foreign direct investment (FDI) focused
primarily on capital income taxes. We investigate the proposition that other forms of taxation
may also affect FDI. We use tax ratios, i.e., average effective tax rates, on consumption, labor
and capital income for a panel of 25 OECD countries from 1975-2006. We find that increases in
relative tax rates on capital income encourage net FDI outflow whereas increases in labor income
tax rates have the opposite effect. Increases in relative consumption tax rates have insignificant
impacts.
JEL: F21, H20, C33
Keywords: Tax Ratio, Foreign Direct Investments
3
THE IMPACTS OF VARIOUS TAXES ON FOREIGN DIRECT INVESTMENT
Tax policy typically emerges as one of the leading points in a discussion of factors
that can either attract or drive away foreign direct investment (FDI). However, most previous
studies of tax impact on FDI are concerned with taxes levied on corporations or on capital
income. Little attention has been paid to other types of taxes, such as those exacted on workers
or consumers. However, it is possible that other taxes have an influence on FDI as well. Taxes on
labor income and consumption impact the return on work effort. While labor supply may be
inelastic in the short run, so that tax incidence falls on workers, in the longer run labor supply
elasticity is higher. If so, labor income and consumption taxes raise wage costs to employers.
High wage costs could cause domestic firms to substitute capital for labor, thus reducing their
funds for investment abroad. On the other hand, an economy with high wage costs may
experience outflows of investment funds as corporations outsource their production.
We find that the impact of increased labor income tax rates on foreign direct
investment outflows is significantly negative whereas the impact of increased consumption taxes
is insignificant. We find that the impact of increased capital income tax rates on foreign direct
investment outflows is significantly positive. However, our estimates of the impact of capital
income tax changes, which control for labor income and consumption tax changes, are larger on
average than those found elsewhere in the literature.
I. Previous Literature
Previous literature has established a relationship between FDI and one category of
taxes: capital income taxes. De Mooij and Ederveen (2003; 2008) provide useful overviews.
After removing outliers, they calculate a mean value tax elasticity of -3.3, suggesting that a 1
percent reduction in the host country rate of tax on capital would increase total FDI inflows by
3.3 percent. Studies of the impacts of other forms of taxation on FDI are scarce. Egger and

4
Radulescu (2008) examine labor tax impacts on the location of foreign subsidiaries and find that
both the capital income tax rate and the constructed labor income tax rate have a negative
relationship to the prevalence of subsidiaries or branches of foreign owned corporations. Deasi,
et al. (2004) also find evidence that indirect taxes (taxes other than payroll and corporate income
taxes) depress FDI. However, their study does not distinguish between taxes on capital, labor and
consumption as ours does.
II. Model Specification
We use a gravity model specification to model bilateral FDI outflows, based upon their
success elsewhere in the literature (e.g., Eaton and Tamura, 1994; Razin, et al., 2002; Bénassy-
Quéré et al., 2001).
1
The specification used here is:
ln(𝐹𝐷𝐼𝑖𝑗𝑡)=𝛽0+𝛽1ln𝐺𝐷𝑃𝑖𝑡
+𝛽2ln𝐺𝐷𝑃𝑗𝑡 +𝛽3 𝐷𝑖𝑠𝑡𝑎𝑛𝑐𝑒𝑖𝑗 + 𝛽4𝐴𝑑𝑗𝑎𝑐𝑒𝑛𝑡𝑖𝑗 +
𝛽5ln 𝑃𝑃𝐼𝑖𝑡 +𝛽6ln 𝑃𝑃𝐼𝑗𝑡 +𝛽7ln 𝐸𝑖𝑗𝑡 +𝛽8𝑇𝑎𝑟𝑖𝑓𝑓𝑖𝑗𝑡 +𝛽9𝐿𝑎𝑛𝑔𝑢𝑎𝑔𝑒𝑖𝑗 +
β10ln 𝐵𝑢𝑠𝑖𝑛𝑒𝑠𝑠 𝐶𝑦𝑐𝑙𝑒𝑖𝑡 +β11ln 𝐵𝑢𝑠𝑖𝑛𝑒𝑠𝑠 𝐶𝑦𝑐𝑙𝑒𝑗𝑡 +𝛽12ln 𝑇𝐴𝑋
(1)
Where 𝐹𝐷𝐼𝑖𝑗𝑡 is the value of real foreign direct investment flowing from country i to
country j in year t, GDPit
is the real gross domestic product of exporting country i in year t,
GDPjt is the GDP of importing country j in year t, 𝐷𝑖𝑠𝑡𝑎𝑛𝑐𝑒𝑖𝑗 is the physical distance between
countries i and j, Adjacentij is a dummy variable that is equal to unity if countries i and j share a
physical border, PPIit is the producer price index of country i in year t, 𝑃𝑃𝐼𝑗𝑡 is the producer
price index of country j in year t, and 𝐸𝑖𝑗𝑡 is the real exchange rate between countries i and j,
expressed as the value of one unit of country i’s currency in terms of country j’s currency in year
1
The theoretical foundation of the gravity model of FDI is not as fully developed as it is for trade (by, e.g.,
Bergstrand, 1985; 1989), however there is justification for using a gravity model to represent horizontal FDI. Most
studies that have tested the relationship between FDI and trade support this idea (Brainard, 1993; Eaton and Tamura,
1994; Ramkishen and Reinert, 2008).

5
t. This specification is comparable to the gravity model of FDI elsewhere in the literature (e.g.,
Brouwer et al, 2008)
Previous research has found that there are several control variables that are strongly
correlated with the dependent variable and are therefore traditionally included in gravity models.
The first of these is a control for any preferential trading agreements. 𝑇𝑎𝑟𝑖𝑓𝑓𝑖𝑗𝑡 is a matrix of
dummy variables equal to unity in year t when countries i and j are both members of a trade
organization.
2
These trade agreements include agreements on the flow of capital and they have
been shown to significantly impact capital flows (Sarisoy Guerin, 2006). A dummy variable that
indicates whether countries i and j share a common language as their majority language,
𝐿𝑎𝑛𝑔𝑢𝑎𝑔𝑒𝑖𝑗, is included. Third, to capture the effects of fluctuations in real GDP of countries i
and j, 𝐵𝑢𝑠𝑖𝑛𝑒𝑠𝑠 𝐶𝑦𝑐𝑙𝑒𝑖𝑡 and 𝐵𝑢𝑠𝑖𝑛𝑒𝑠𝑠 𝐶𝑦𝑐𝑙𝑒𝑗𝑡 are included. These variables are equal to real
GDP in year t divided by the average of real GDP for countries i and j during the previous 10
years (as in, e.g., Beck and Coskuner, 2007).
Tax effects are measured by the last term, TAX, which denotes a vector containing
lags of the three tax variables examined in this study. The tax variables are tax differentials,
defined as the difference between the exporting and the importing countries’ tax rates. Tax rates
include 𝑇𝐶𝑖𝑗𝑡, which is the difference between consumption tax rates levied by countries i and j
in year t, 𝑇𝐿𝑖𝑗𝑡, for the difference in labor income tax rates and 𝑇𝐾𝑖𝑗𝑡, for the difference in capital
income tax rates. We hypothesize that an increase in the capital income tax rate differential will
increase foreign direct investment outflows so we expect the coefficients of 𝑇𝐾𝑖𝑗𝑡 and its lags to
be positive. Labor income taxes and consumption taxes represent taxes on work effort. There are
two possible responses by producers to increases in these taxes. One is to move production
overseas in search of lower labor costs, thus increasing foreign direct investment outflows. The
other is to divert funds toward domestic operations in order to reduce labor costs by increasing
2
This includes the European Economic Community (EEC) and European Union, the General Agreement on Tariffs
and Trade (GATT) and the World Trade Organization (WTO), the European Free Trade Association (EFTA) and the
North American Free Trade Agreement (NAFTA).

6
capital intensity, thus reducing investment outflows. Hence, the coefficients of 𝑇𝐿𝑖𝑗𝑡 and of 𝑇𝐶𝑖𝑗𝑡
and their lags could have either sign.
In order to capture the cumulative impact of the tax, each specification uses eight
lags of the respective tax variable. We choose eight years as the maximum for the long-term lag
based on the observation that the t-statistics of tax ratios lagged up to eight years were
statistically significant whereas they were insignificant beyond eight years in the vast majority of
models tested.
III. Data
Three methods of calculating tax rates have been used in the literature: statutory tax rates,
tax ratios, i.e., average effective tax rates (AETRs), and marginal effective tax rates (METRs)
(Hajkova et al., 2006; de Mooij and Ederveen, 2008). Statutory tax rates have been widely
viewed as unsatisfactory compared to AETRs (e.g., Egger and Radulescu, 2008; Hajkova, 2006;
Wolff, 2007; de Mooij and Ederveen, 2008). METRs are computed for hypothetical cases and
therefore take into account firms’ expectations of tax burdens.
3
However, the advantage of tax
ratios is that they provide data on taxes actually paid, and so incorporate firms’ tax minimizing
strategies. Although they are far from perfect, they are reasonable proxies for marginal tax rates
and therefore, they are used here. We describe these data further below as well as our
extensions.
Tax Rates
Mendoza et al. (1994) first calculated tax ratios for the G-7 countries between 1965
and 1988.
4
Carey and Rabesona (2002) updated these tax ratio data to include 25 countries
between 1975 and 2000 using the SNA93 National Accounts data. We use their methods,
3
Bénassy-Quéré et al. (2001) use several measures including tax ratios and METRs. All four measures of capital
income taxes are shown to have significant impacts. Papers that have used tax ratios to calculate the tax rate at the
microeconomic level are Altshuler and Newlon, (1993), Büttner (2001) and Stowhase (2002). In their survey De
Mooij and Ederveen (2008) note that estimates using AETRs are generally larger than those using METRs.
4
Volkerink and de Haan (2000) provide an organized and thorough overview of the literature on tax ratio
computations alongside of their own calculations of Mendoza, et al. (1997)’s.
7
described in Cary and Tchilinguirian (2000), to extend the tax ratio data to include 25 OECD
countries between 1975 and 2006. To construct the tax ratios, tax revenue data published by the
OECD are divided into components which are levied on consumption, labor, and capital. These
revenues form the numerators of the tax ratios. The denominators are formed by the base on
which each of these taxes were levied and are determined by using each country’s national
accounts data.
5
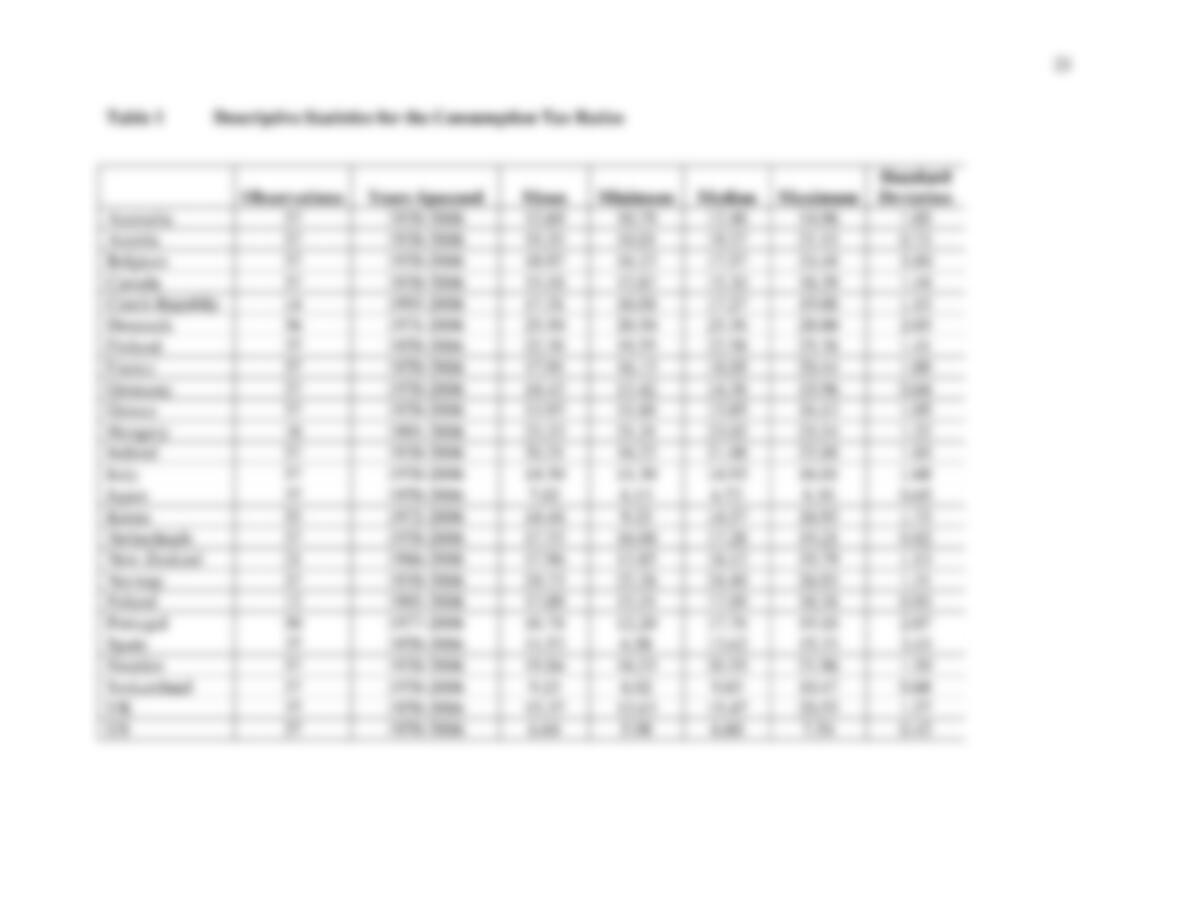
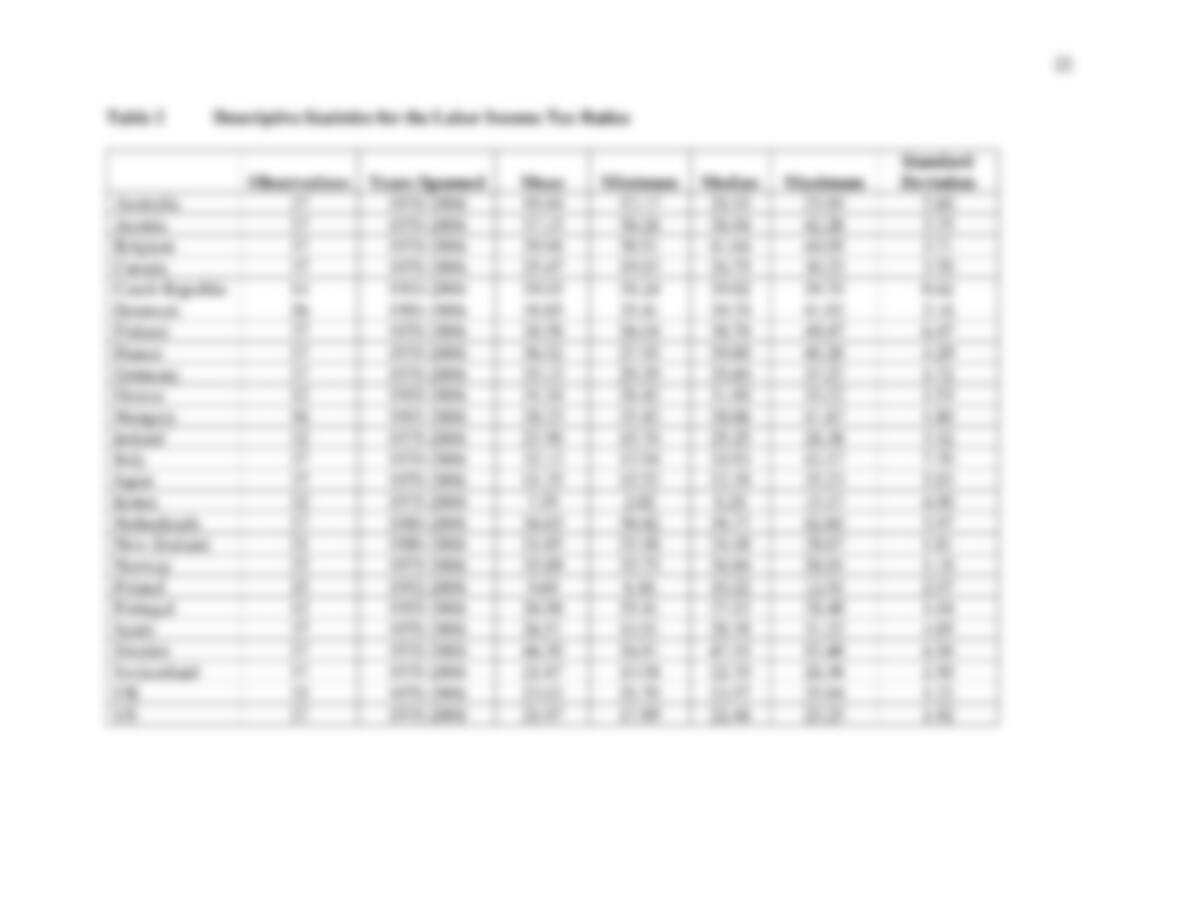
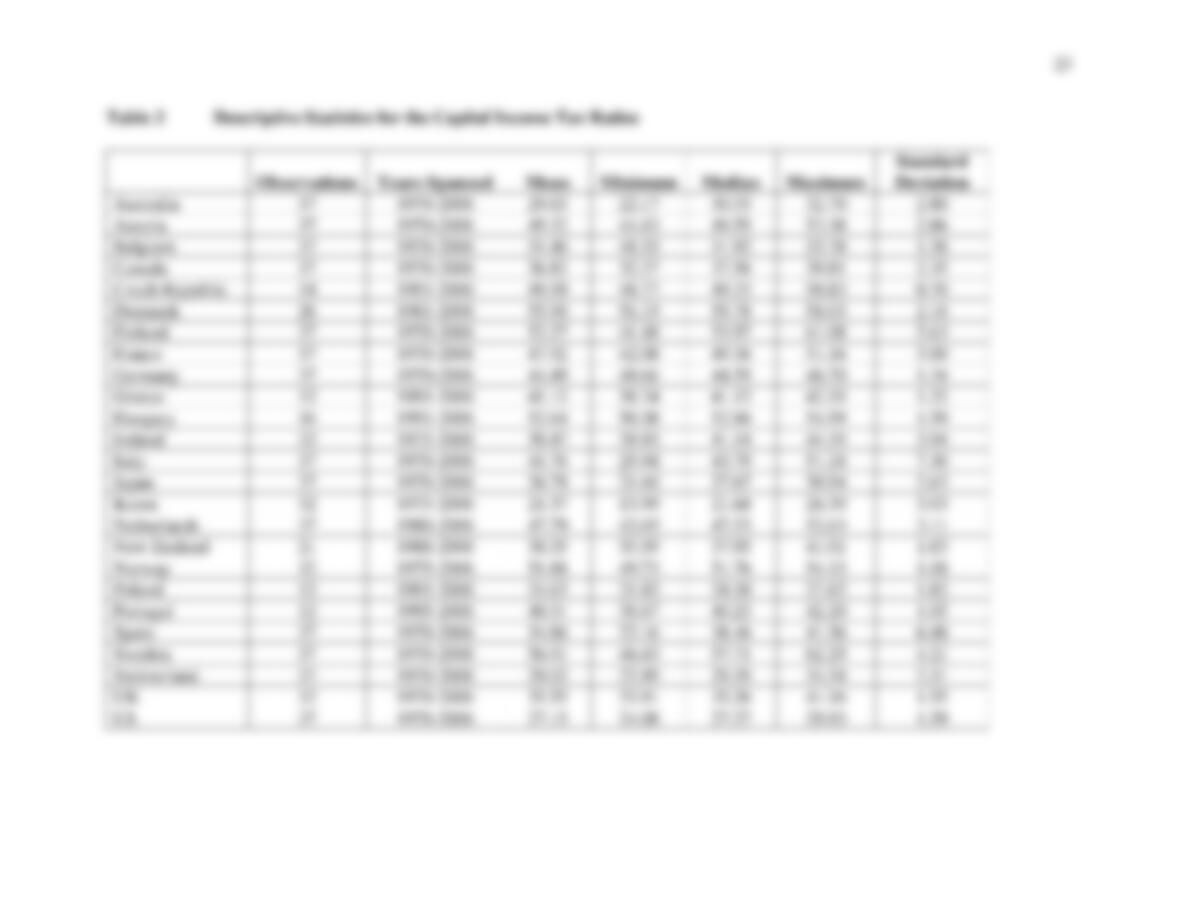
Tables 1-3 contain descriptive statistics of our updated tax ratio dataset.
6
Foreign Direct Investment
Foreign direct investment data are obtained from the Foreign Direct Investment
Statistics published by the OECD.stat database. These data are an unbalanced panel of annual
data containing FDI outward flows between each pair of countries included in this study in
nominal US dollars for 1985 through 2006. These data are converted to real US dollar values
using the OECD’s annual exchange rates and gross total fixed capital formation deflators.
Included in the measure of FDI are earnings from investments by foreign entities that are